| Param | Original file | Final file |
|---|---|---|
| Filename | modeM0/AS1T05_106T01_9000005642_41299cztM0_level2.fits | modeM0/AS1T05_106T01_9000005642_41299cztM0_level2_quad_clean.evt |
| Size (bytes) | 374,065,920 | 89,161,920 |
| Size | 356.7 MB | 85.0 MB |
| Events in quadrant A | 2,986,004 | 614,680 |
| Events in quadrant B | 2,541,970 | 644,672 |
| Events in quadrant C | 3,239,907 | 573,213 |
| Events in quadrant D | 4,668,833 | 498,580 |
| Mode M0 | |||
|---|---|---|---|
| Quadrant | BADHDUFLAG | Total packets | Discarded packets |
| A | 0 | 11962 | 3 |
| B | 0 | 11060 | 2 |
| C | 0 | 12733 | 2 |
| D | 0 | 17443 | 2 |
| Mode SS | |||
|---|---|---|---|
| Quadrant | BADHDUFLAG | Total packets | Discarded packets |
| A | 0 | 108 | 0 |
| B | 0 | 108 | 0 |
| C | 0 | 108 | 0 |
| D | 0 | 108 | 0 |
| Mode M9 | |||
|---|---|---|---|
| Quadrant | BADHDUFLAG | Total packets | Discarded packets |
| A | 0 | 33 | 0 |
| B | 0 | 33 | 0 |
| C | 0 | 33 | 0 |
| D | 0 | 34 | 0 |
| Quadrant | Total seconds | Saturated seconds | Saturation percentage |
|---|---|---|---|
| A | 5265 | 32 | 0.607787% |
| B | 5265 | 7 | 0.132953% |
| C | 5265 | 284 | 5.394112% |
| D | 5265 | 633 | 12.022792% |
Noise dominated data is calculated using 1-second bins in cleaned event files. If a bin has >2000 counts, and if more than 50% of those come from <1% of pixels, then it is considered to be noise-dominated and hence unusable.
| Quadrant | # 1 sec bins | Bins with >0 counts | Bins with >2000 counts | High rate bins dominated by noise | Noise dominated (total time) | Noise dominated (detector-on time) | Marked lightcurve |
|---|---|---|---|---|---|---|---|
| A | 7208 | 5266 | 32 | 32 | 0.44% | 0.61% | 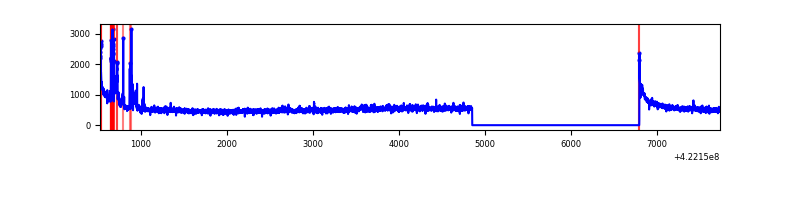 |
| B | 7208 | 5266 | 1 | 1 | 0.01% | 0.02% | 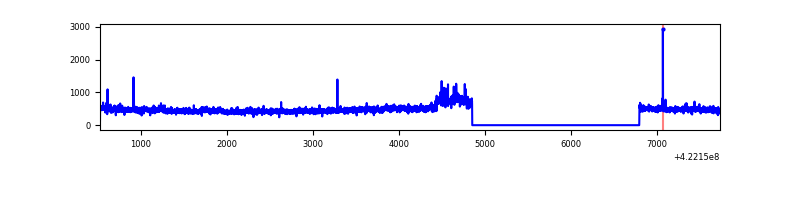 |
| C | 7208 | 5266 | 275 | 275 | 3.82% | 5.22% | 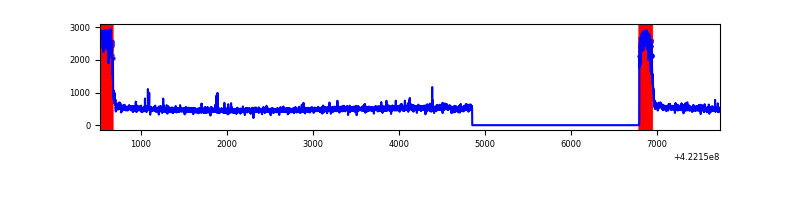 |
| D | 7208 | 5266 | 635 | 635 | 8.81% | 12.06% | 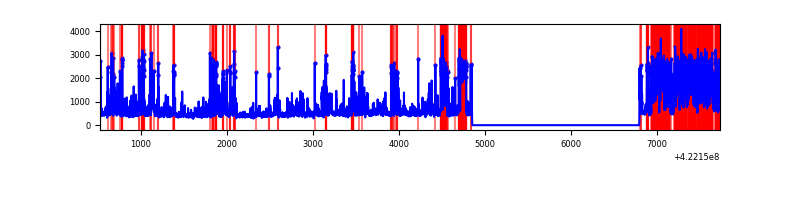 |
Top three noisy pixels from each quadrant. If the there are fewer than three noisy pixels in the level2.evt file, extra rows are filled as -1
| Pixel properties | Quadrant properties | ||||||
|---|---|---|---|---|---|---|---|
| Quadrant | DetID | PixID | Counts | Sigma | Mean | Median | Sigma |
| A | 10 | 83 | 496582 | 4172.75 | 585 | 574 | 118.9 |
| A | 6 | 10 | 164346 | 1377.76 | 585 | 574 | 118.9 |
| A | 12 | 189 | 60259 | 502.11 | 585 | 574 | 118.9 |
| B | 7 | 202 | 150767 | 1327.36 | 591 | 574 | 113.2 |
| B | 0 | 229 | 24003 | 207.06 | 591 | 574 | 113.2 |
| B | 0 | 245 | 16129 | 137.47 | 591 | 574 | 113.2 |
| C | 0 | 10 | 803010 | 6114.74 | 564 | 567 | 131.2 |
| C | 15 | 214 | 218866 | 1663.47 | 564 | 567 | 131.2 |
| C | 12 | 249 | 17225 | 126.94 | 564 | 567 | 131.2 |
| D | 1 | 47 | 1054356 | 7828.86 | 551 | 534 | 134.6 |
| D | 2 | 249 | 425250 | 3155.22 | 551 | 534 | 134.6 |
| D | 12 | 233 | 356911 | 2647.53 | 551 | 534 | 134.6 |
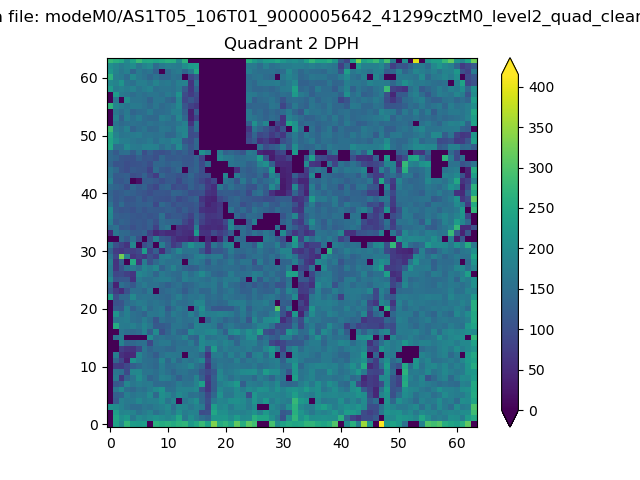
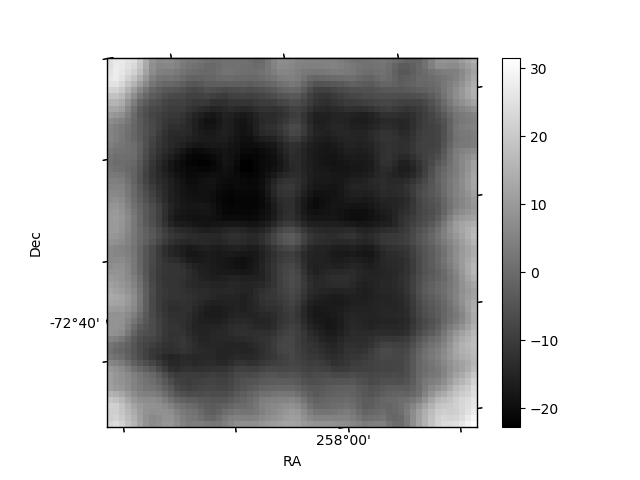
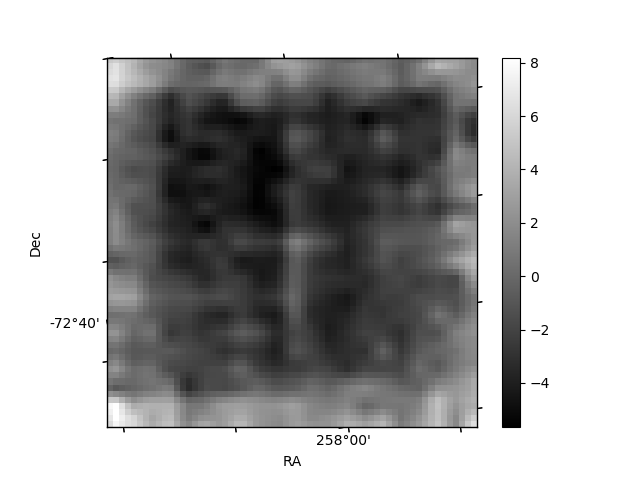
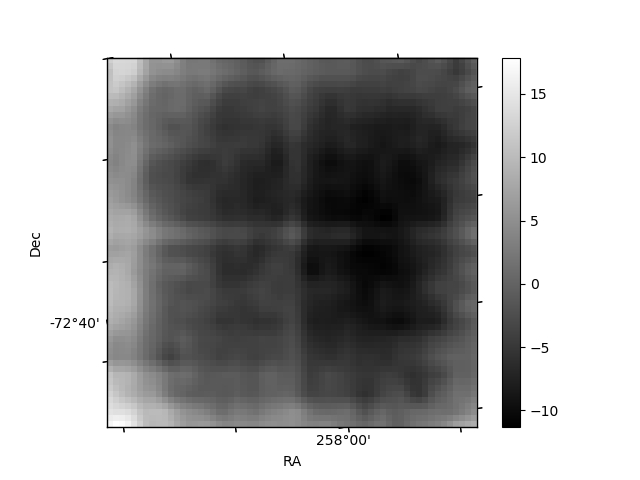
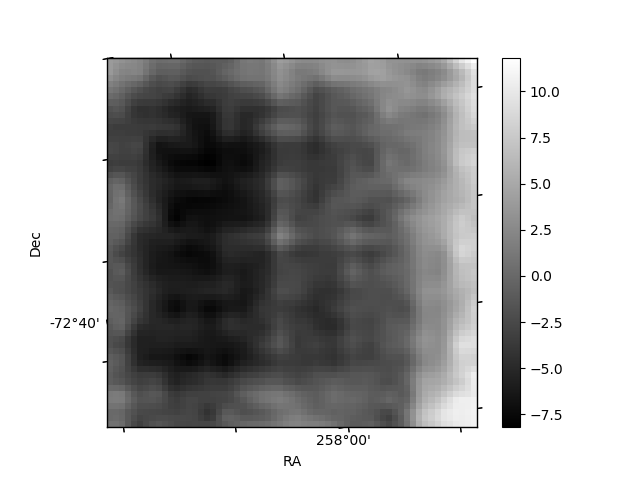
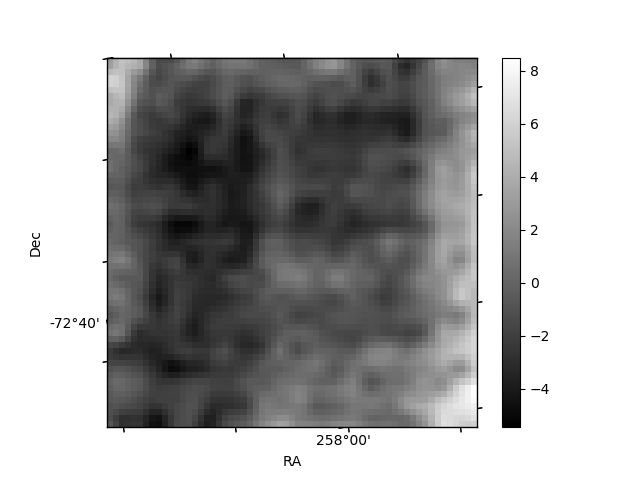
Histogram calculated using DETX and DETY for each event in the final _common_clean file
| Quadrant A | 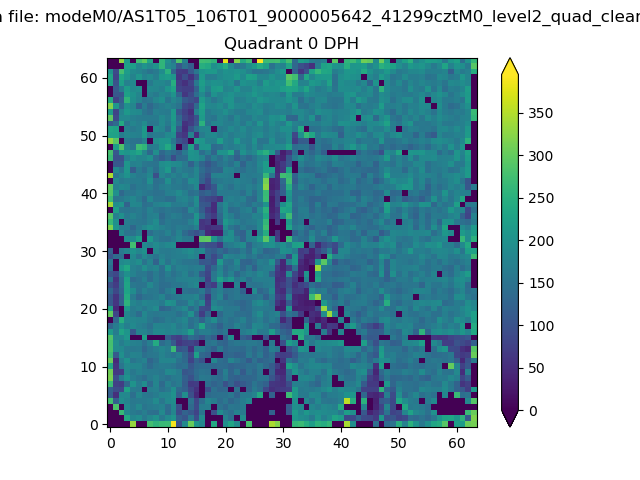 |
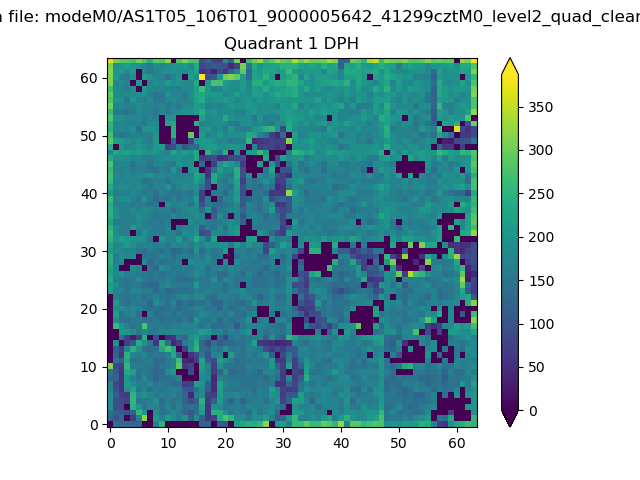 |
Quadrant B |
|---|---|---|---|
| Quadrant D | 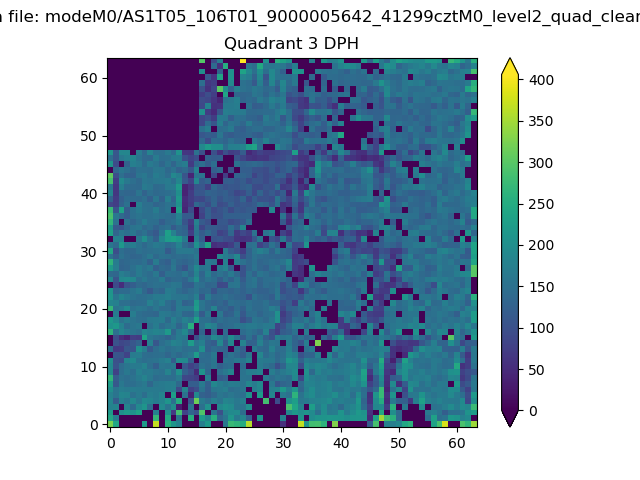 |
 |
Quadrant C |
| Plot type | Count rate plots | Images |
|---|---|---|
| Comparison with Poisson distribution Blue bars denote a histogram of data divided into 1 sec bins. Red curve is a Poisson curve with rate = median count rate of data. |
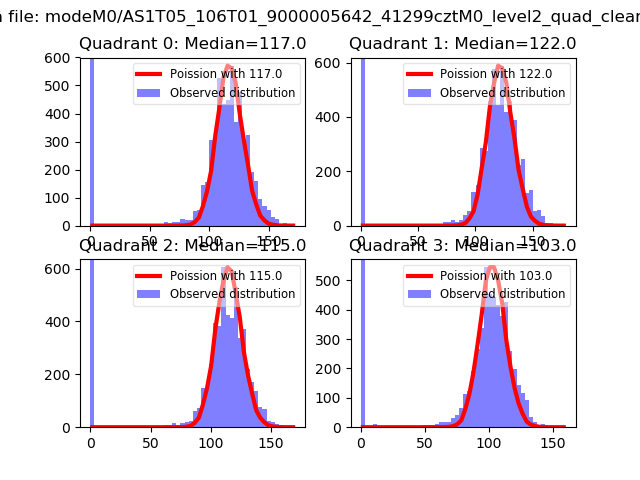 |
 |
| Quadrant-wise count rates Data is divided into 100 sec bins |
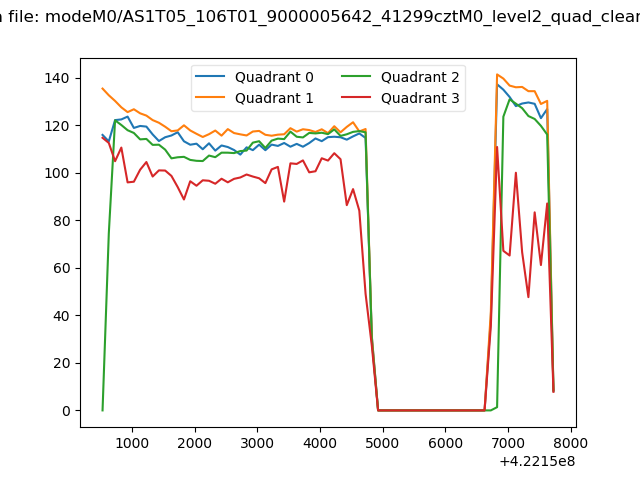 |
|
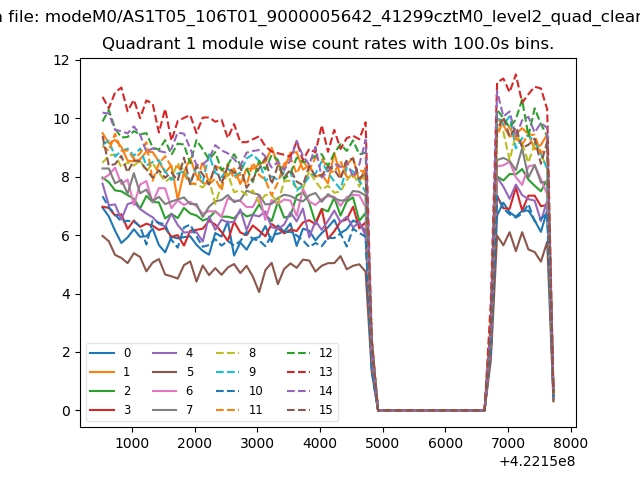
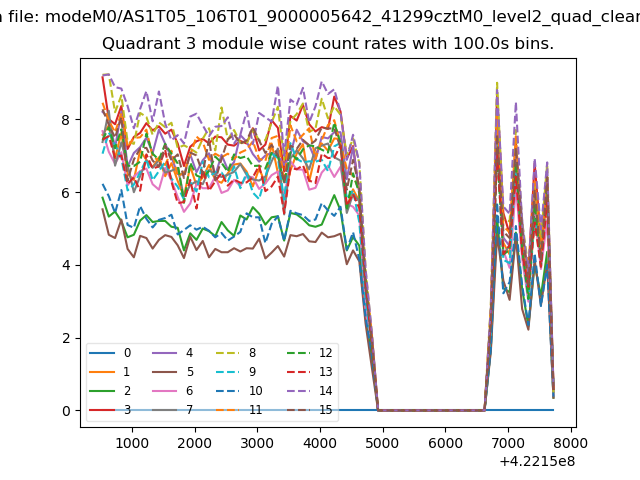
| Module-wise count rates for Quadrant A Data is divided into 100 sec bins |
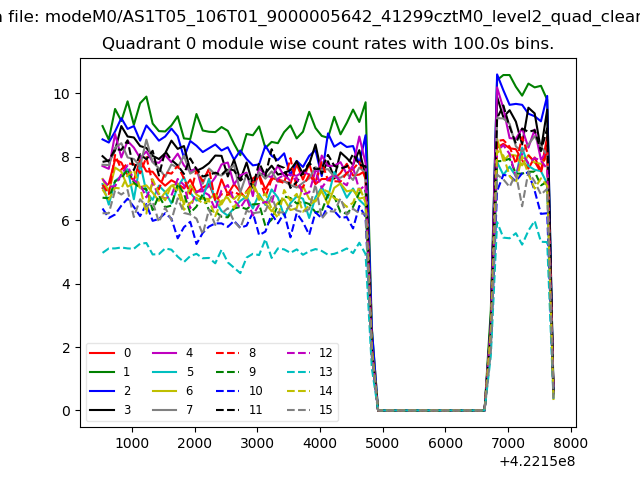 |
 |
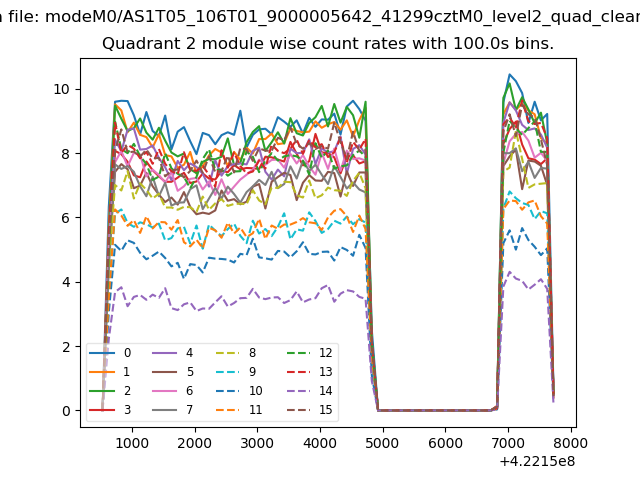
| Module-wise count rates for Quadrant B Data is divided into 100 sec bins |
 |
 |
| Module-wise count rates for Quadrant C Data is divided into 100 sec bins |
 |
 |
| Module-wise count rates for Quadrant D Data is divided into 100 sec bins |
 |
 |
| Parameter | Plot |
|---|---|
| CZT HV Monitor | 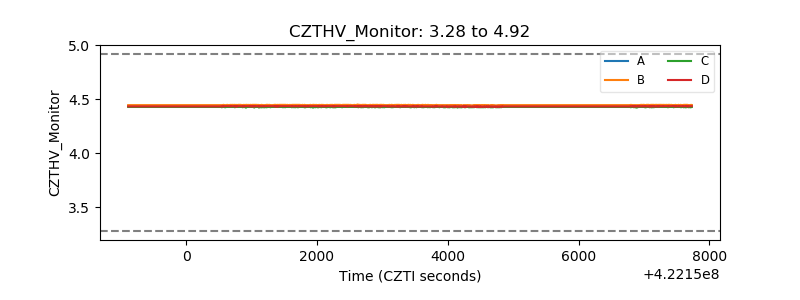 |
| D_VDD | 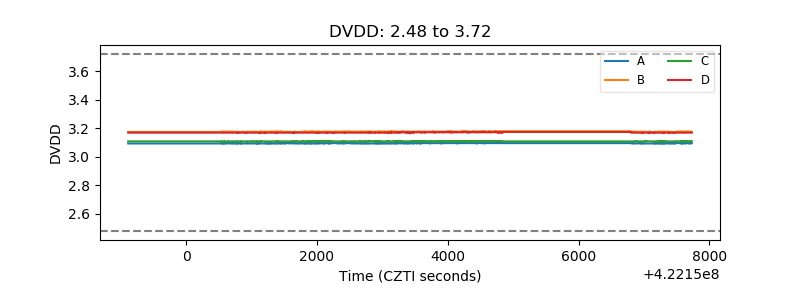 |
| Temperature 1 | 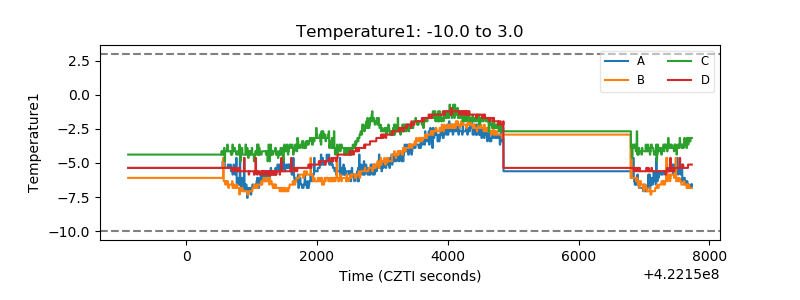 |
| Veto HV Monitor | 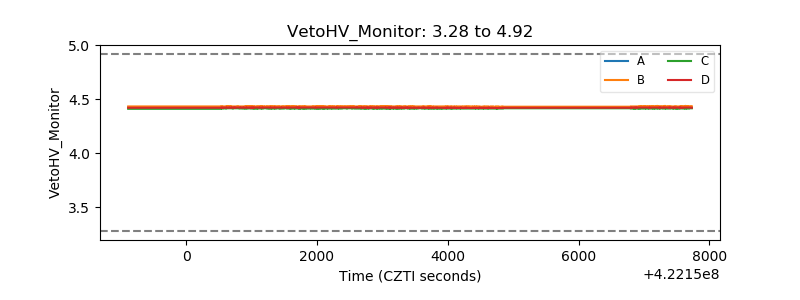 |
| Veto LLD | 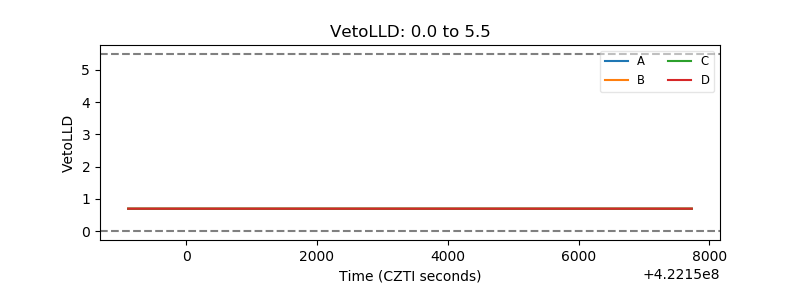 |
| Alpha Counter | 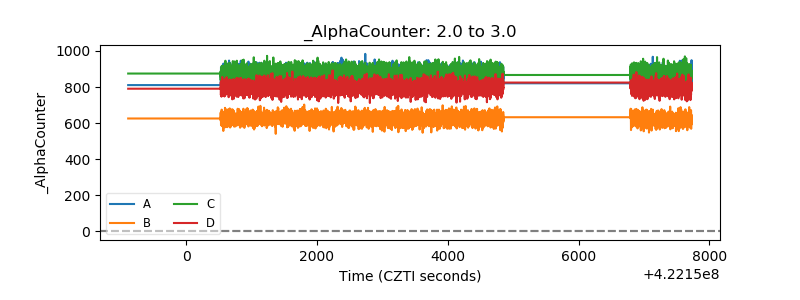 |
| _CPM_Rate | 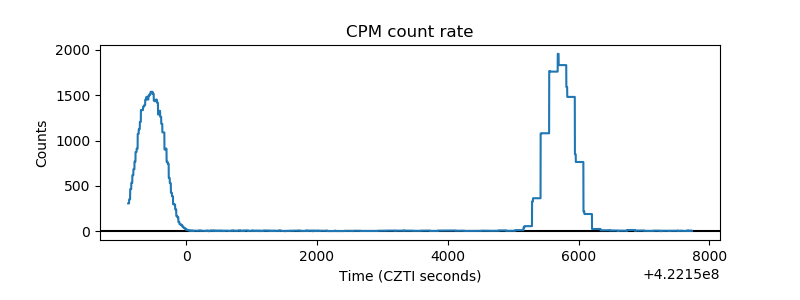 |
| CZT Counter | 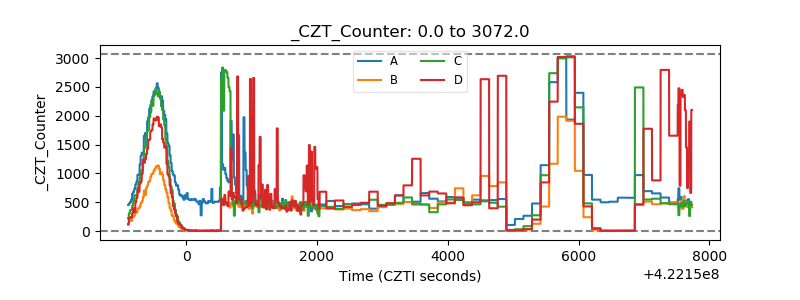 |
| +2.5 Volts monitor |  |
| +5 Volts monitor |  |
| _ROLL_ROT | 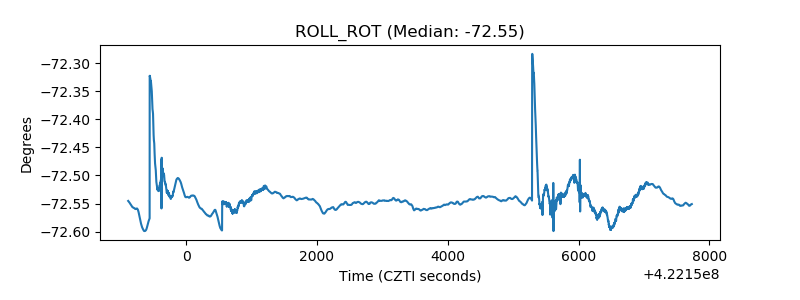 |
| _Roll_DEC | 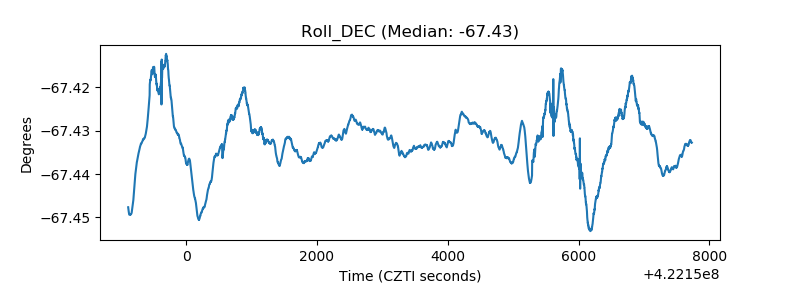 |
| _Roll_RA | 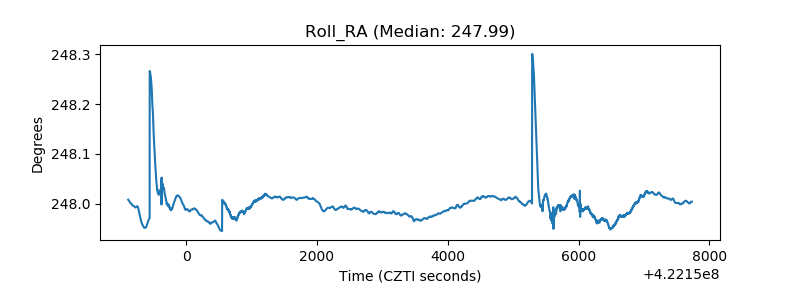 |
| Veto Counter | 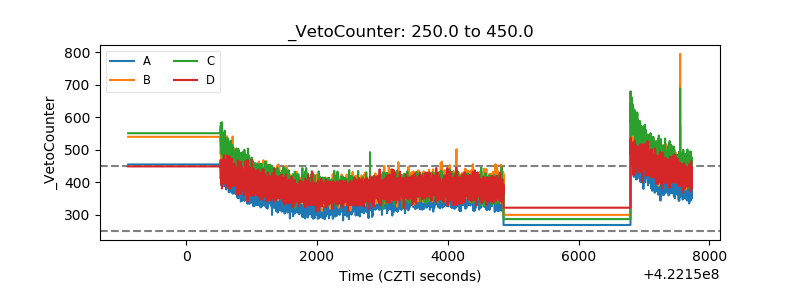 |