| Param | Original file | Final file |
|---|---|---|
| Filename | modeM0/AS1T05_106T01_9000005642_41300cztM0_level2.fits | modeM0/AS1T05_106T01_9000005642_41300cztM0_level2_quad_clean.evt |
| Size (bytes) | 514,543,680 | 82,491,840 |
| Size | 490.7 MB | 78.7 MB |
| Events in quadrant A | 3,072,179 | 617,405 |
| Events in quadrant B | 2,616,075 | 654,617 |
| Events in quadrant C | 3,188,988 | 584,405 |
| Events in quadrant D | 9,769,401 | 281,373 |
| Mode M0 | |||
|---|---|---|---|
| Quadrant | BADHDUFLAG | Total packets | Discarded packets |
| A | 0 | 12149 | 3 |
| B | 0 | 11102 | 2 |
| C | 0 | 12388 | 2 |
| D | 0 | 32555 | 2 |
| Mode SS | |||
|---|---|---|---|
| Quadrant | BADHDUFLAG | Total packets | Discarded packets |
| A | 0 | 104 | 0 |
| B | 0 | 104 | 0 |
| C | 0 | 104 | 0 |
| D | 0 | 104 | 0 |
| Mode M9 | |||
|---|---|---|---|
| Quadrant | BADHDUFLAG | Total packets | Discarded packets |
| A | 0 | 22 | 0 |
| B | 0 | 22 | 0 |
| C | 0 | 22 | 0 |
| D | 0 | 23 | 0 |
| Quadrant | Total seconds | Saturated seconds | Saturation percentage |
|---|---|---|---|
| A | 5142 | 73 | 1.419681% |
| B | 5142 | 14 | 0.272268% |
| C | 5142 | 278 | 5.406457% |
| D | 5142 | 2879 | 55.989887% |
Noise dominated data is calculated using 1-second bins in cleaned event files. If a bin has >2000 counts, and if more than 50% of those come from <1% of pixels, then it is considered to be noise-dominated and hence unusable.
| Quadrant | # 1 sec bins | Bins with >0 counts | Bins with >2000 counts | High rate bins dominated by noise | Noise dominated (total time) | Noise dominated (detector-on time) | Marked lightcurve |
|---|---|---|---|---|---|---|---|
| A | 7205 | 5143 | 58 | 58 | 0.80% | 1.13% | 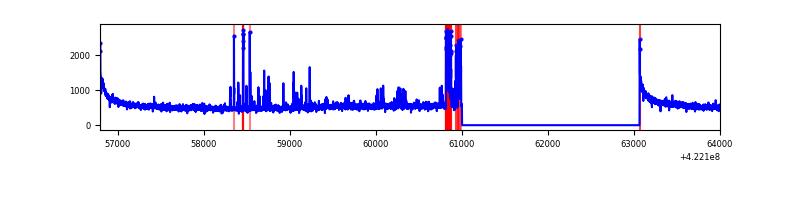 |
| B | 7205 | 5143 | 6 | 6 | 0.08% | 0.12% | 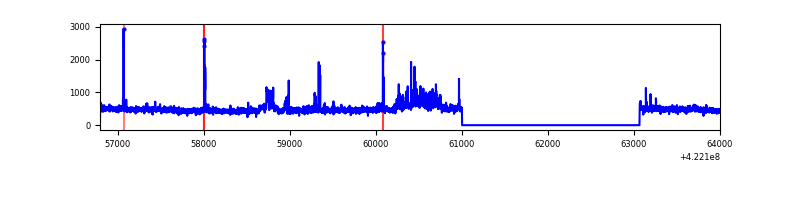 |
| C | 7205 | 5143 | 263 | 263 | 3.65% | 5.11% | 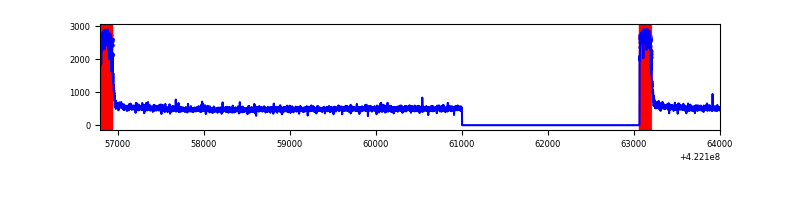 |
| D | 7205 | 5143 | 2831 | 2831 | 39.29% | 55.05% | 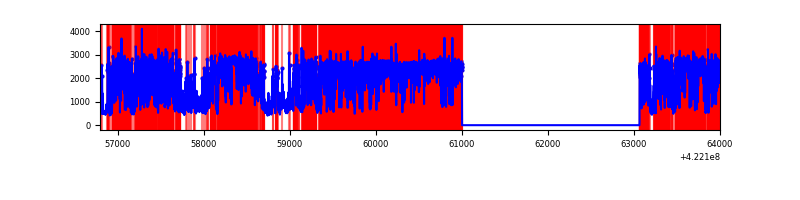 |
Top three noisy pixels from each quadrant. If the there are fewer than three noisy pixels in the level2.evt file, extra rows are filled as -1
| Pixel properties | Quadrant properties | ||||||
|---|---|---|---|---|---|---|---|
| Quadrant | DetID | PixID | Counts | Sigma | Mean | Median | Sigma |
| A | 10 | 83 | 499095 | 4194.21 | 584 | 574 | 118.9 |
| A | 13 | 248 | 161956 | 1357.76 | 584 | 574 | 118.9 |
| A | 6 | 10 | 87379 | 730.32 | 584 | 574 | 118.9 |
| B | 0 | 186 | 108053 | 964.06 | 591 | 575 | 111.5 |
| B | 5 | 255 | 65292 | 580.5 | 591 | 575 | 111.5 |
| B | 7 | 202 | 59778 | 531.04 | 591 | 575 | 111.5 |
| C | 0 | 10 | 765652 | 5868.24 | 565 | 568 | 130.4 |
| C | 15 | 214 | 214301 | 1639.34 | 565 | 568 | 130.4 |
| C | 13 | 61 | 3699 | 24.01 | 565 | 568 | 130.4 |
| D | 1 | 47 | 6467168 | 62452.71 | 425 | 412 | 103.5 |
| D | 2 | 249 | 626791 | 6049.26 | 425 | 412 | 103.5 |
| D | 5 | 222 | 358105 | 3454.42 | 425 | 412 | 103.5 |
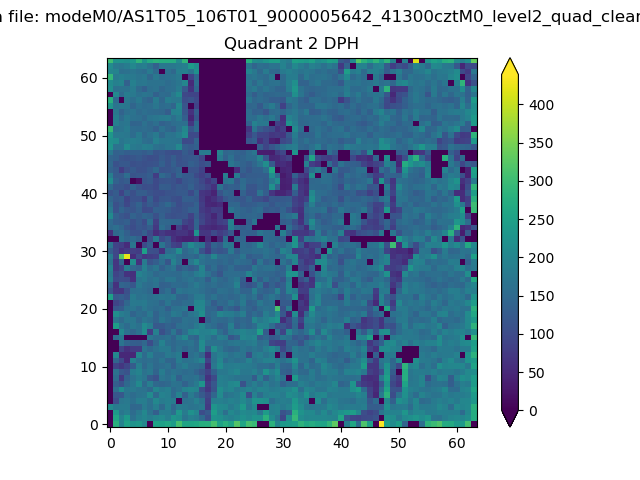
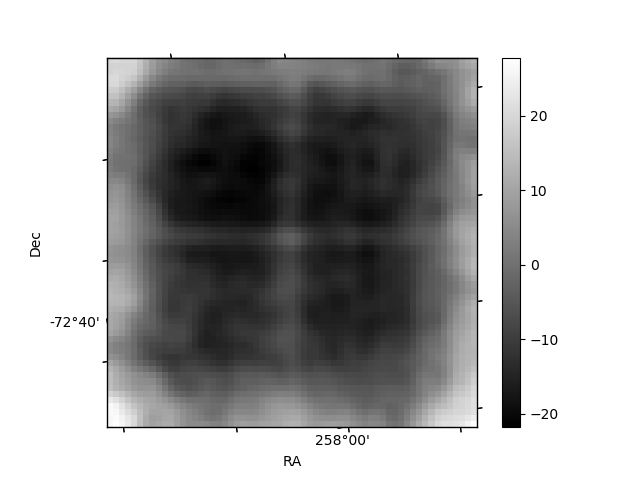
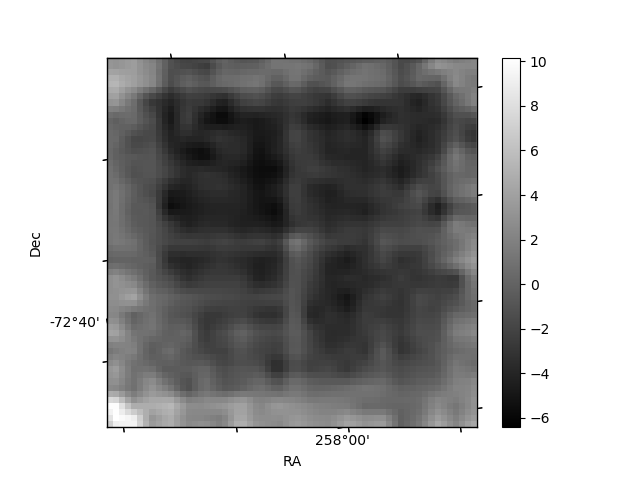
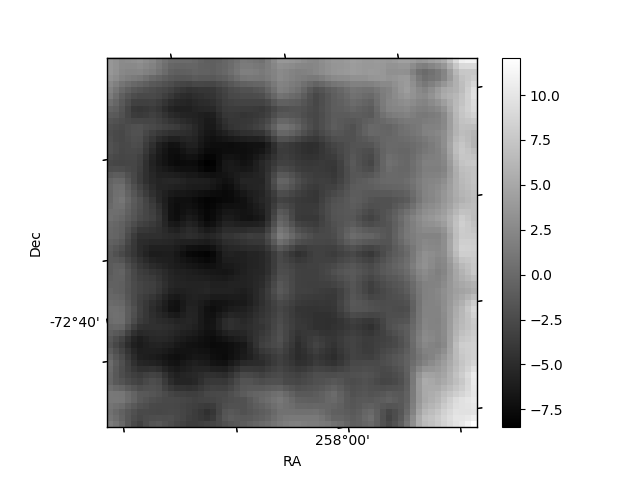
Histogram calculated using DETX and DETY for each event in the final _common_clean file
| Quadrant A | 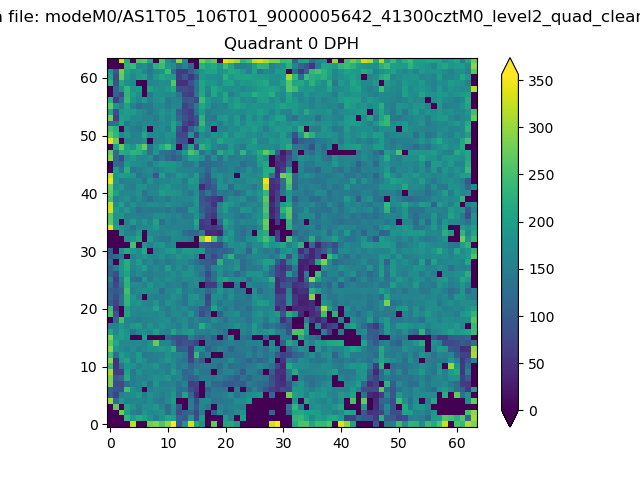 |
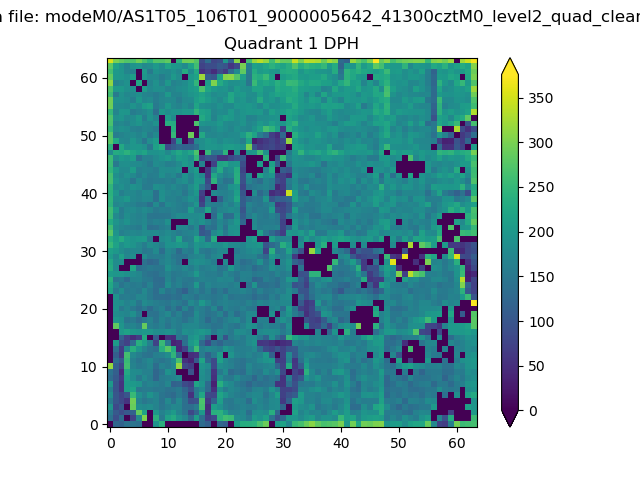 |
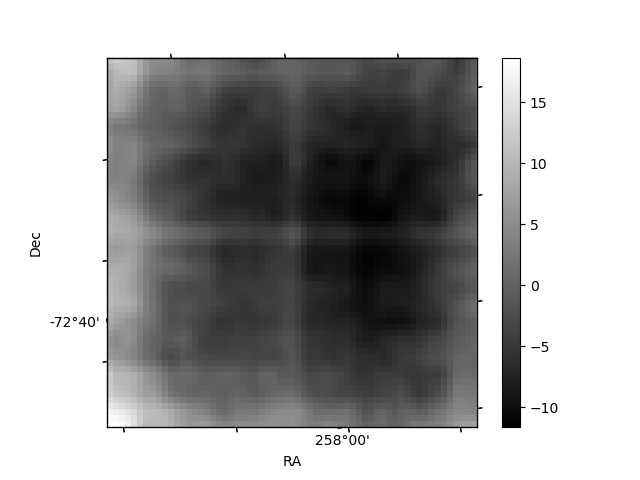
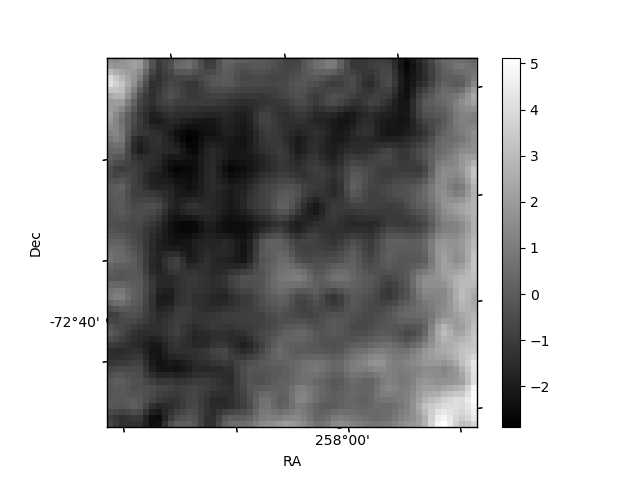
Quadrant B |
|---|---|---|---|
| Quadrant D | 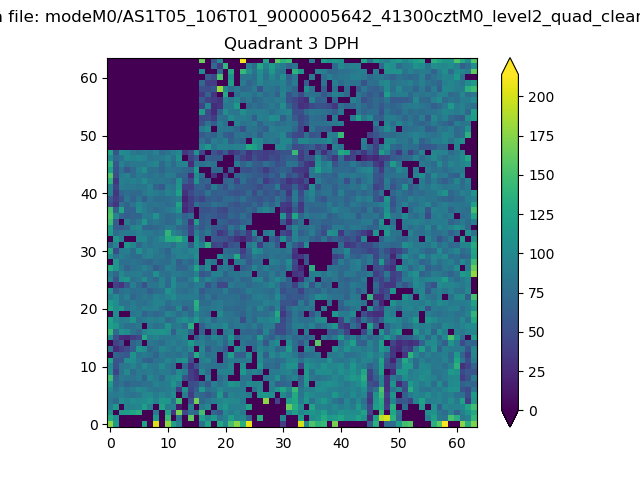 |
 |
Quadrant C |
| Plot type | Count rate plots | Images |
|---|---|---|
| Comparison with Poisson distribution Blue bars denote a histogram of data divided into 1 sec bins. Red curve is a Poisson curve with rate = median count rate of data. |
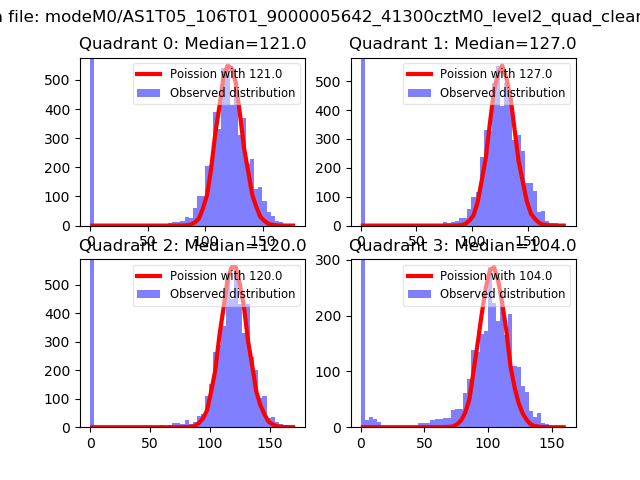 |
 |
| Quadrant-wise count rates Data is divided into 100 sec bins |
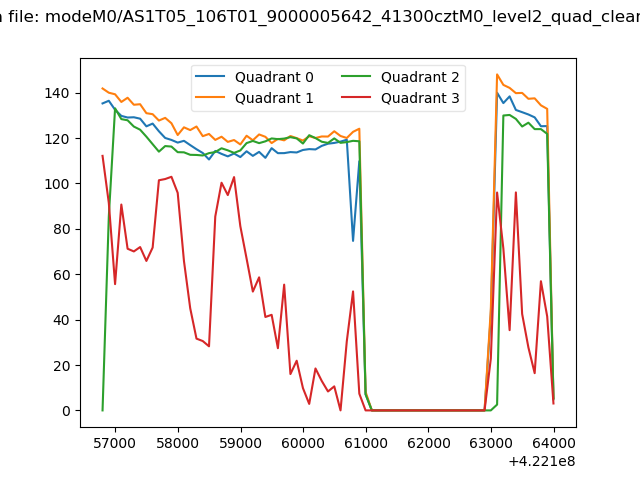 |
|
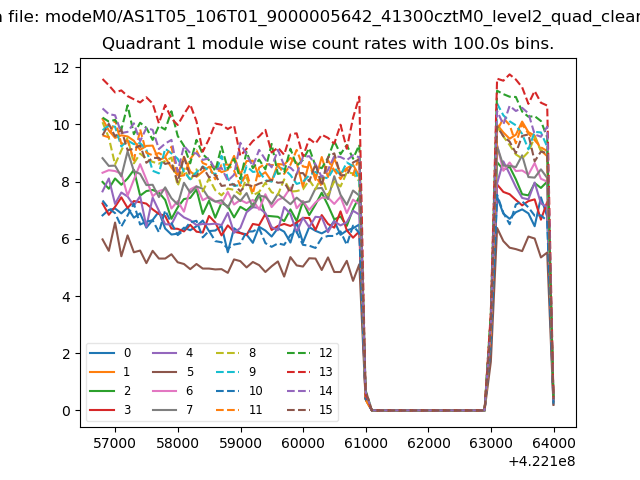
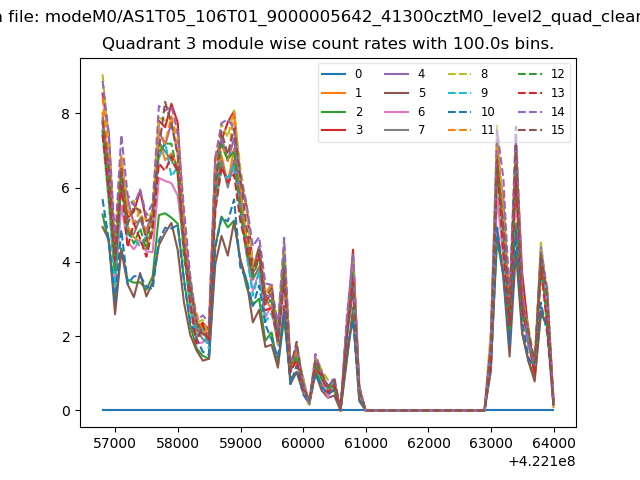
| Module-wise count rates for Quadrant A Data is divided into 100 sec bins |
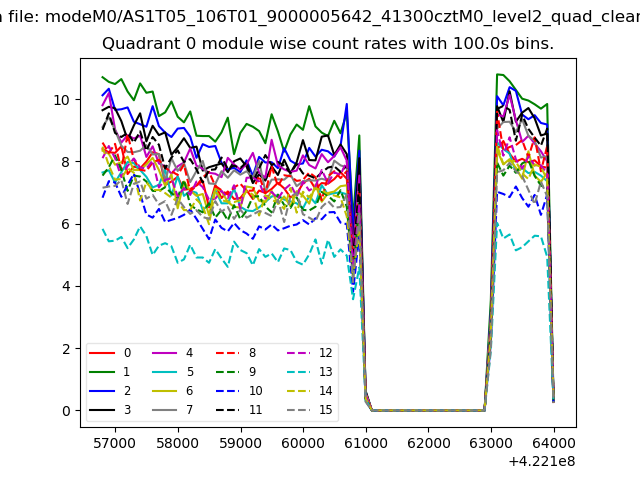 |
 |
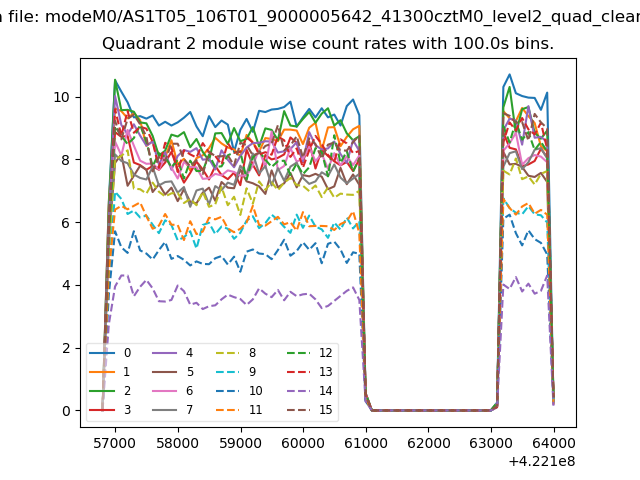
| Module-wise count rates for Quadrant B Data is divided into 100 sec bins |
 |
 |
| Module-wise count rates for Quadrant C Data is divided into 100 sec bins |
 |
 |
| Module-wise count rates for Quadrant D Data is divided into 100 sec bins |
 |
 |
| Parameter | Plot |
|---|---|
| CZT HV Monitor | 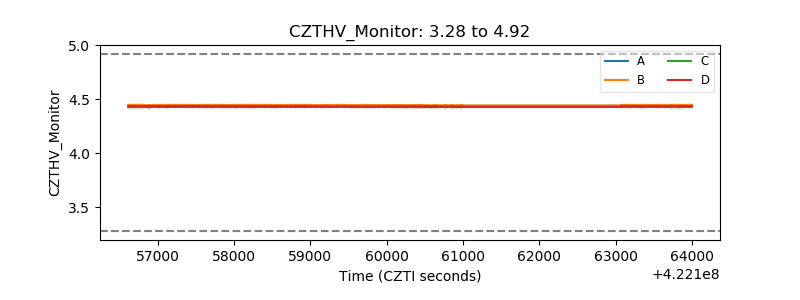 |
| D_VDD | 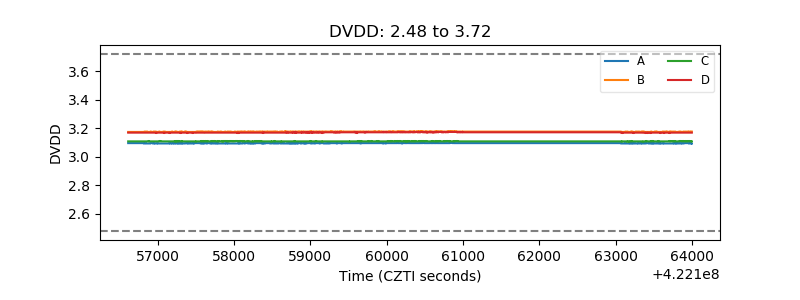 |
| Temperature 1 | 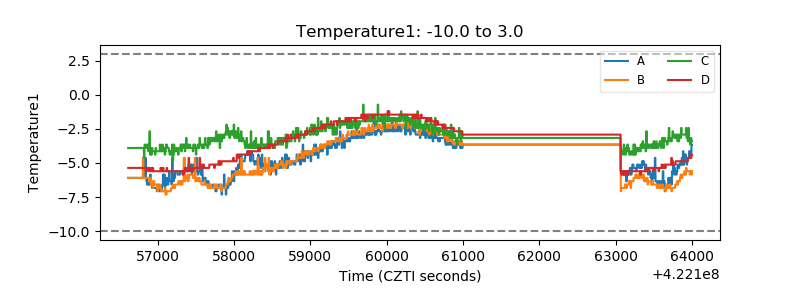 |
| Veto HV Monitor | 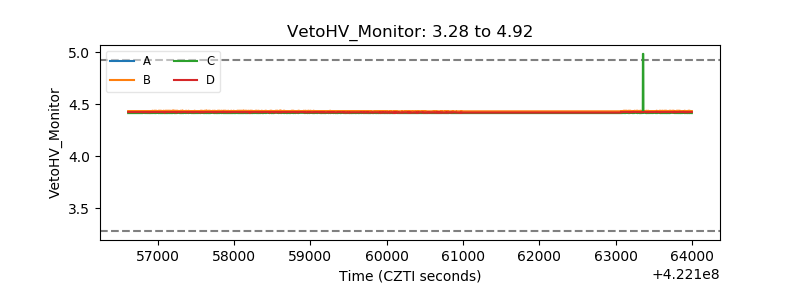 |
| Veto LLD | 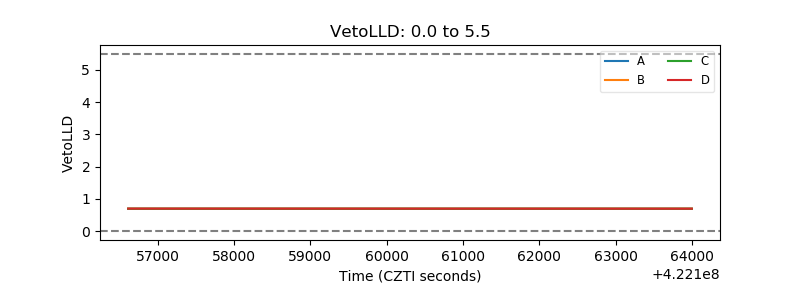 |
| Alpha Counter | 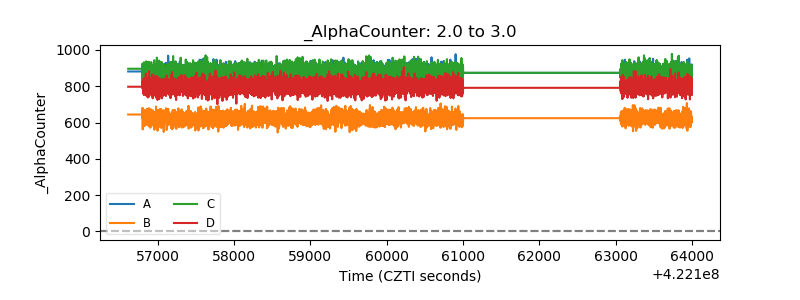 |
| _CPM_Rate | 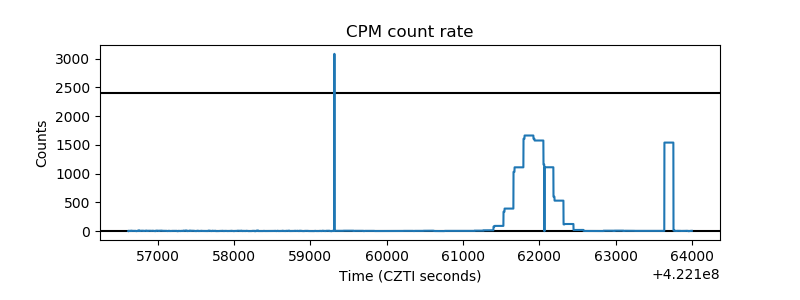 |
| CZT Counter | 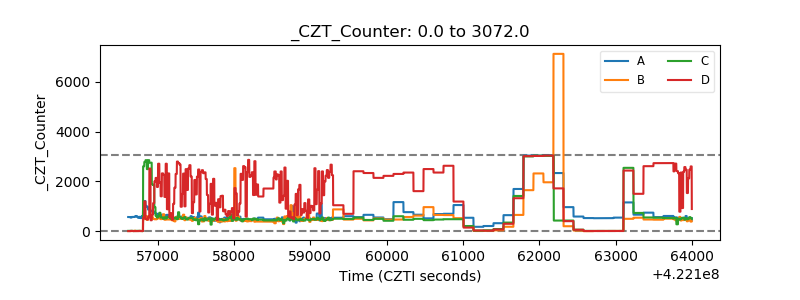 |
| +2.5 Volts monitor | 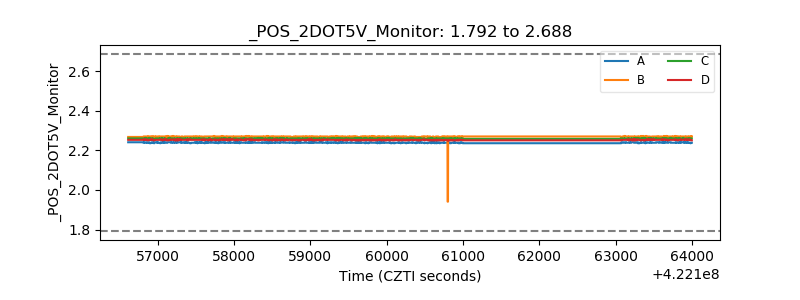 |
| +5 Volts monitor | 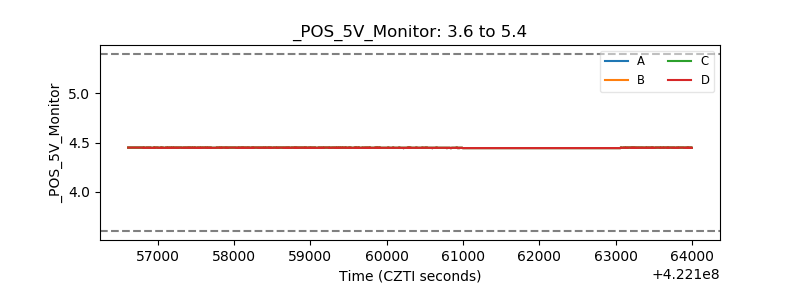 |
| _ROLL_ROT | 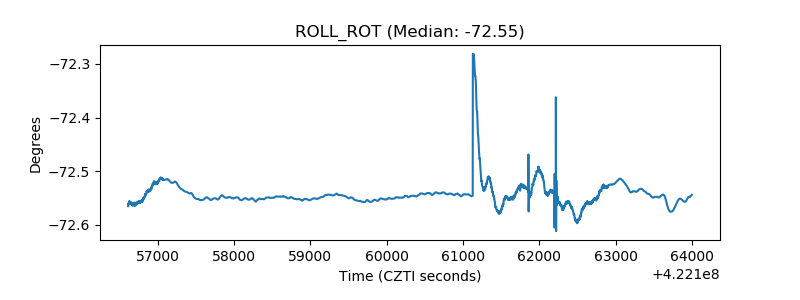 |
| _Roll_DEC | 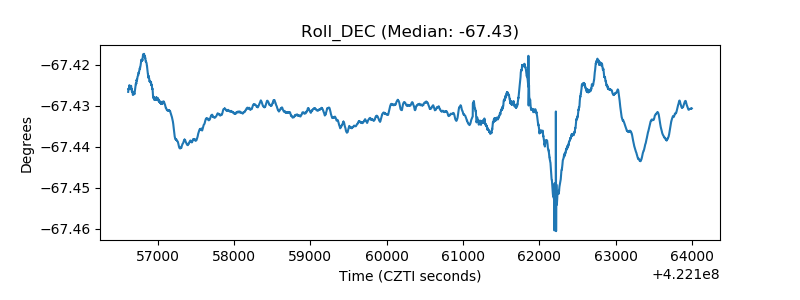 |
| _Roll_RA | 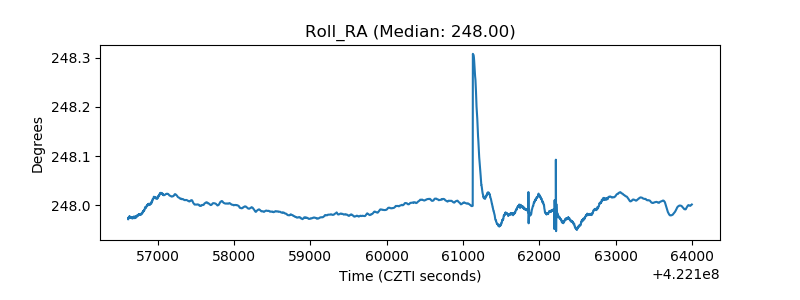 |
| Veto Counter | 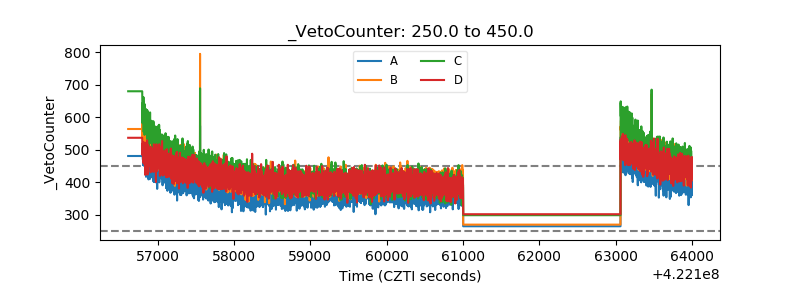 |