| Param | Original file | Final file |
|---|---|---|
| Filename | modeM0/AS1T05_106T01_9000005642_41301cztM0_level2.fits | modeM0/AS1T05_106T01_9000005642_41301cztM0_level2_quad_clean.evt |
| Size (bytes) | 362,761,920 | 81,325,440 |
| Size | 346.0 MB | 77.6 MB |
| Events in quadrant A | 2,573,920 | 567,659 |
| Events in quadrant B | 2,334,241 | 596,353 |
| Events in quadrant C | 2,653,552 | 552,707 |
| Events in quadrant D | 5,499,604 | 414,955 |
| Mode M0 | |||
|---|---|---|---|
| Quadrant | BADHDUFLAG | Total packets | Discarded packets |
| A | 0 | 10327 | 2 |
| B | 0 | 10022 | 1 |
| C | 0 | 10489 | 1 |
| D | 0 | 19489 | 1 |
| Mode SS | |||
|---|---|---|---|
| Quadrant | BADHDUFLAG | Total packets | Discarded packets |
| A | 0 | 98 | 0 |
| B | 0 | 98 | 0 |
| C | 0 | 98 | 0 |
| D | 0 | 98 | 0 |
| Mode M9 | |||
|---|---|---|---|
| Quadrant | BADHDUFLAG | Total packets | Discarded packets |
| A | 0 | 21 | 0 |
| B | 0 | 21 | 0 |
| C | 0 | 21 | 0 |
| D | 0 | 21 | 0 |
| Quadrant | Total seconds | Saturated seconds | Saturation percentage |
|---|---|---|---|
| A | 4706 | 7 | 0.148746% |
| B | 4706 | 16 | 0.339992% |
| C | 4706 | 142 | 3.017425% |
| D | 4706 | 1102 | 23.416915% |
Noise dominated data is calculated using 1-second bins in cleaned event files. If a bin has >2000 counts, and if more than 50% of those come from <1% of pixels, then it is considered to be noise-dominated and hence unusable.
| Quadrant | # 1 sec bins | Bins with >0 counts | Bins with >2000 counts | High rate bins dominated by noise | Noise dominated (total time) | Noise dominated (detector-on time) | Marked lightcurve |
|---|---|---|---|---|---|---|---|
| A | 6829 | 4707 | 3 | 3 | 0.04% | 0.06% | 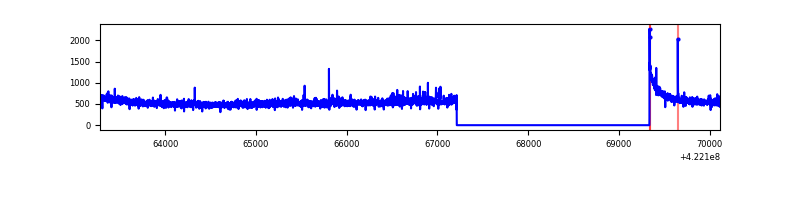 |
| B | 6829 | 4707 | 3 | 3 | 0.04% | 0.06% | 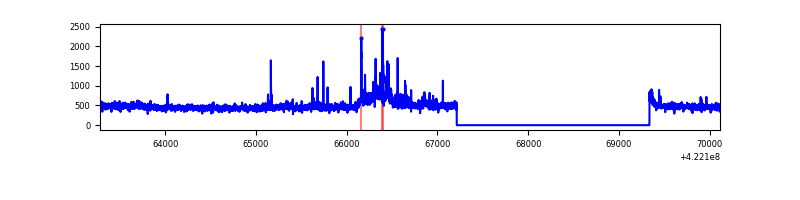 |
| C | 6829 | 4707 | 128 | 128 | 1.87% | 2.72% | 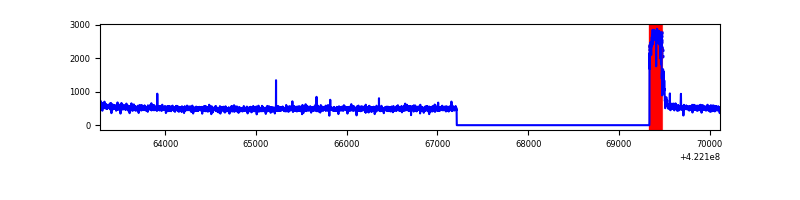 |
| D | 6829 | 4707 | 1042 | 1042 | 15.26% | 22.14% | 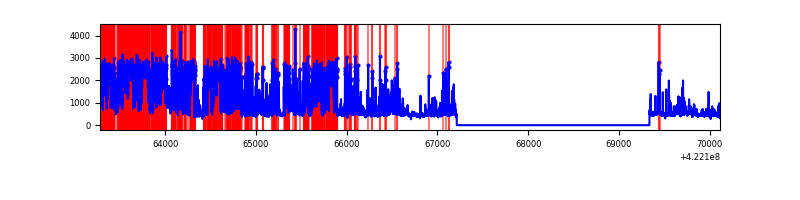 |
Top three noisy pixels from each quadrant. If the there are fewer than three noisy pixels in the level2.evt file, extra rows are filled as -1
| Pixel properties | Quadrant properties | ||||||
|---|---|---|---|---|---|---|---|
| Quadrant | DetID | PixID | Counts | Sigma | Mean | Median | Sigma |
| A | 10 | 83 | 416120 | 3779.07 | 541 | 531 | 110.0 |
| A | 12 | 189 | 53891 | 485.22 | 541 | 531 | 110.0 |
| A | 6 | 10 | 10238 | 88.27 | 541 | 531 | 110.0 |
| B | 0 | 186 | 90540 | 879.63 | 541 | 527 | 102.3 |
| B | 0 | 245 | 63895 | 619.25 | 541 | 527 | 102.3 |
| B | 0 | 229 | 30237 | 290.33 | 541 | 527 | 102.3 |
| C | 0 | 10 | 398191 | 3269.07 | 527 | 532 | 121.6 |
| C | 15 | 214 | 196830 | 1613.72 | 527 | 532 | 121.6 |
| C | 13 | 61 | 3558 | 24.88 | 527 | 532 | 121.6 |
| D | 1 | 47 | 2515182 | 21538.56 | 477 | 463 | 116.8 |
| D | 2 | 249 | 539147 | 4613.83 | 477 | 463 | 116.8 |
| D | 1 | 52 | 212136 | 1812.98 | 477 | 463 | 116.8 |
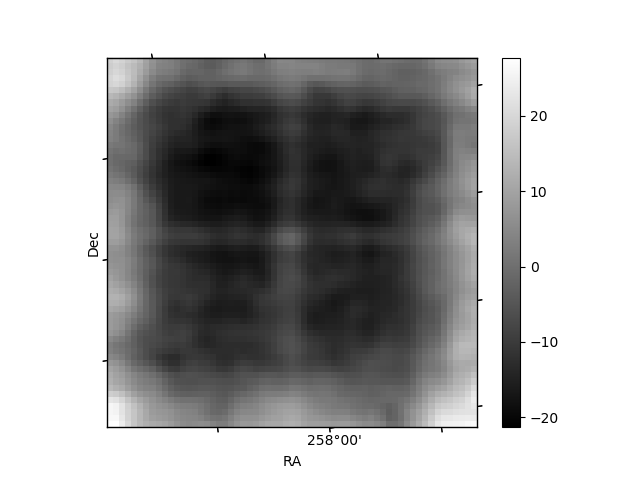
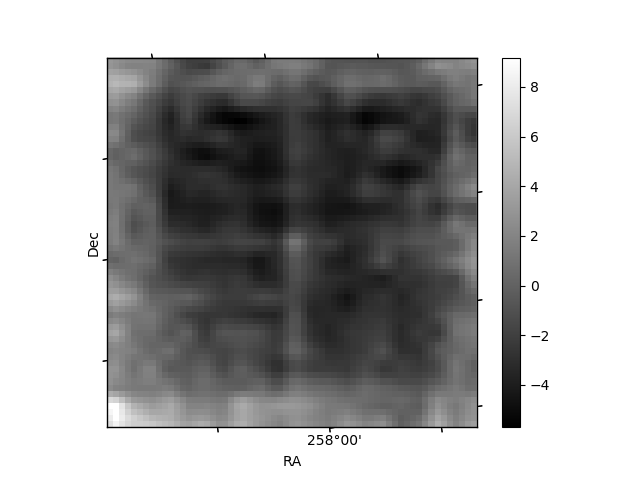
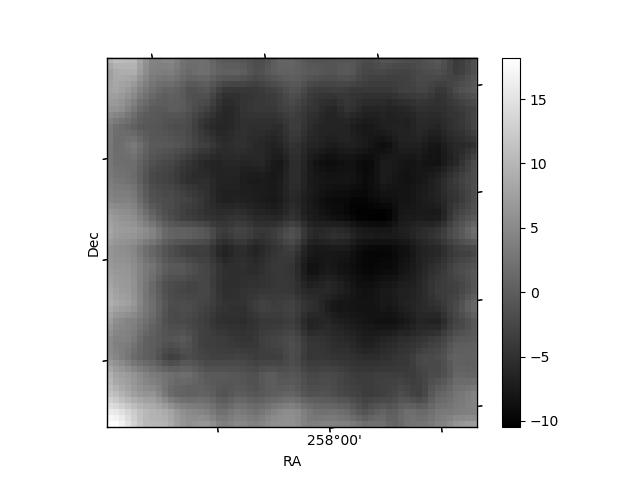
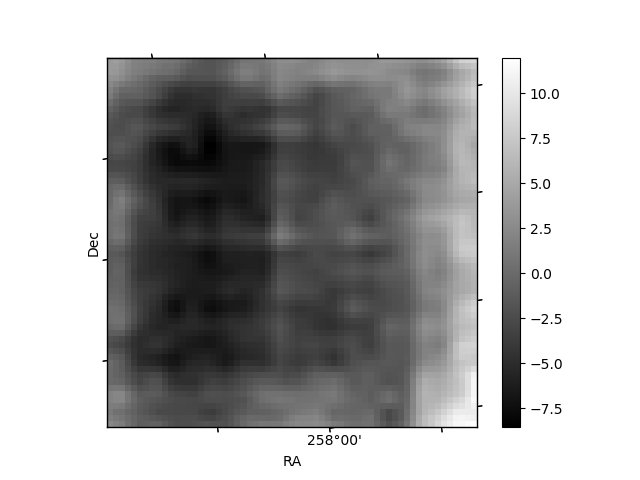
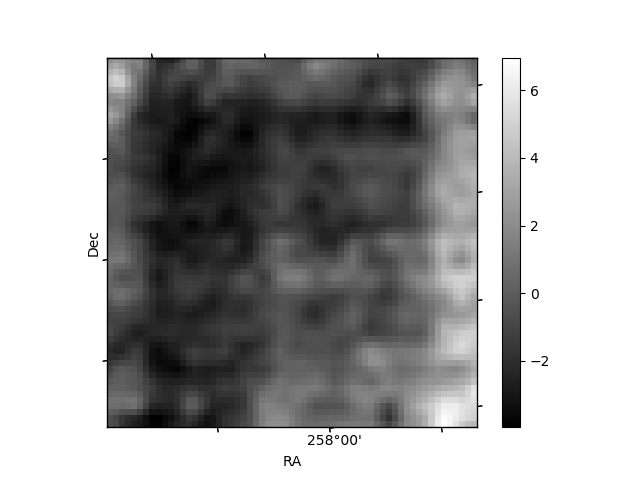
Histogram calculated using DETX and DETY for each event in the final _common_clean file
| Quadrant A | 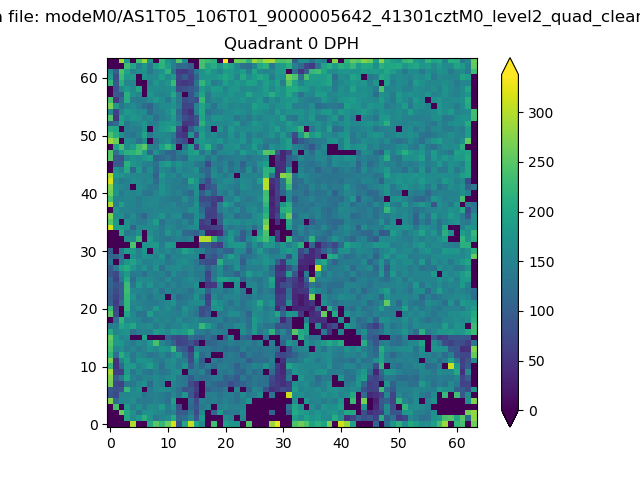 |
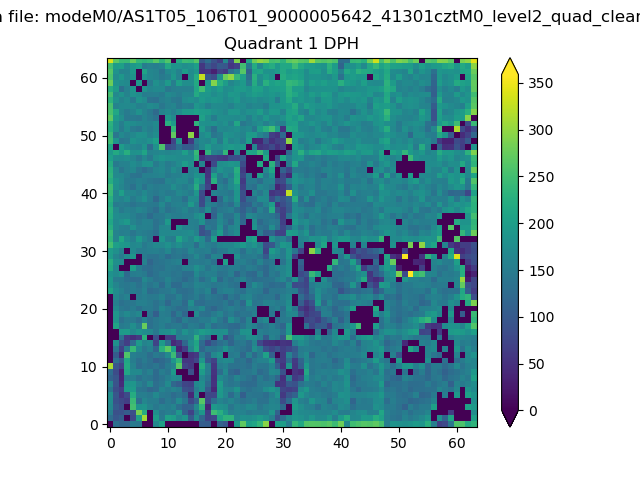 |
Quadrant B |
|---|---|---|---|
| Quadrant D | 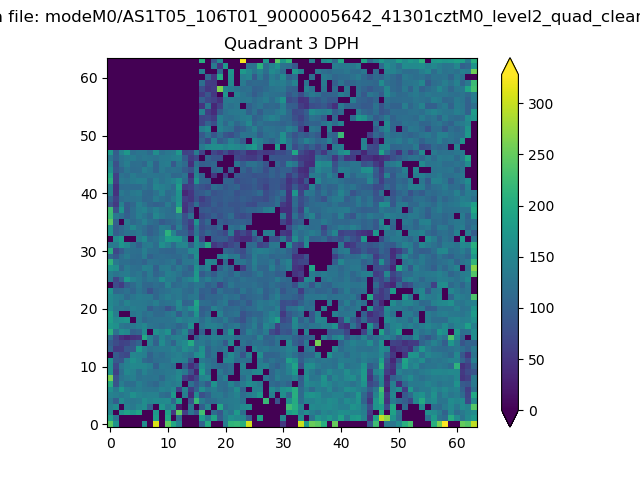 |
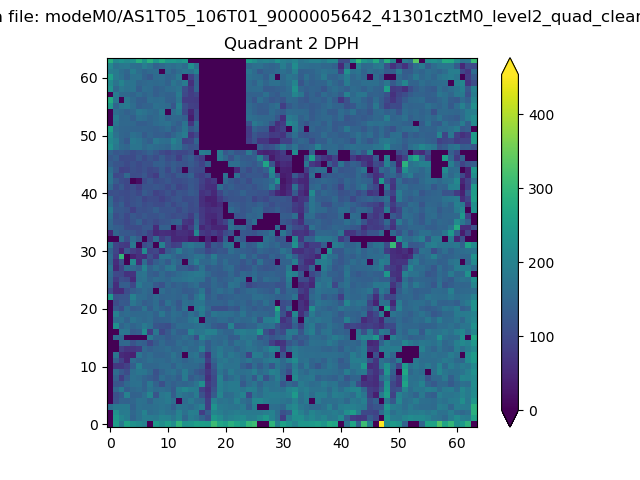 |
Quadrant C |
| Plot type | Count rate plots | Images |
|---|---|---|
| Comparison with Poisson distribution Blue bars denote a histogram of data divided into 1 sec bins. Red curve is a Poisson curve with rate = median count rate of data. |
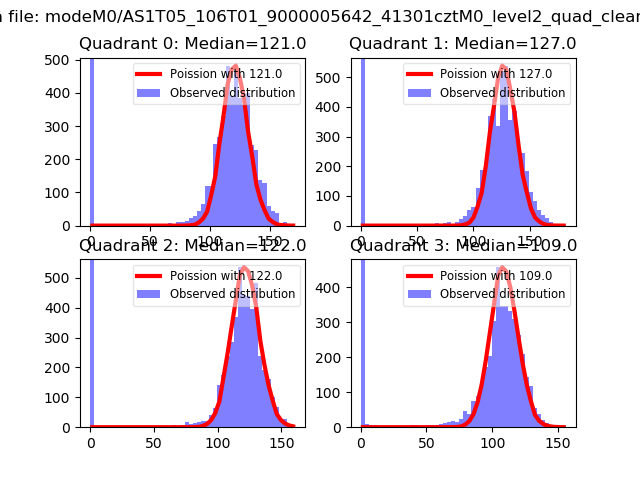 |
 |
| Quadrant-wise count rates Data is divided into 100 sec bins |
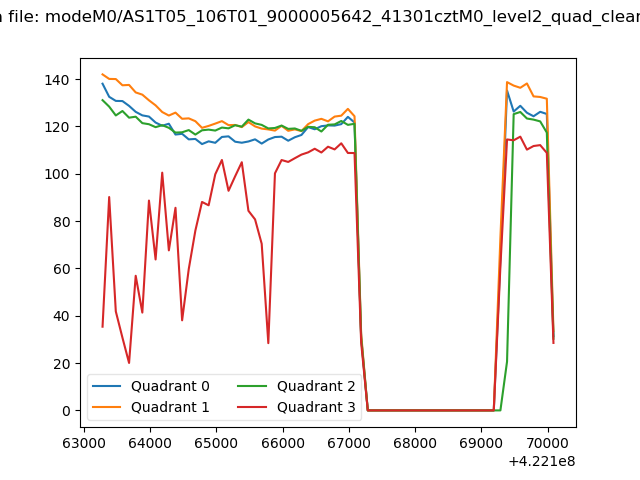 |
|
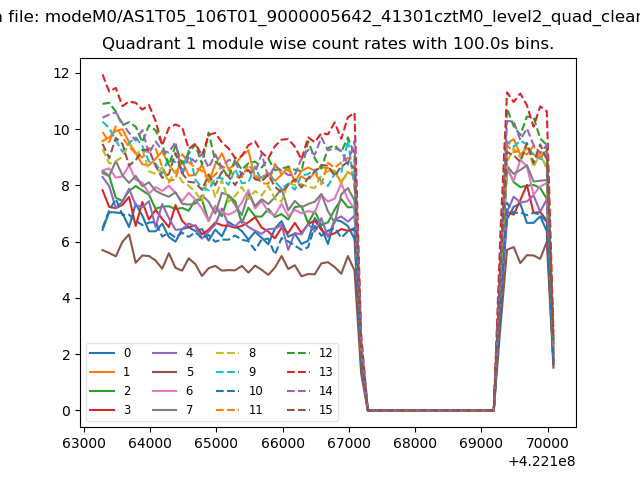
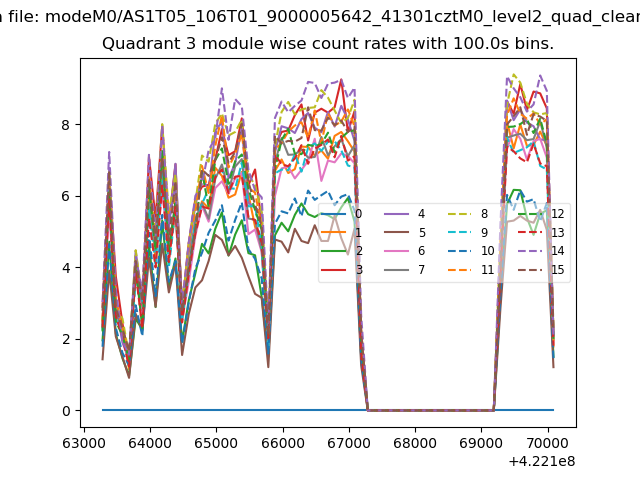
| Module-wise count rates for Quadrant A Data is divided into 100 sec bins |
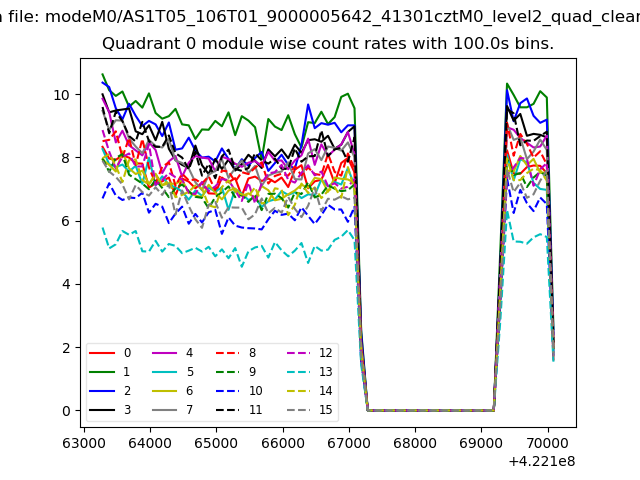 |
 |
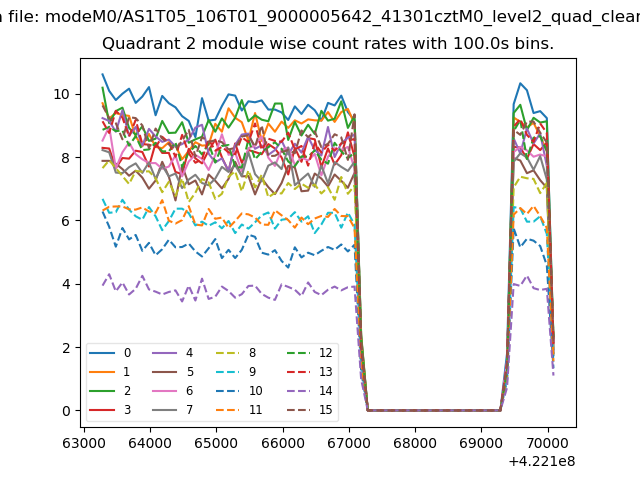
| Module-wise count rates for Quadrant B Data is divided into 100 sec bins |
 |
 |
| Module-wise count rates for Quadrant C Data is divided into 100 sec bins |
 |
 |
| Module-wise count rates for Quadrant D Data is divided into 100 sec bins |
 |
 |
| Parameter | Plot |
|---|---|
| CZT HV Monitor | 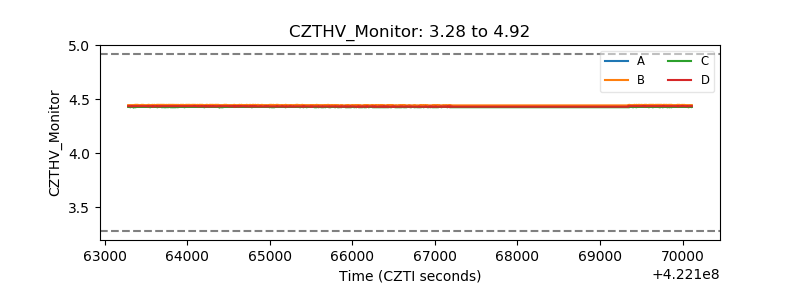 |
| D_VDD | 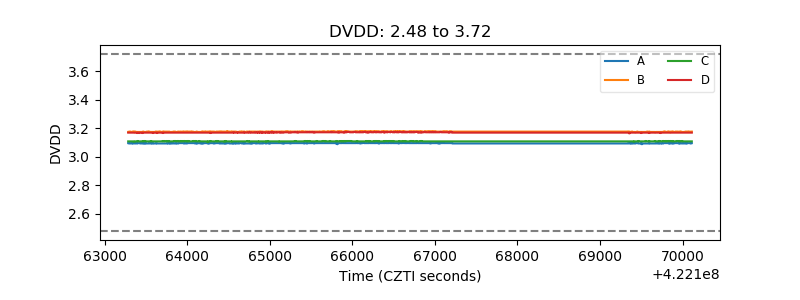 |
| Temperature 1 | 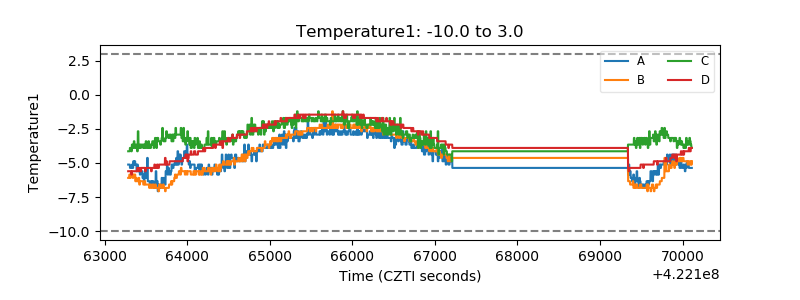 |
| Veto HV Monitor | 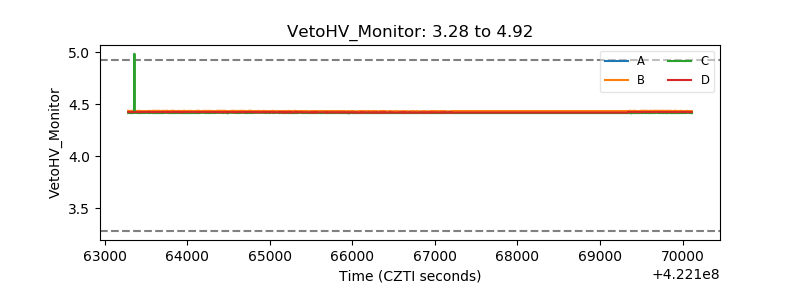 |
| Veto LLD | 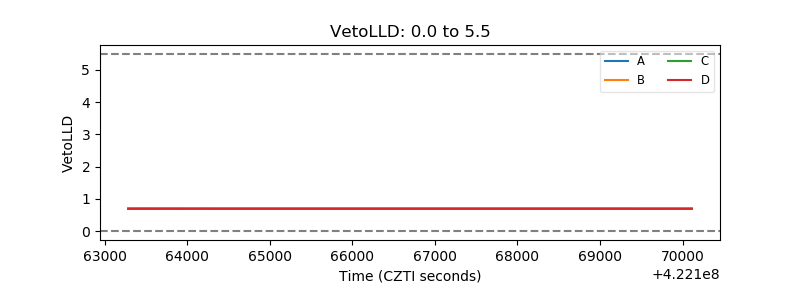 |
| Alpha Counter | 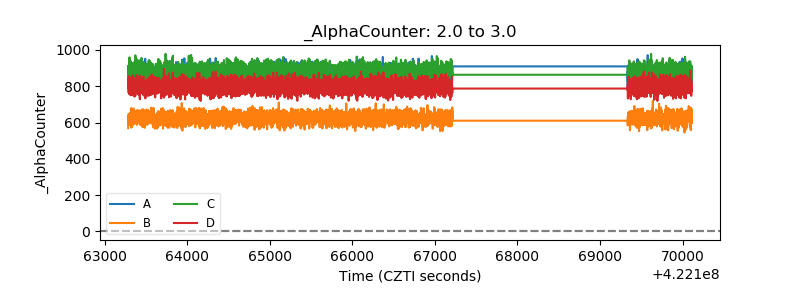 |
| _CPM_Rate | 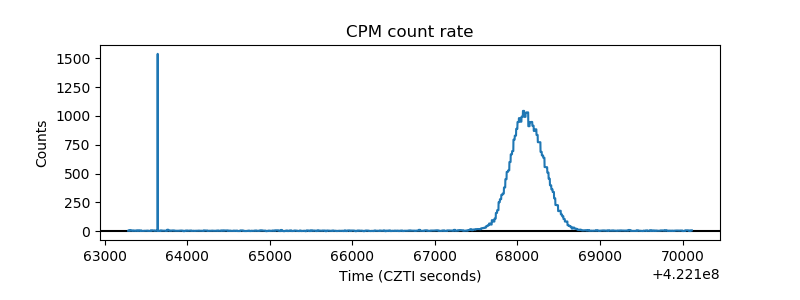 |
| CZT Counter | 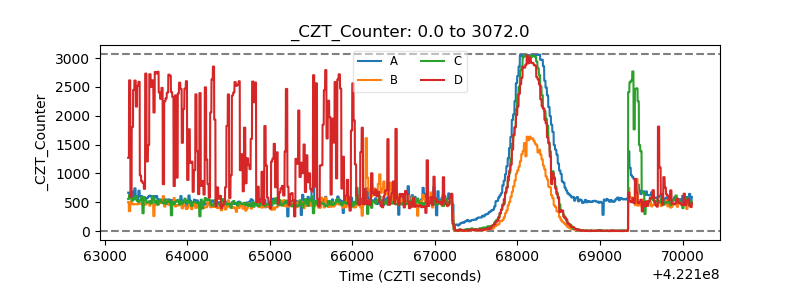 |
| +2.5 Volts monitor | 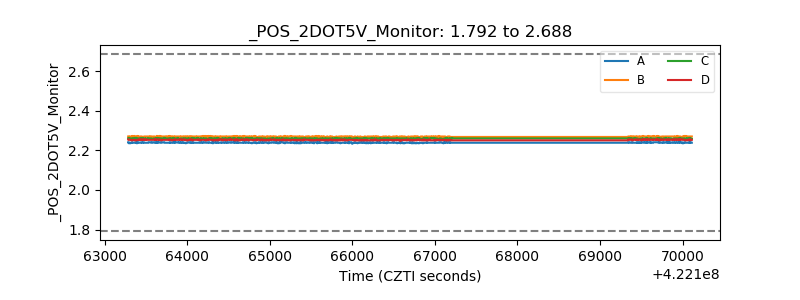 |
| +5 Volts monitor | 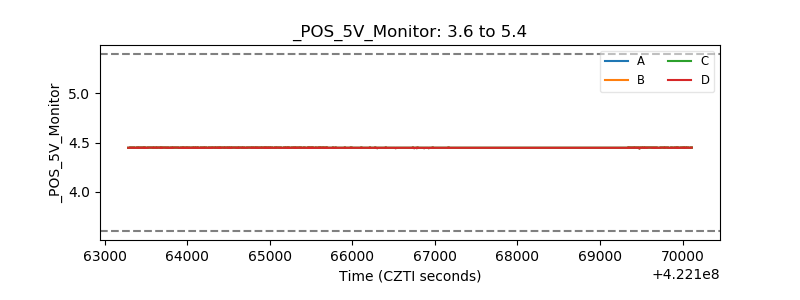 |
| _ROLL_ROT | 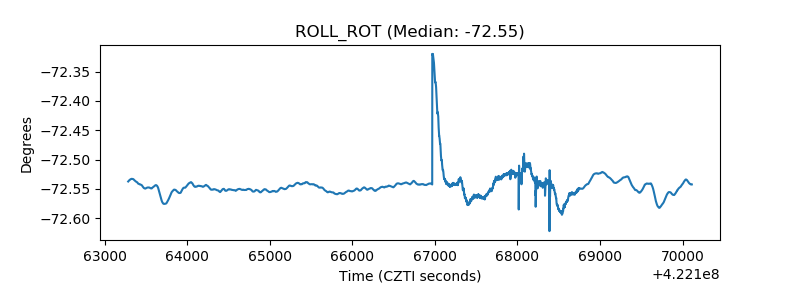 |
| _Roll_DEC | 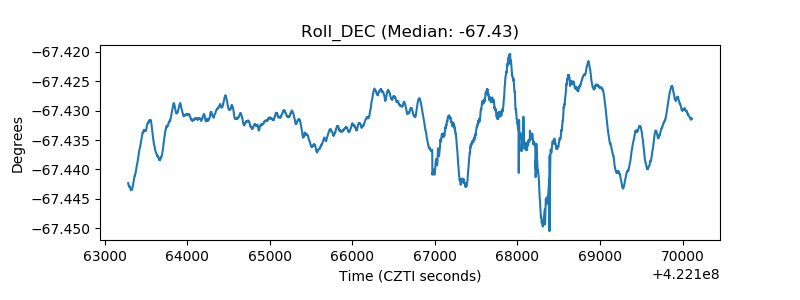 |
| _Roll_RA | 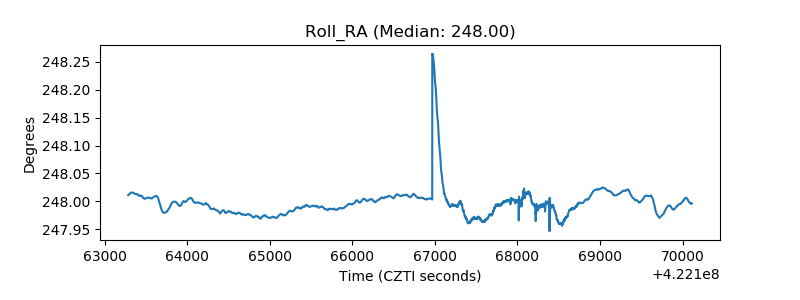 |
| Veto Counter | 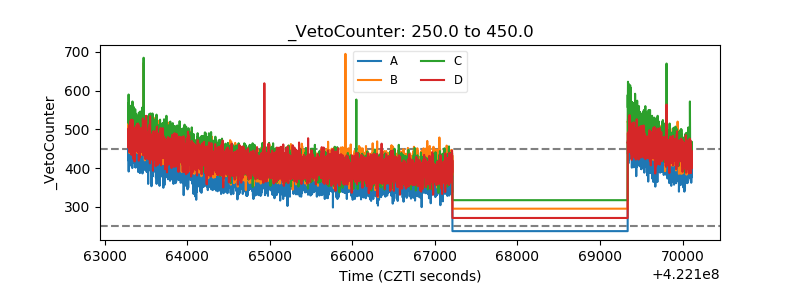 |