| Param | Original file | Final file |
|---|---|---|
| Filename | modeM0/AS1T05_106T01_9000005642_41302cztM0_level2.fits | modeM0/AS1T05_106T01_9000005642_41302cztM0_level2_quad_clean.evt |
| Size (bytes) | 381,432,960 | 81,587,520 |
| Size | 363.8 MB | 77.8 MB |
| Events in quadrant A | 3,468,916 | 547,599 |
| Events in quadrant B | 2,353,752 | 598,546 |
| Events in quadrant C | 2,986,297 | 539,411 |
| Events in quadrant D | 4,932,177 | 444,083 |
| Mode M0 | |||
|---|---|---|---|
| Quadrant | BADHDUFLAG | Total packets | Discarded packets |
| A | 0 | 13275 | 3 |
| B | 0 | 10197 | 2 |
| C | 0 | 11675 | 2 |
| D | 0 | 17970 | 2 |
| Mode SS | |||
|---|---|---|---|
| Quadrant | BADHDUFLAG | Total packets | Discarded packets |
| A | 0 | 100 | 0 |
| B | 0 | 100 | 0 |
| C | 0 | 100 | 0 |
| D | 0 | 100 | 0 |
| Mode M9 | |||
|---|---|---|---|
| Quadrant | BADHDUFLAG | Total packets | Discarded packets |
| A | 0 | 23 | 0 |
| B | 0 | 23 | 0 |
| C | 0 | 23 | 0 |
| D | 0 | 24 | 0 |
| Quadrant | Total seconds | Saturated seconds | Saturation percentage |
|---|---|---|---|
| A | 4855 | 276 | 5.684861% |
| B | 4855 | 10 | 0.205973% |
| C | 4855 | 276 | 5.684861% |
| D | 4855 | 826 | 17.013388% |
Noise dominated data is calculated using 1-second bins in cleaned event files. If a bin has >2000 counts, and if more than 50% of those come from <1% of pixels, then it is considered to be noise-dominated and hence unusable.
| Quadrant | # 1 sec bins | Bins with >0 counts | Bins with >2000 counts | High rate bins dominated by noise | Noise dominated (total time) | Noise dominated (detector-on time) | Marked lightcurve |
|---|---|---|---|---|---|---|---|
| A | 7007 | 4856 | 249 | 249 | 3.55% | 5.13% | 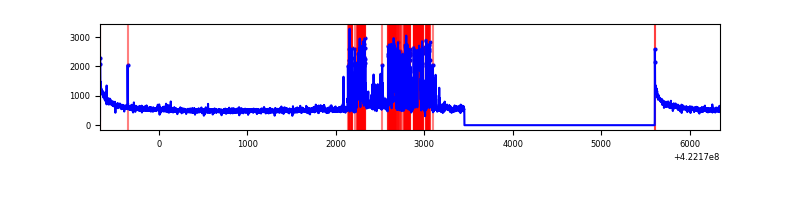 |
| B | 7007 | 4856 | 2 | 2 | 0.03% | 0.04% | 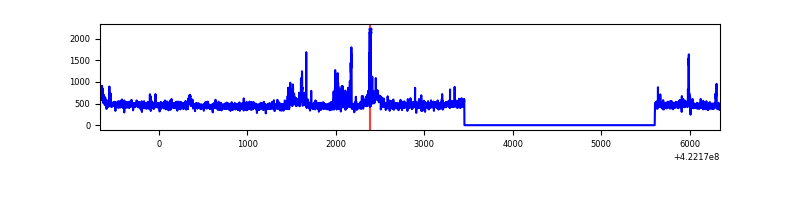 |
| C | 7007 | 4856 | 258 | 258 | 3.68% | 5.31% | 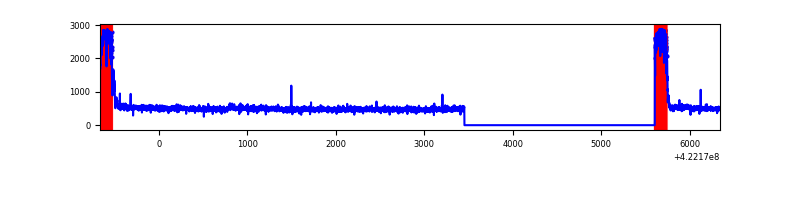 |
| D | 7007 | 4855 | 848 | 848 | 12.10% | 17.47% | 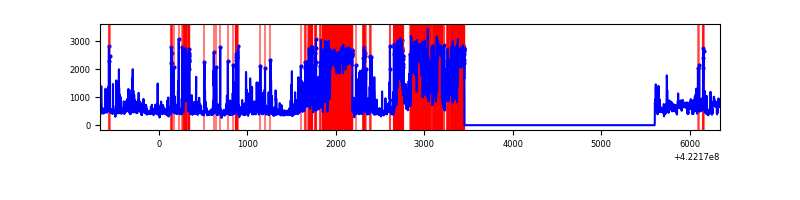 |
Top three noisy pixels from each quadrant. If the there are fewer than three noisy pixels in the level2.evt file, extra rows are filled as -1
| Pixel properties | Quadrant properties | ||||||
|---|---|---|---|---|---|---|---|
| Quadrant | DetID | PixID | Counts | Sigma | Mean | Median | Sigma |
| A | 13 | 248 | 816072 | 7428.3 | 538 | 526 | 109.8 |
| A | 10 | 83 | 486219 | 4423.88 | 538 | 526 | 109.8 |
| A | 12 | 189 | 75724 | 684.93 | 538 | 526 | 109.8 |
| B | 0 | 186 | 80179 | 757.06 | 550 | 535 | 105.2 |
| B | 7 | 202 | 51804 | 487.34 | 550 | 535 | 105.2 |
| B | 0 | 245 | 44184 | 414.91 | 550 | 535 | 105.2 |
| C | 0 | 10 | 733083 | 6072.41 | 520 | 524 | 120.6 |
| C | 15 | 214 | 202145 | 1671.3 | 520 | 524 | 120.6 |
| C | 10 | 70 | 15879 | 127.28 | 520 | 524 | 120.6 |
| D | 1 | 47 | 1132012 | 9300.38 | 503 | 489 | 121.7 |
| D | 2 | 249 | 791907 | 6504.94 | 503 | 489 | 121.7 |
| D | 2 | 120 | 587001 | 4820.74 | 503 | 489 | 121.7 |
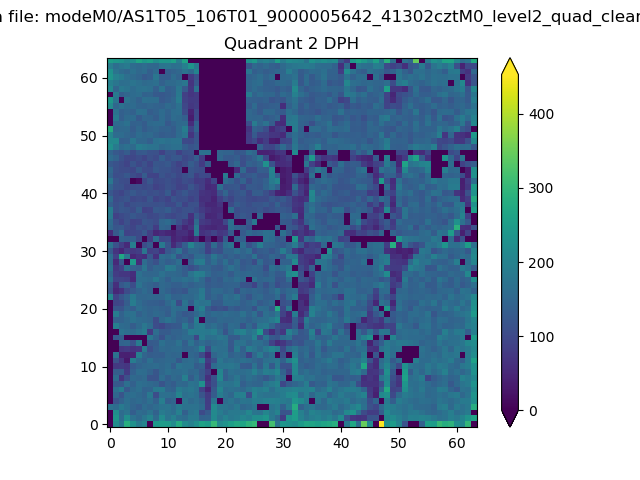
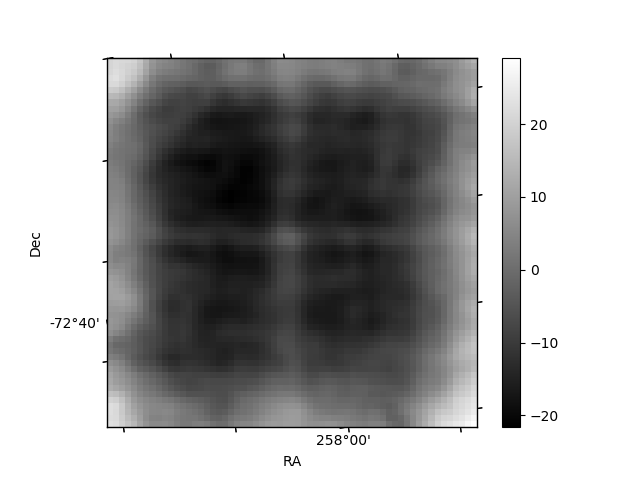
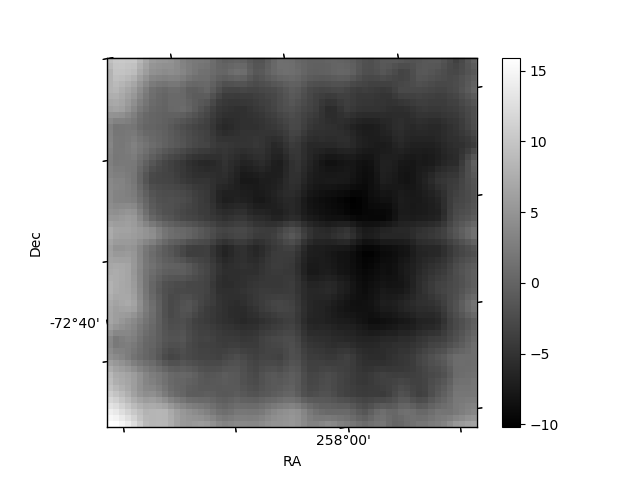
Histogram calculated using DETX and DETY for each event in the final _common_clean file
| Quadrant A | 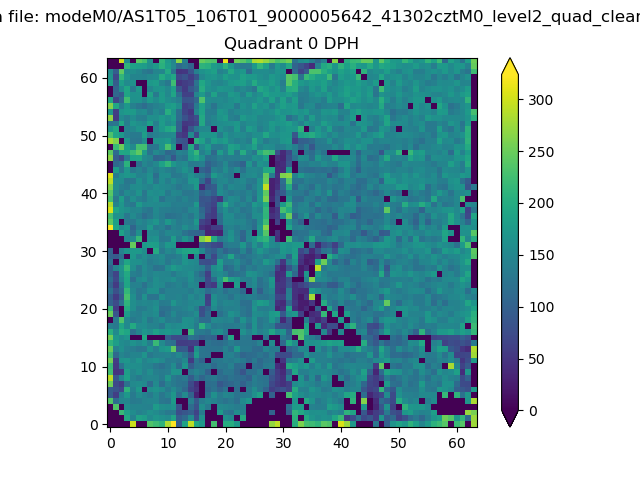 |
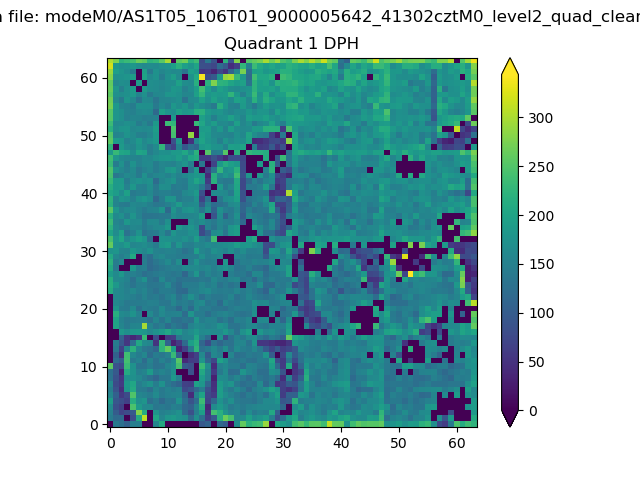 |
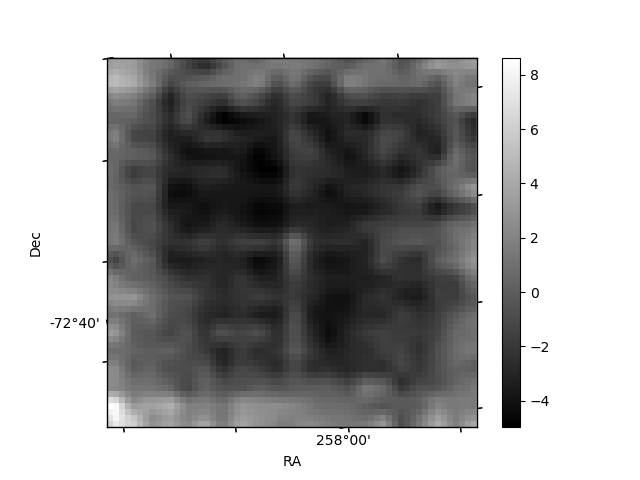
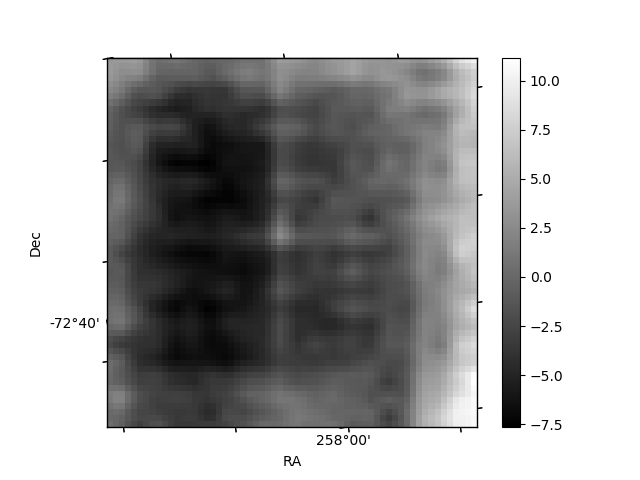
Quadrant B |
|---|---|---|---|
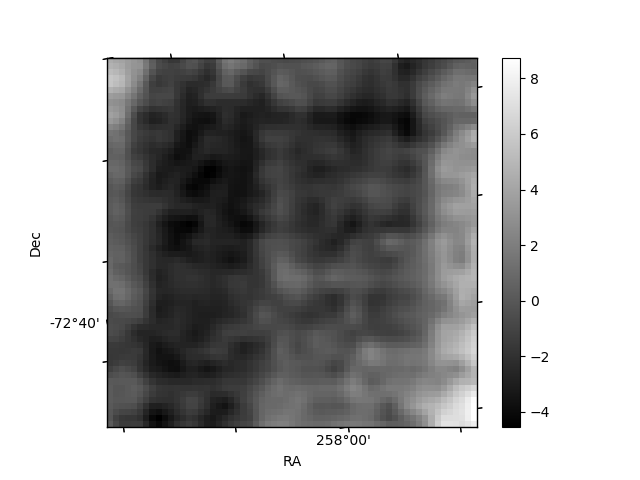
| Quadrant D | 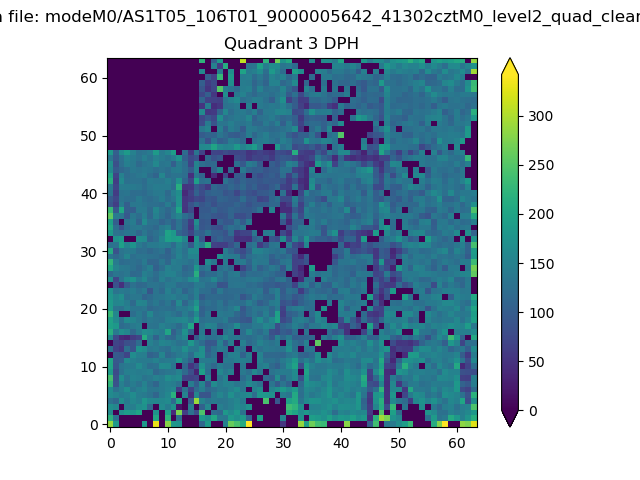 |
 |
Quadrant C |
| Plot type | Count rate plots | Images |
|---|---|---|
| Comparison with Poisson distribution Blue bars denote a histogram of data divided into 1 sec bins. Red curve is a Poisson curve with rate = median count rate of data. |
 |
 |
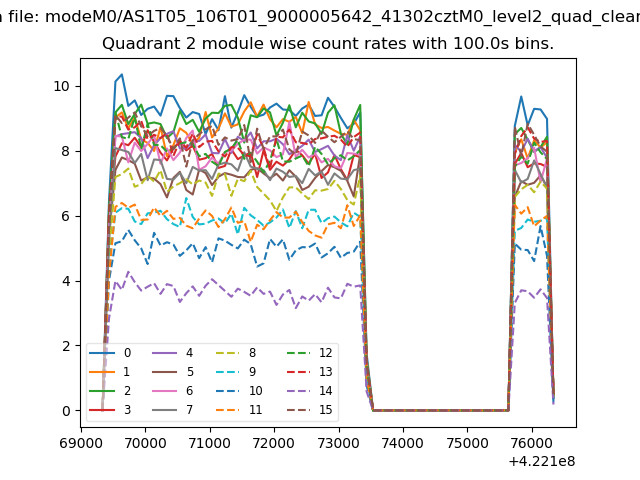
| Quadrant-wise count rates Data is divided into 100 sec bins |
 |
|
| Module-wise count rates for Quadrant A Data is divided into 100 sec bins |
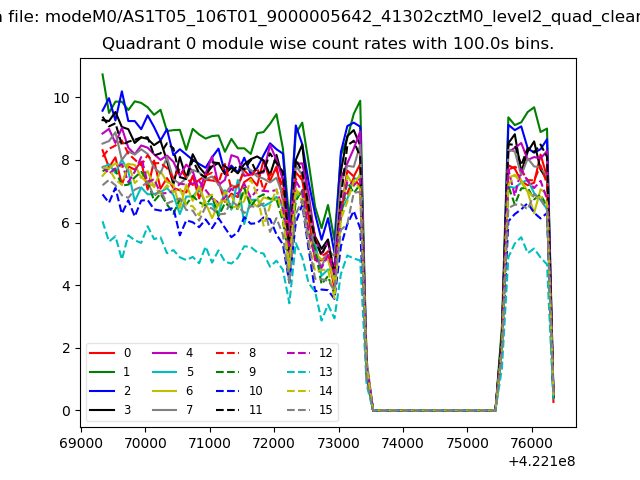 |
 |
| Module-wise count rates for Quadrant B Data is divided into 100 sec bins |
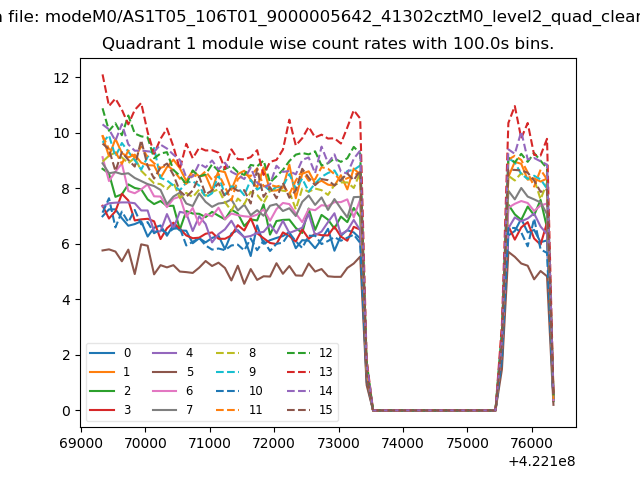 |
 |
| Module-wise count rates for Quadrant C Data is divided into 100 sec bins |
 |
 |
| Module-wise count rates for Quadrant D Data is divided into 100 sec bins |
 |
 |
| Parameter | Plot |
|---|---|
| CZT HV Monitor | 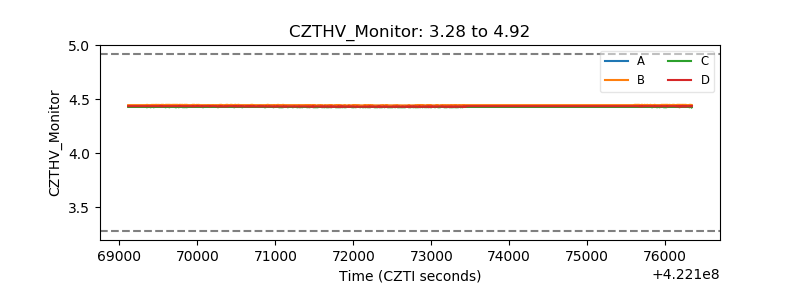 |
| D_VDD | 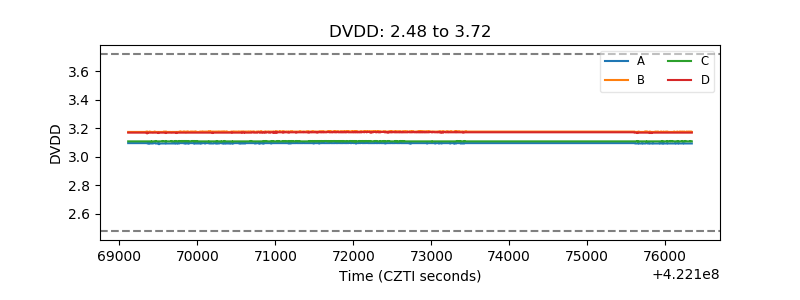 |
| Temperature 1 | 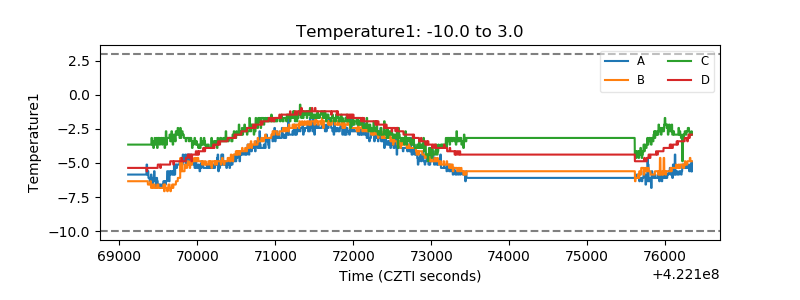 |
| Veto HV Monitor | 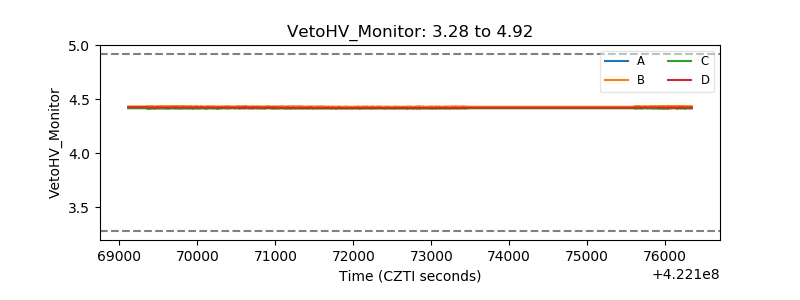 |
| Veto LLD | 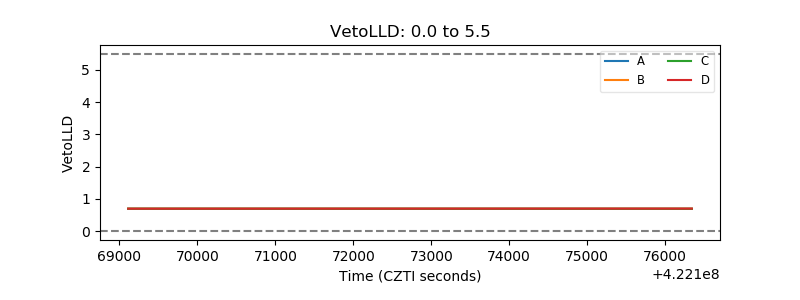 |
| Alpha Counter |  |
| _CPM_Rate |  |
| CZT Counter | 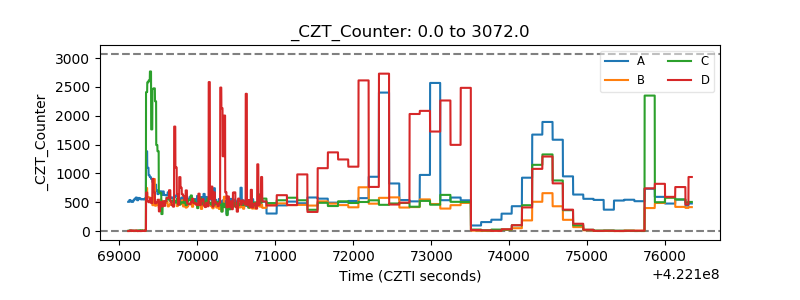 |
| +2.5 Volts monitor | 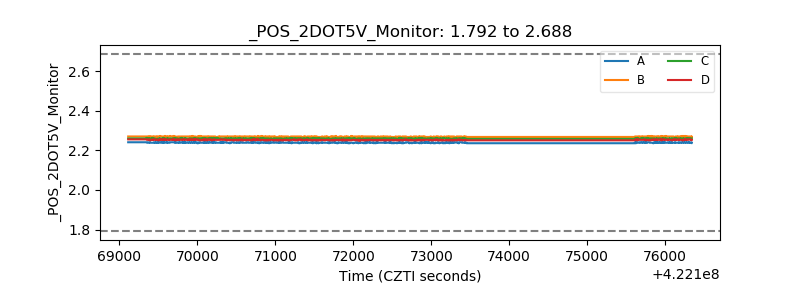 |
| +5 Volts monitor |  |
| _ROLL_ROT | 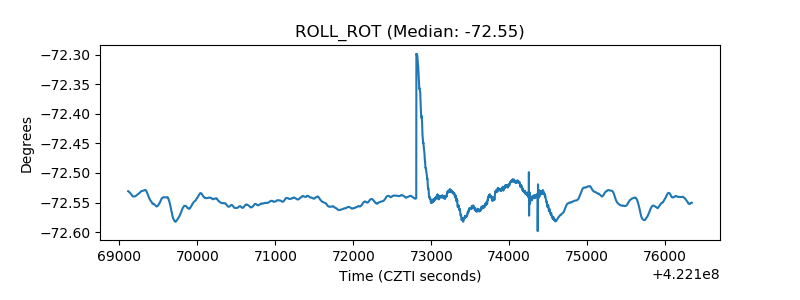 |
| _Roll_DEC | 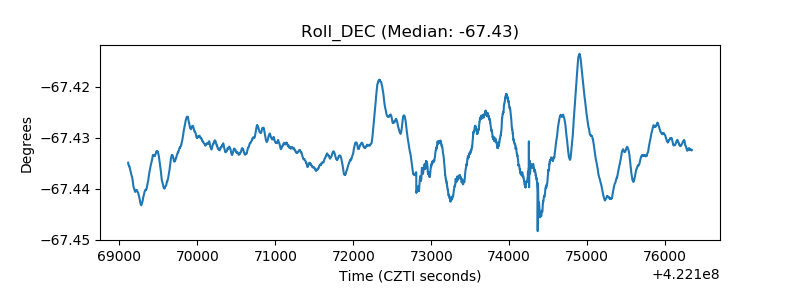 |
| _Roll_RA | 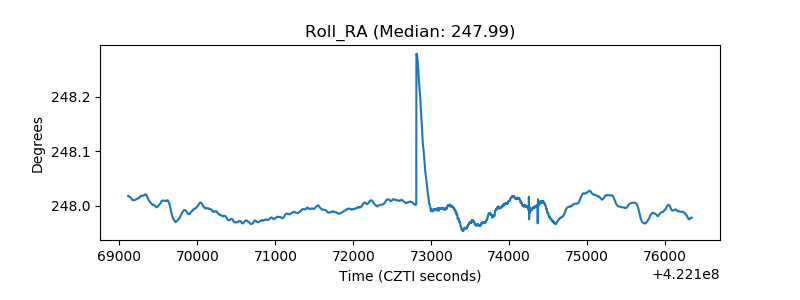 |
| Veto Counter | 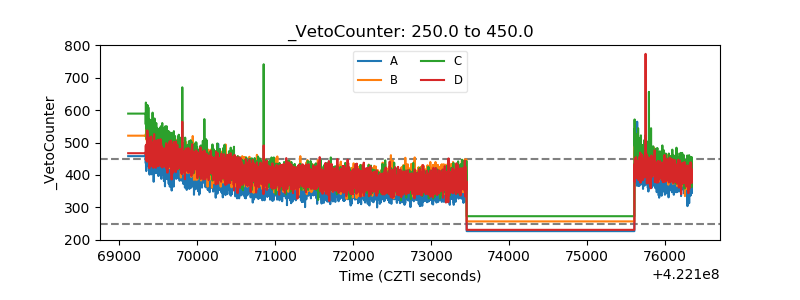 |