| Param | Original file | Final file |
|---|---|---|
| Filename | modeM0/AS1T05_106T01_9000005642_41303cztM0_level2.fits | modeM0/AS1T05_106T01_9000005642_41303cztM0_level2_quad_clean.evt |
| Size (bytes) | 313,119,360 | 83,223,360 |
| Size | 298.6 MB | 79.4 MB |
| Events in quadrant A | 2,798,570 | 557,802 |
| Events in quadrant B | 2,400,590 | 580,952 |
| Events in quadrant C | 2,954,915 | 533,020 |
| Events in quadrant D | 3,049,867 | 500,355 |
| Mode M0 | |||
|---|---|---|---|
| Quadrant | BADHDUFLAG | Total packets | Discarded packets |
| A | 0 | 11274 | 3 |
| B | 0 | 10532 | 2 |
| C | 0 | 11819 | 2 |
| D | 0 | 12611 | 2 |
| Mode SS | |||
|---|---|---|---|
| Quadrant | BADHDUFLAG | Total packets | Discarded packets |
| A | 0 | 102 | 0 |
| B | 0 | 102 | 0 |
| C | 0 | 102 | 0 |
| D | 0 | 102 | 0 |
| Mode M9 | |||
|---|---|---|---|
| Quadrant | BADHDUFLAG | Total packets | Discarded packets |
| A | 0 | 26 | 0 |
| B | 0 | 26 | 0 |
| C | 0 | 26 | 0 |
| D | 0 | 27 | 0 |
| Quadrant | Total seconds | Saturated seconds | Saturation percentage |
|---|---|---|---|
| A | 4959 | 40 | 0.806614% |
| B | 4959 | 8 | 0.161323% |
| C | 4959 | 266 | 5.363985% |
| D | 4959 | 130 | 2.621496% |
Noise dominated data is calculated using 1-second bins in cleaned event files. If a bin has >2000 counts, and if more than 50% of those come from <1% of pixels, then it is considered to be noise-dominated and hence unusable.
| Quadrant | # 1 sec bins | Bins with >0 counts | Bins with >2000 counts | High rate bins dominated by noise | Noise dominated (total time) | Noise dominated (detector-on time) | Marked lightcurve |
|---|---|---|---|---|---|---|---|
| A | 6993 | 4960 | 31 | 31 | 0.44% | 0.62% | 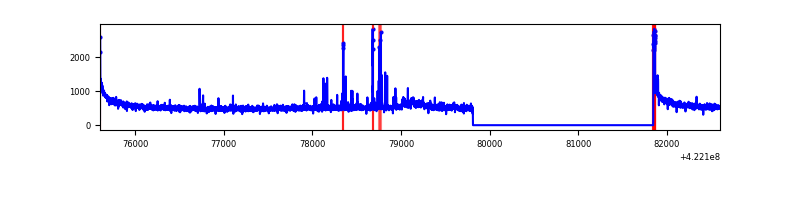 |
| B | 6993 | 4960 | 1 | 1 | 0.01% | 0.02% | 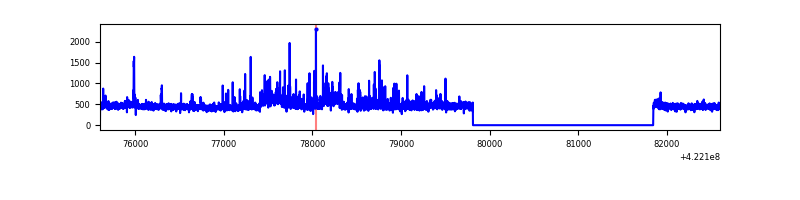 |
| C | 6993 | 4960 | 257 | 257 | 3.68% | 5.18% | 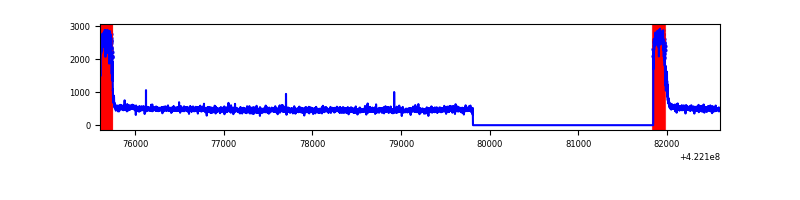 |
| D | 6993 | 4960 | 119 | 119 | 1.70% | 2.40% | 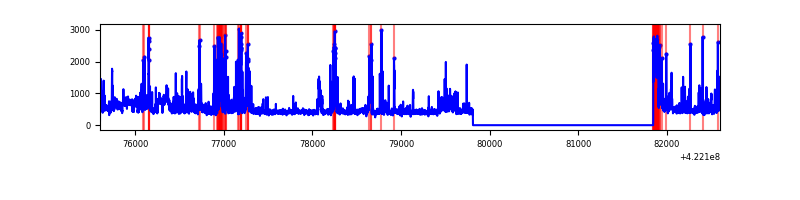 |
Top three noisy pixels from each quadrant. If the there are fewer than three noisy pixels in the level2.evt file, extra rows are filled as -1
| Pixel properties | Quadrant properties | ||||||
|---|---|---|---|---|---|---|---|
| Quadrant | DetID | PixID | Counts | Sigma | Mean | Median | Sigma |
| A | 10 | 83 | 483133 | 4318.45 | 545 | 534 | 111.8 |
| A | 12 | 189 | 85366 | 759.1 | 545 | 534 | 111.8 |
| A | 13 | 248 | 68721 | 610.16 | 545 | 534 | 111.8 |
| B | 0 | 186 | 92606 | 883.11 | 544 | 529 | 104.3 |
| B | 0 | 245 | 88188 | 840.73 | 544 | 529 | 104.3 |
| B | 7 | 202 | 61000 | 579.97 | 544 | 529 | 104.3 |
| C | 0 | 10 | 728209 | 6136.25 | 514 | 518 | 118.6 |
| C | 15 | 214 | 207485 | 1745.25 | 514 | 518 | 118.6 |
| C | 3 | 233 | 5161 | 39.15 | 514 | 518 | 118.6 |
| D | 2 | 249 | 360386 | 2779.67 | 530 | 515 | 129.5 |
| D | 1 | 52 | 319119 | 2460.92 | 530 | 515 | 129.5 |
| D | 5 | 222 | 206018 | 1587.32 | 530 | 515 | 129.5 |
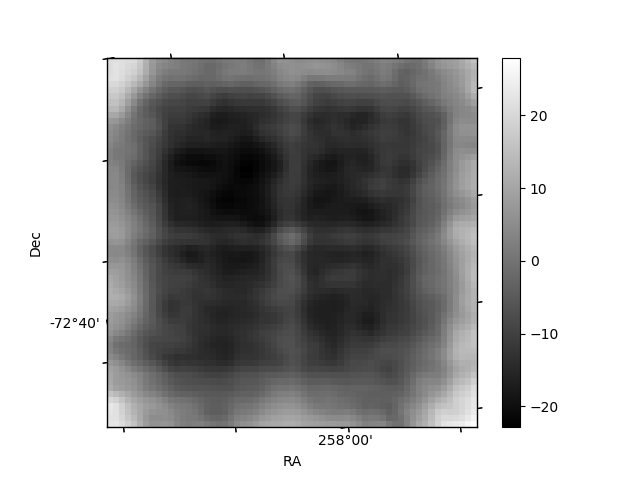
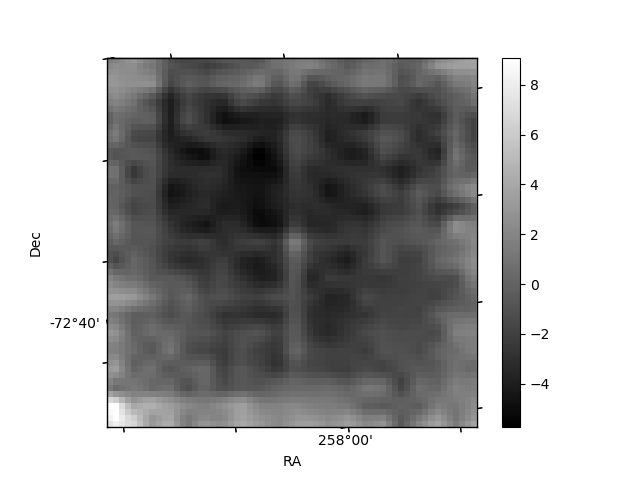
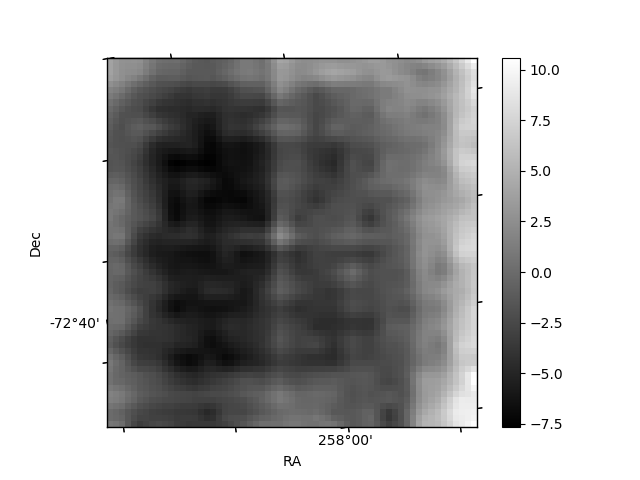
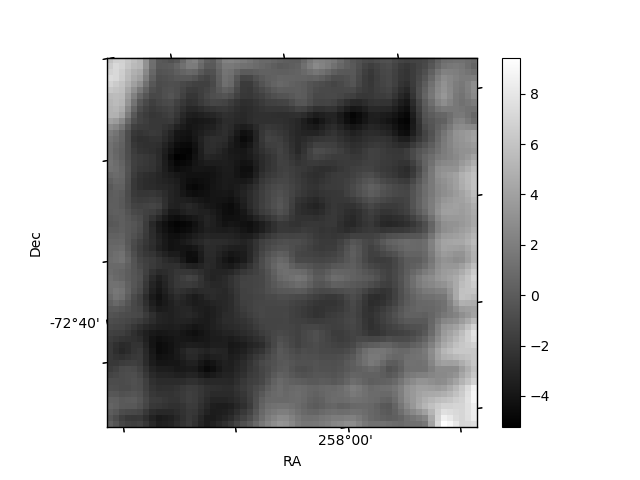
Histogram calculated using DETX and DETY for each event in the final _common_clean file
| Quadrant A | 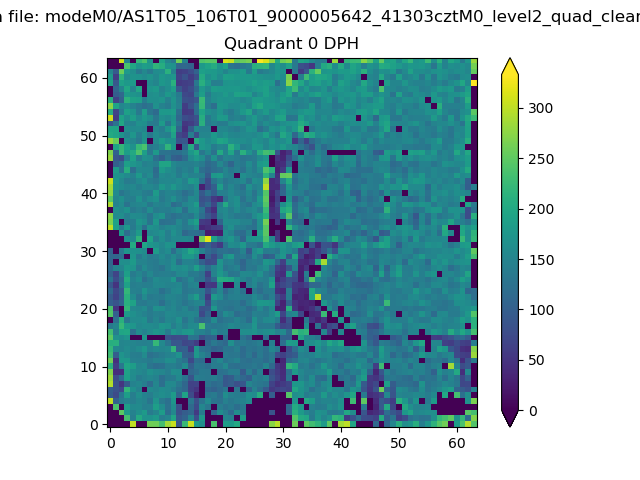 |
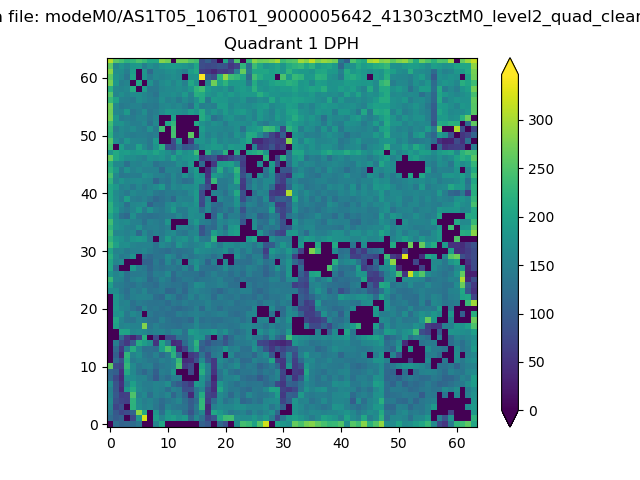 |
Quadrant B |
|---|---|---|---|
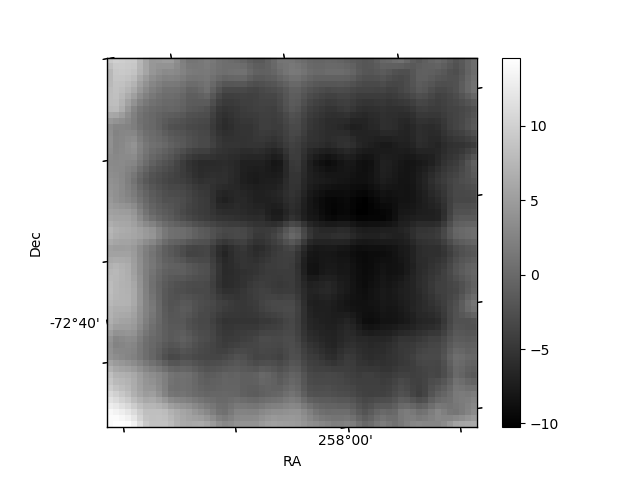
| Quadrant D | 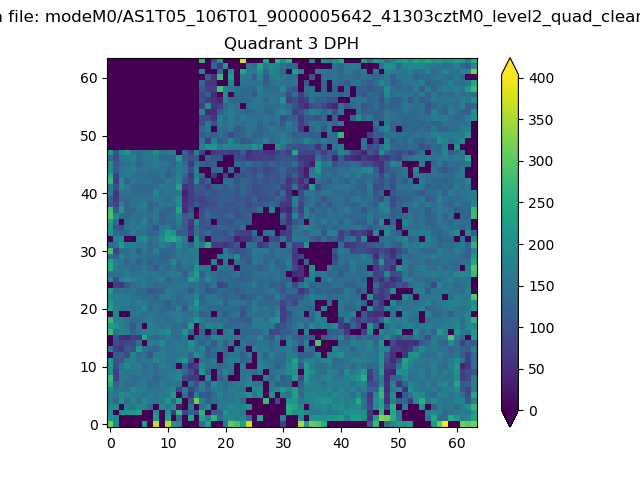 |
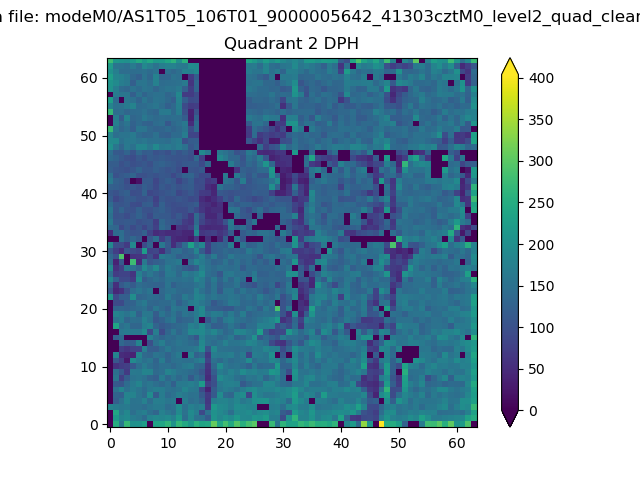 |
Quadrant C |
| Plot type | Count rate plots | Images |
|---|---|---|
| Comparison with Poisson distribution Blue bars denote a histogram of data divided into 1 sec bins. Red curve is a Poisson curve with rate = median count rate of data. |
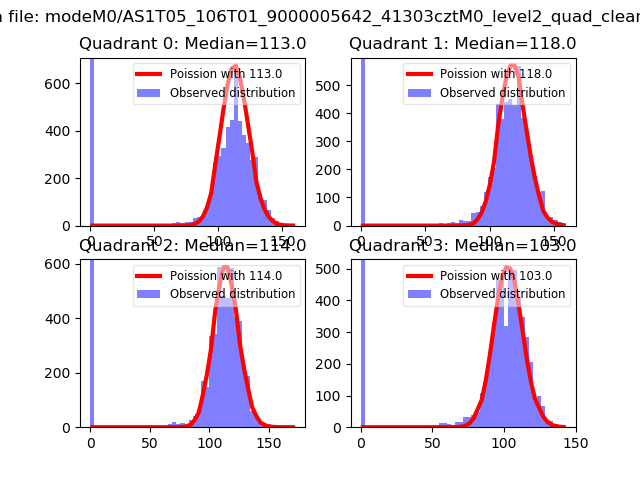 |
 |
| Quadrant-wise count rates Data is divided into 100 sec bins |
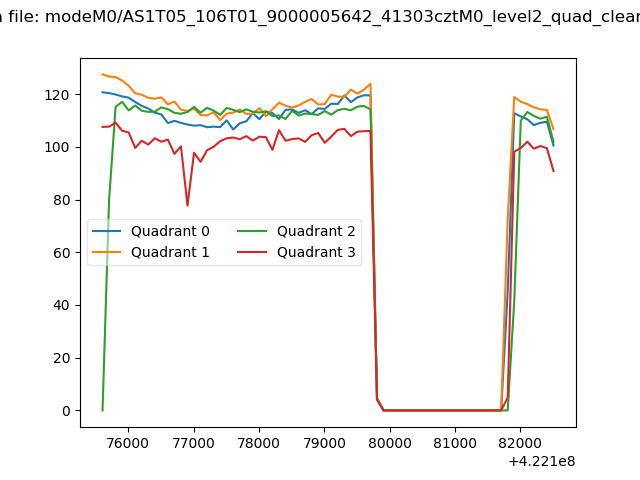 |
|
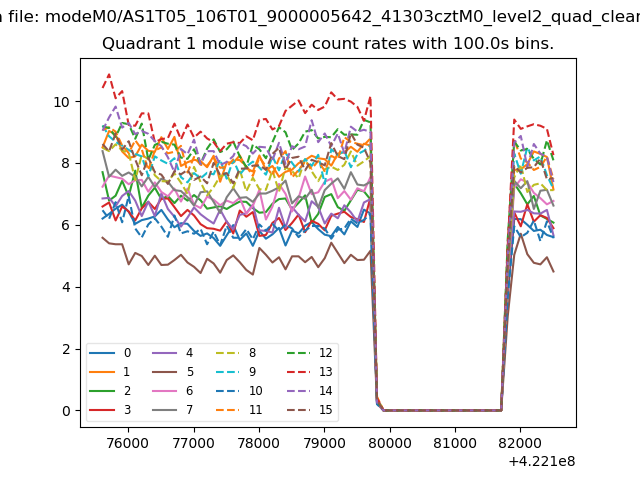
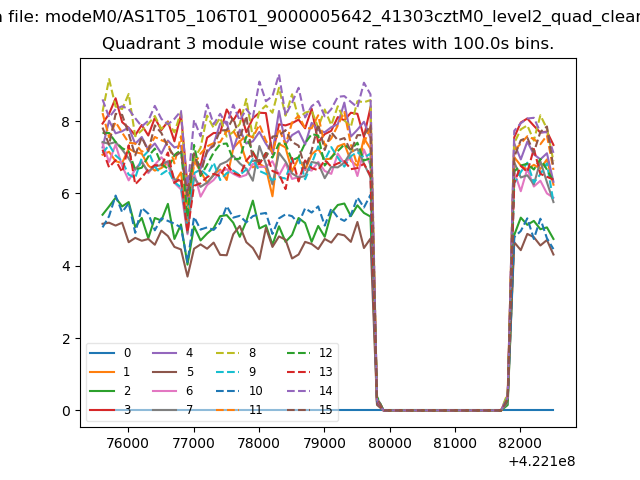
| Module-wise count rates for Quadrant A Data is divided into 100 sec bins |
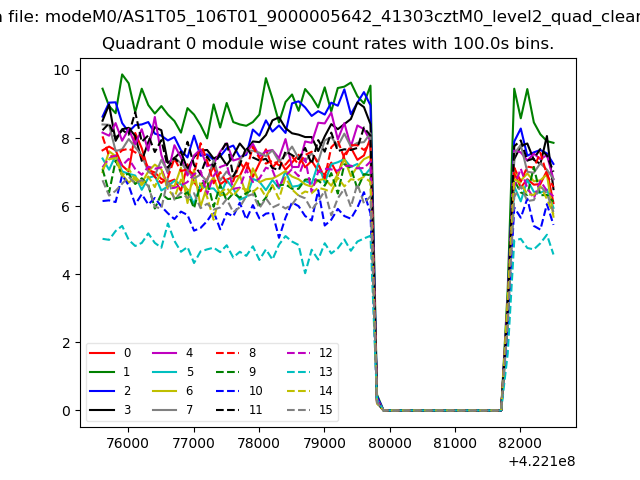 |
 |
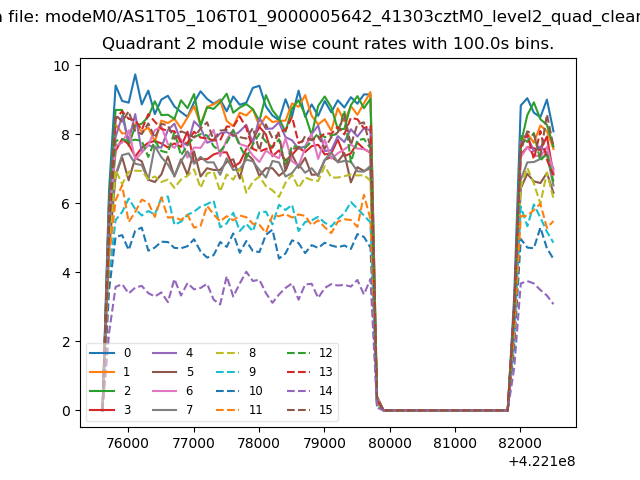
| Module-wise count rates for Quadrant B Data is divided into 100 sec bins |
 |
 |
| Module-wise count rates for Quadrant C Data is divided into 100 sec bins |
 |
 |
| Module-wise count rates for Quadrant D Data is divided into 100 sec bins |
 |
 |
| Parameter | Plot |
|---|---|
| CZT HV Monitor |  |
| D_VDD | 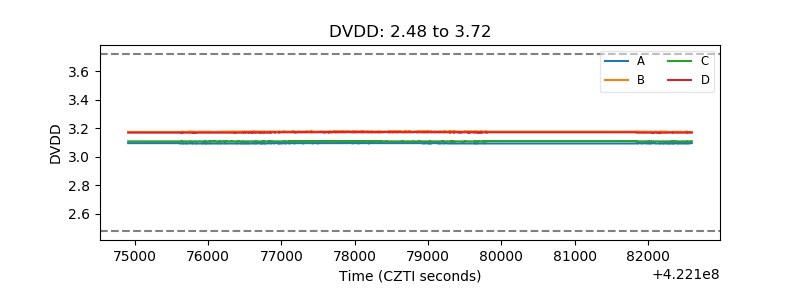 |
| Temperature 1 | 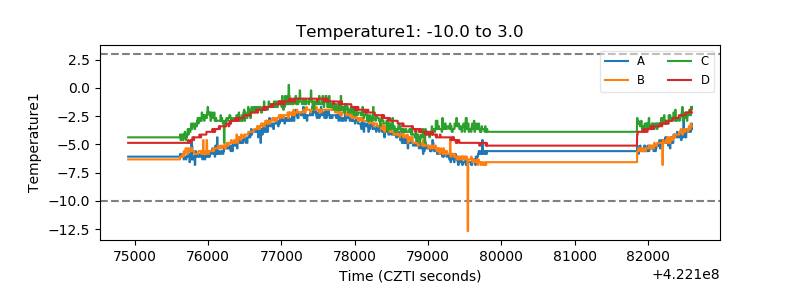 |
| Veto HV Monitor | 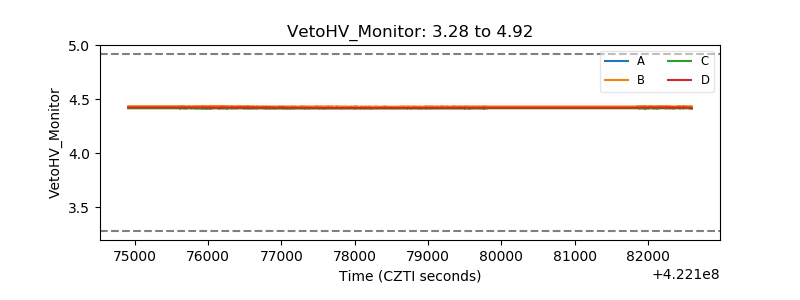 |
| Veto LLD | 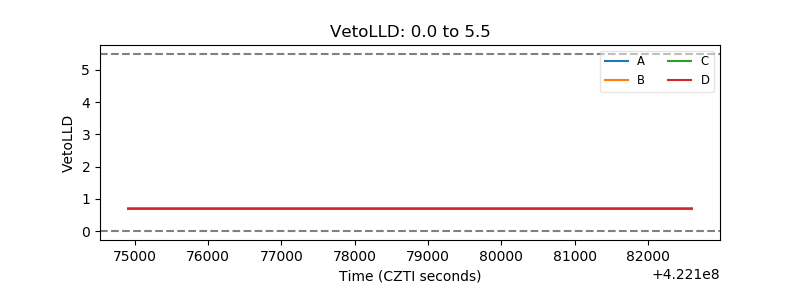 |
| Alpha Counter | 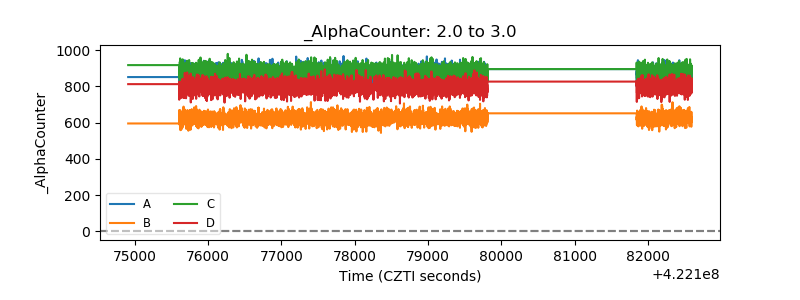 |
| _CPM_Rate | 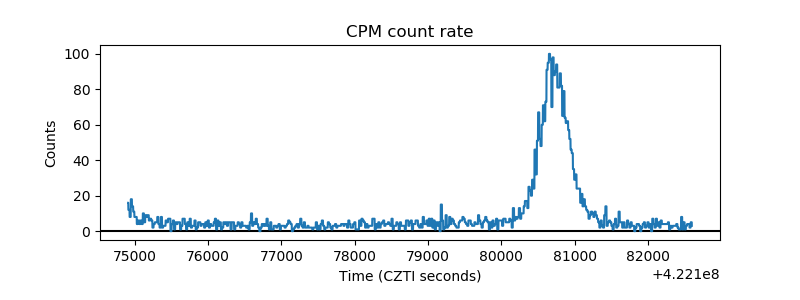 |
| CZT Counter | 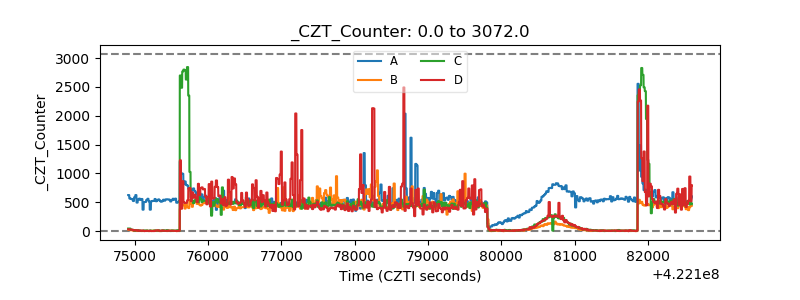 |
| +2.5 Volts monitor | 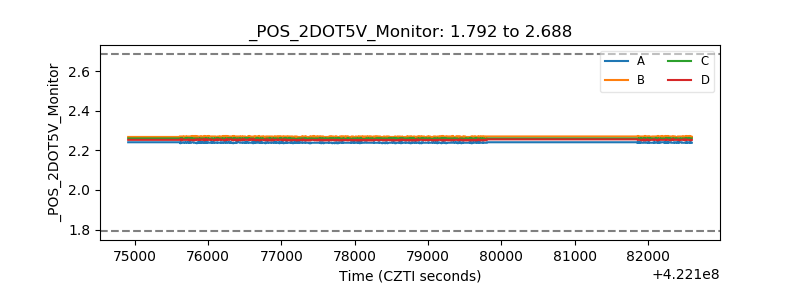 |
| +5 Volts monitor | 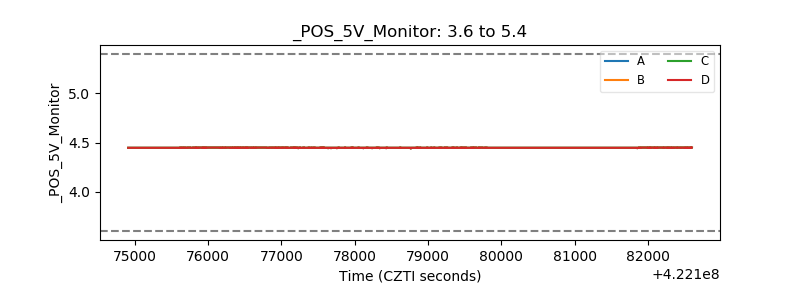 |
| _ROLL_ROT | 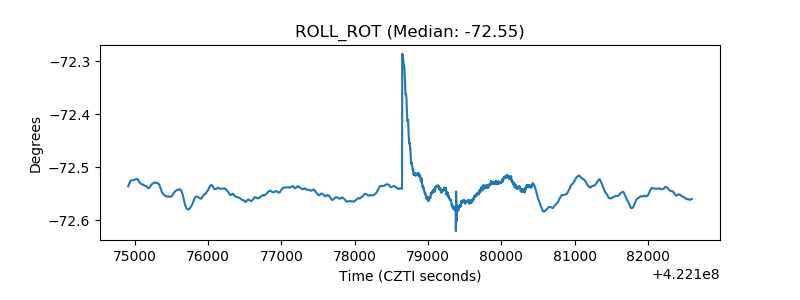 |
| _Roll_DEC | 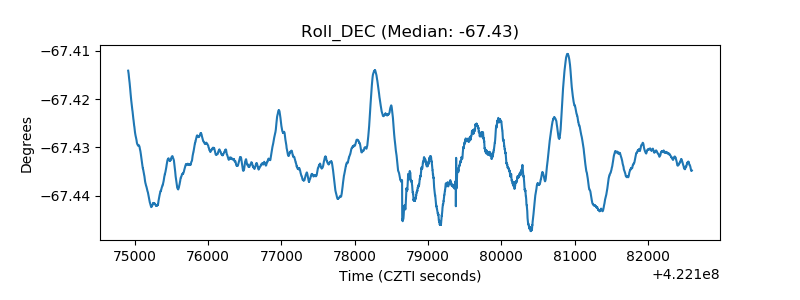 |
| _Roll_RA | 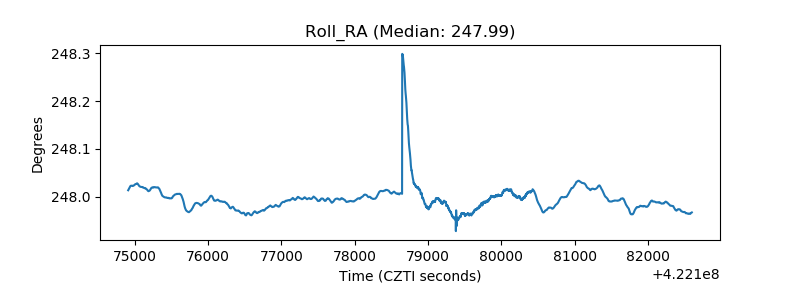 |
| Veto Counter |  |