| Param | Original file | Final file |
|---|---|---|
| Filename | modeM0/AS1T05_106T01_9000005642_41304cztM0_level2.fits | modeM0/AS1T05_106T01_9000005642_41304cztM0_level2_quad_clean.evt |
| Size (bytes) | 351,792,000 | 87,638,400 |
| Size | 335.5 MB | 83.6 MB |
| Events in quadrant A | 3,114,913 | 584,013 |
| Events in quadrant B | 2,597,592 | 608,197 |
| Events in quadrant C | 3,103,921 | 563,272 |
| Events in quadrant D | 3,787,108 | 522,223 |
| Mode M0 | |||
|---|---|---|---|
| Quadrant | BADHDUFLAG | Total packets | Discarded packets |
| A | 0 | 12414 | 3 |
| B | 0 | 11562 | 2 |
| C | 0 | 12581 | 2 |
| D | 0 | 14953 | 2 |
| Mode SS | |||
|---|---|---|---|
| Quadrant | BADHDUFLAG | Total packets | Discarded packets |
| A | 0 | 108 | 0 |
| B | 0 | 108 | 0 |
| C | 0 | 108 | 0 |
| D | 0 | 108 | 0 |
| Mode M9 | |||
|---|---|---|---|
| Quadrant | BADHDUFLAG | Total packets | Discarded packets |
| A | 0 | 24 | 0 |
| B | 0 | 24 | 0 |
| C | 0 | 24 | 0 |
| D | 0 | 25 | 0 |
| Quadrant | Total seconds | Saturated seconds | Saturation percentage |
|---|---|---|---|
| A | 5375 | 76 | 1.413953% |
| B | 5375 | 15 | 0.279070% |
| C | 5375 | 252 | 4.688372% |
| D | 5375 | 236 | 4.390698% |
Noise dominated data is calculated using 1-second bins in cleaned event files. If a bin has >2000 counts, and if more than 50% of those come from <1% of pixels, then it is considered to be noise-dominated and hence unusable.
| Quadrant | # 1 sec bins | Bins with >0 counts | Bins with >2000 counts | High rate bins dominated by noise | Noise dominated (total time) | Noise dominated (detector-on time) | Marked lightcurve |
|---|---|---|---|---|---|---|---|
| A | 7108 | 5376 | 62 | 62 | 0.87% | 1.15% | 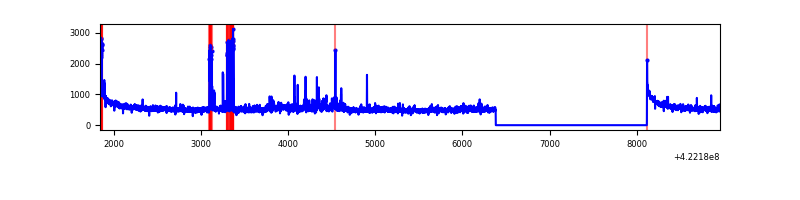 |
| B | 7108 | 5376 | 1 | 1 | 0.01% | 0.02% | 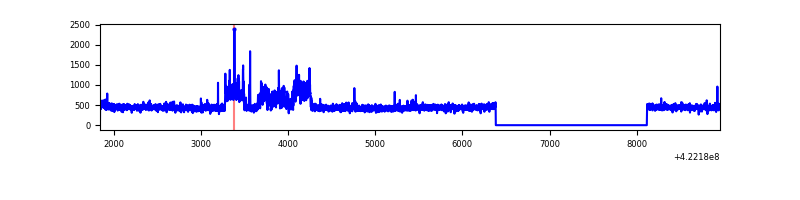 |
| C | 7108 | 5376 | 244 | 244 | 3.43% | 4.54% | 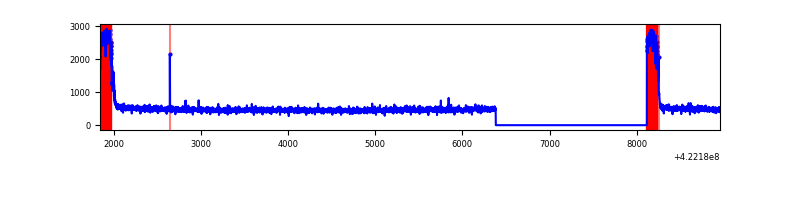 |
| D | 7108 | 5376 | 241 | 241 | 3.39% | 4.48% | 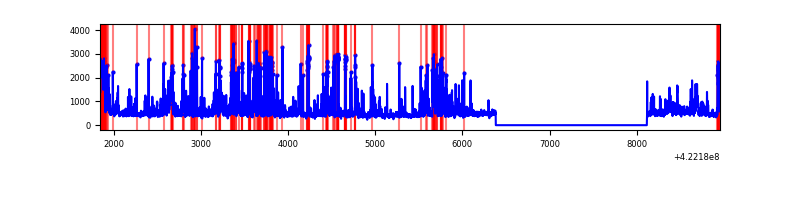 |
Top three noisy pixels from each quadrant. If the there are fewer than three noisy pixels in the level2.evt file, extra rows are filled as -1
| Pixel properties | Quadrant properties | ||||||
|---|---|---|---|---|---|---|---|
| Quadrant | DetID | PixID | Counts | Sigma | Mean | Median | Sigma |
| A | 10 | 83 | 515157 | 4299.43 | 579 | 567 | 119.7 |
| A | 6 | 10 | 173455 | 1444.49 | 579 | 567 | 119.7 |
| A | 12 | 189 | 91589 | 760.49 | 579 | 567 | 119.7 |
| B | 0 | 186 | 238572 | 2134.8 | 579 | 562 | 111.5 |
| B | 0 | 245 | 37811 | 334.1 | 579 | 562 | 111.5 |
| B | 0 | 229 | 21175 | 184.89 | 579 | 562 | 111.5 |
| C | 0 | 10 | 697721 | 5459.83 | 550 | 553 | 127.7 |
| C | 15 | 214 | 227162 | 1774.67 | 550 | 553 | 127.7 |
| C | 10 | 70 | 18599 | 141.33 | 550 | 553 | 127.7 |
| D | 2 | 249 | 576857 | 4263.93 | 557 | 540 | 135.2 |
| D | 5 | 222 | 463079 | 3422.14 | 557 | 540 | 135.2 |
| D | 13 | 249 | 239316 | 1766.61 | 557 | 540 | 135.2 |
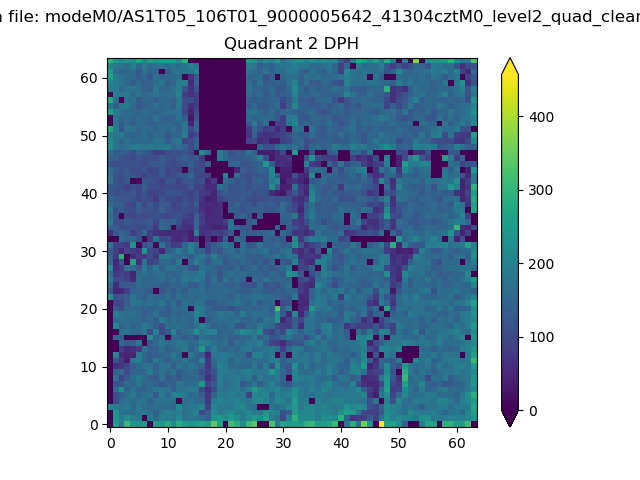
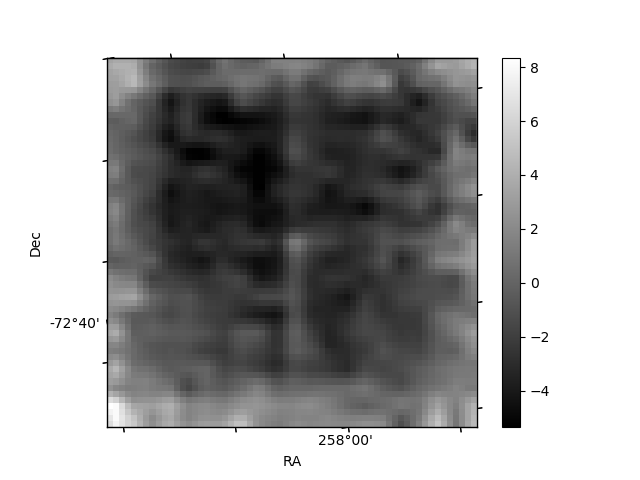
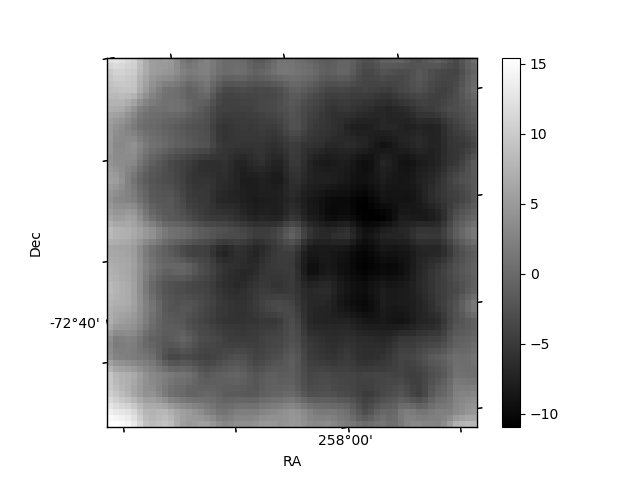
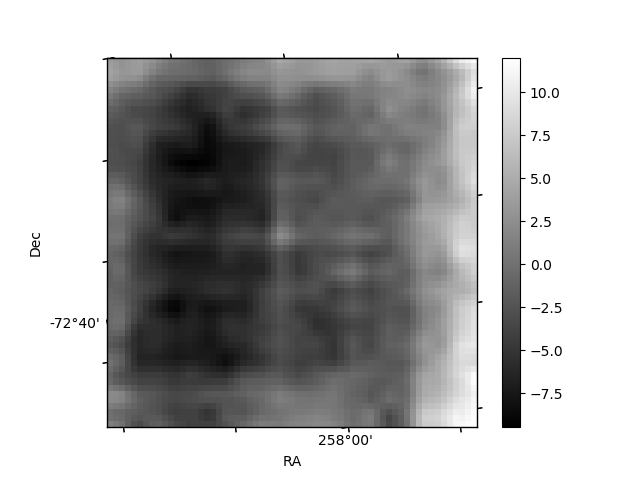
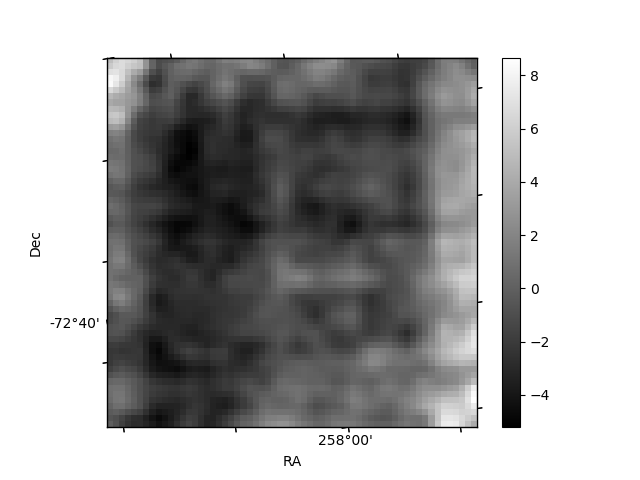
Histogram calculated using DETX and DETY for each event in the final _common_clean file
| Quadrant A | 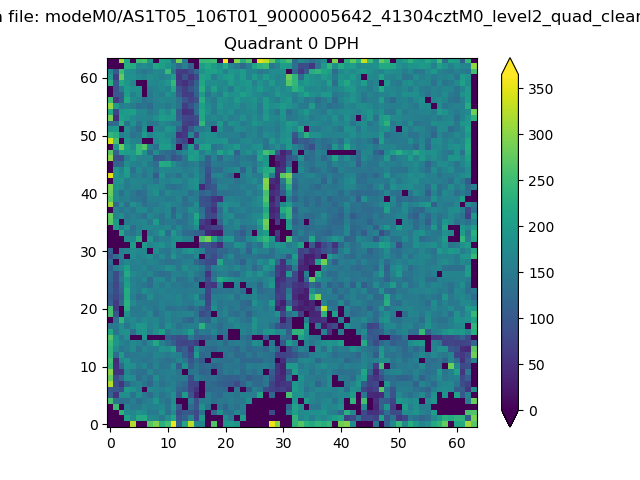 |
 |
Quadrant B |
|---|---|---|---|
| Quadrant D |  |
 |
Quadrant C |
| Plot type | Count rate plots | Images |
|---|---|---|
| Comparison with Poisson distribution Blue bars denote a histogram of data divided into 1 sec bins. Red curve is a Poisson curve with rate = median count rate of data. |
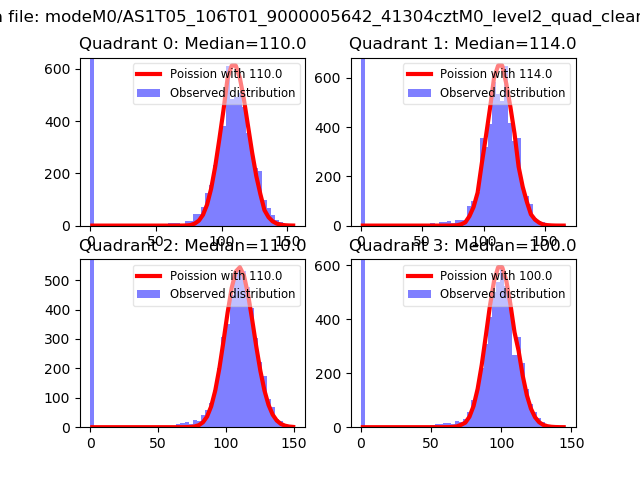 |
 |
| Quadrant-wise count rates Data is divided into 100 sec bins |
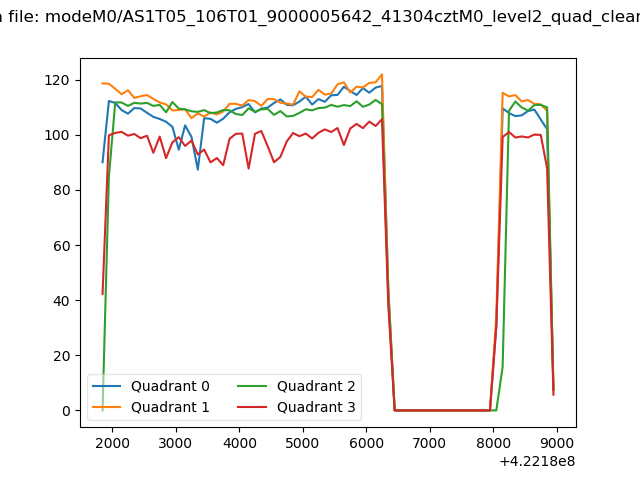 |
|
| Module-wise count rates for Quadrant A Data is divided into 100 sec bins |
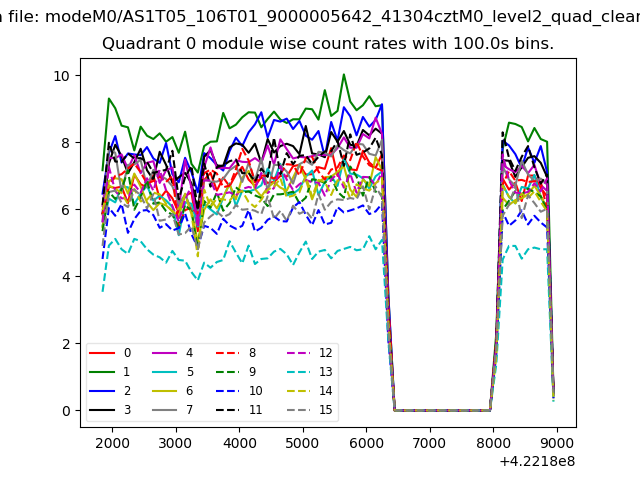 |
 |
| Module-wise count rates for Quadrant B Data is divided into 100 sec bins |
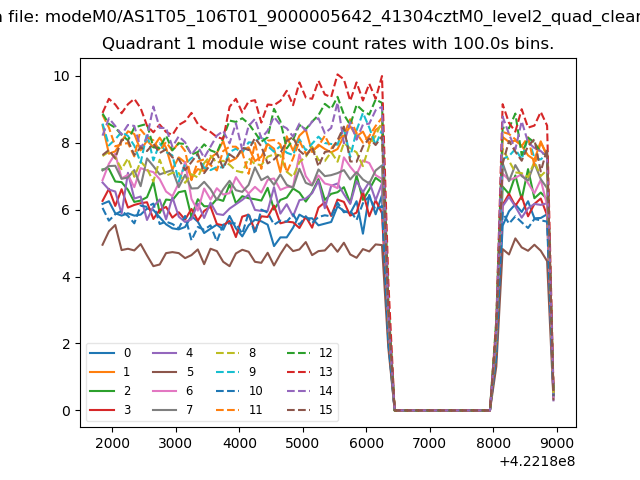 |
 |
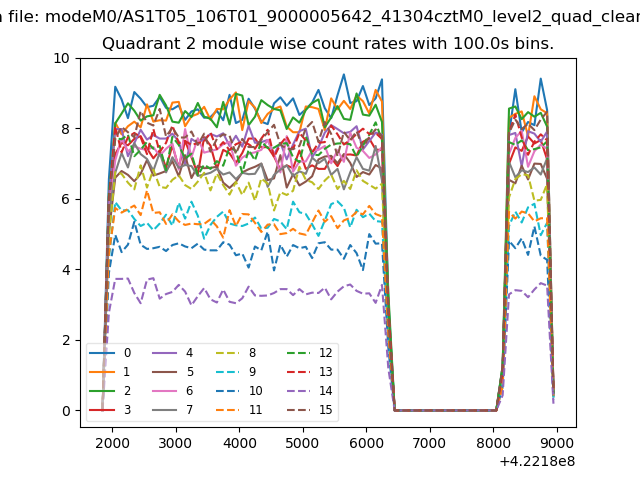
| Module-wise count rates for Quadrant C Data is divided into 100 sec bins |
 |
 |
| Module-wise count rates for Quadrant D Data is divided into 100 sec bins |
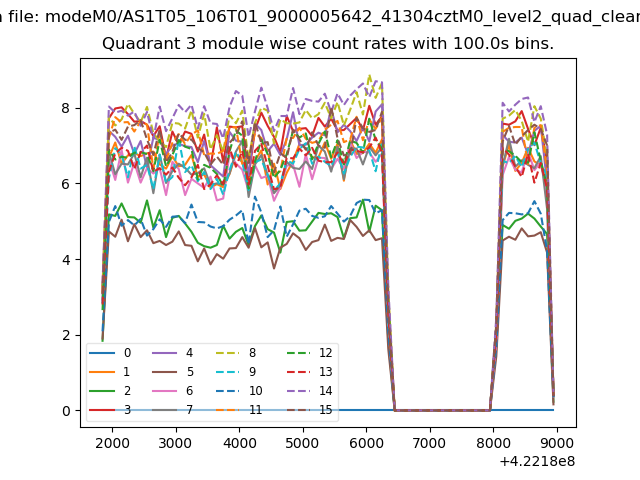 |
 |
| Parameter | Plot |
|---|---|
| CZT HV Monitor | 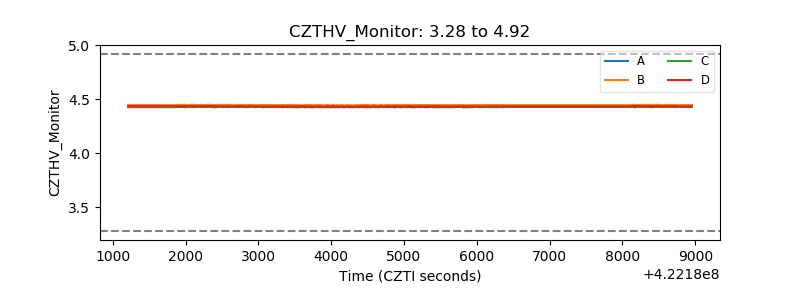 |
| D_VDD | 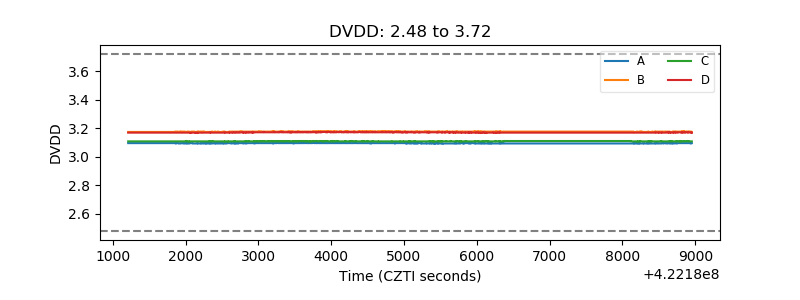 |
| Temperature 1 | 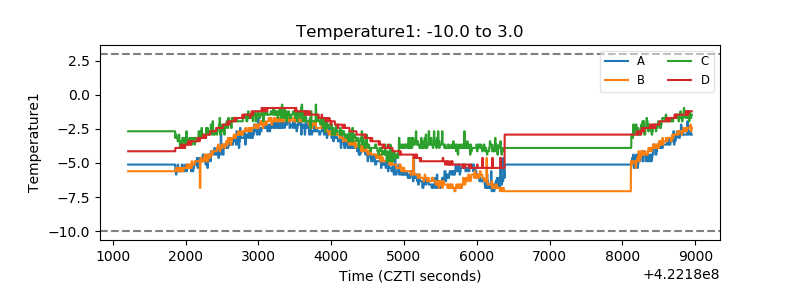 |
| Veto HV Monitor | 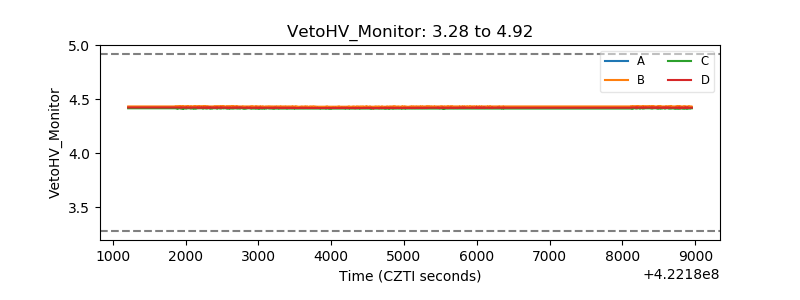 |
| Veto LLD | 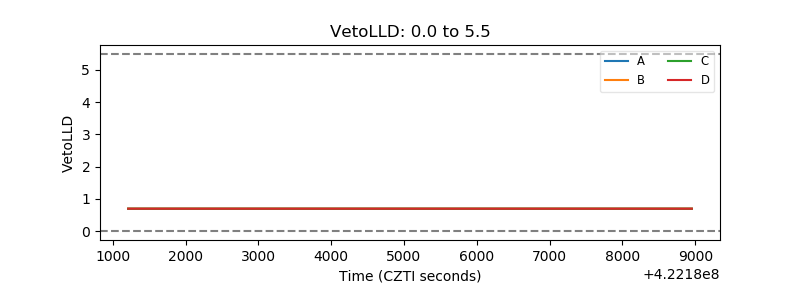 |
| Alpha Counter | 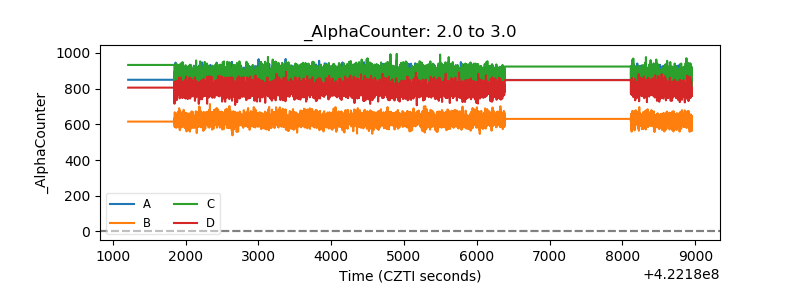 |
| _CPM_Rate |  |
| CZT Counter | 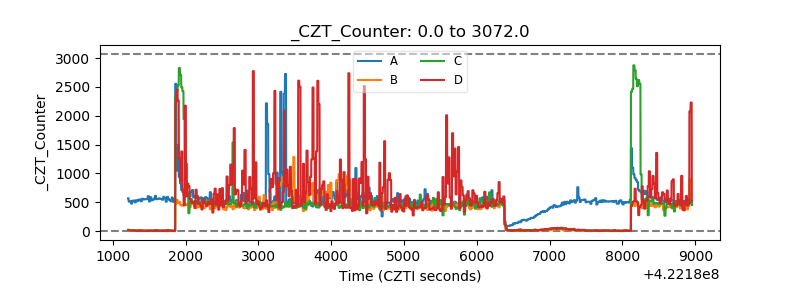 |
| +2.5 Volts monitor |  |
| +5 Volts monitor | 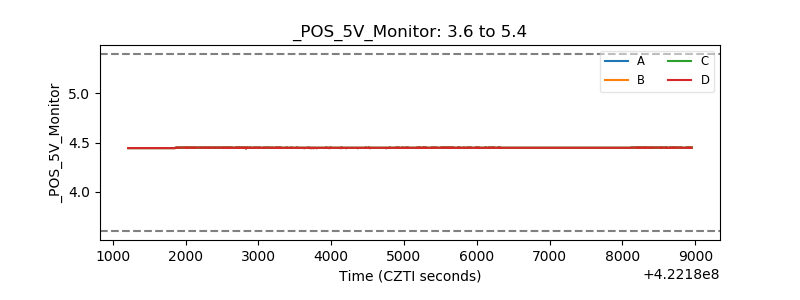 |
| _ROLL_ROT | 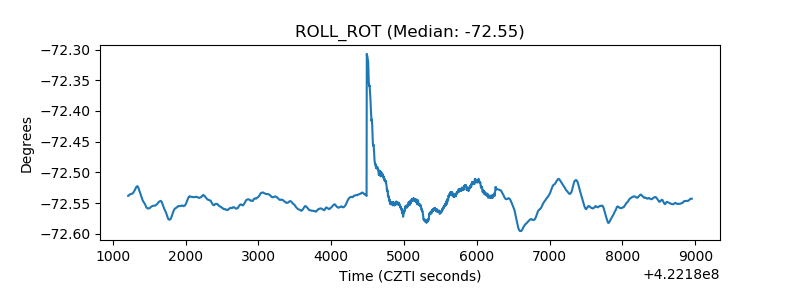 |
| _Roll_DEC | 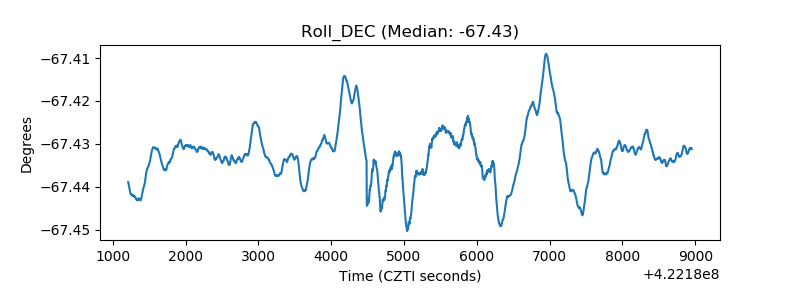 |
| _Roll_RA | 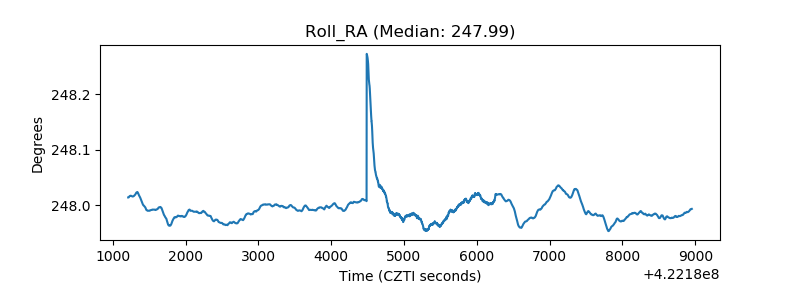 |
| Veto Counter | 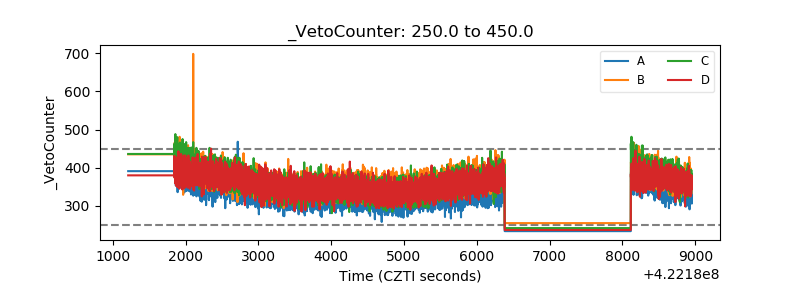 |