| Param | Original file | Final file |
|---|---|---|
| Filename | modeM0/AS1T05_106T01_9000005642_41309cztM0_level2.fits | modeM0/AS1T05_106T01_9000005642_41309cztM0_level2_quad_clean.evt |
| Size (bytes) | 633,983,040 | 157,242,240 |
| Size | 604.6 MB | 150.0 MB |
| Events in quadrant A | 5,256,303 | 1,073,983 |
| Events in quadrant B | 4,349,906 | 1,104,603 |
| Events in quadrant C | 5,252,328 | 1,023,758 |
| Events in quadrant D | 7,834,353 | 866,731 |
| Mode M0 | |||
|---|---|---|---|
| Quadrant | BADHDUFLAG | Total packets | Discarded packets |
| A | 0 | 21740 | 2 |
| B | 0 | 20132 | 2 |
| C | 0 | 22195 | 2 |
| D | 0 | 30471 | 2 |
| Mode SS | |||
|---|---|---|---|
| Quadrant | BADHDUFLAG | Total packets | Discarded packets |
| A | 0 | 204 | 0 |
| B | 0 | 204 | 0 |
| C | 0 | 204 | 0 |
| D | 0 | 204 | 0 |
| Mode M9 | |||
|---|---|---|---|
| Quadrant | BADHDUFLAG | Total packets | Discarded packets |
| A | 0 | 36 | 0 |
| B | 0 | 36 | 0 |
| C | 0 | 36 | 0 |
| D | 0 | 37 | 0 |
| Quadrant | Total seconds | Saturated seconds | Saturation percentage |
|---|---|---|---|
| A | 9981 | 15 | 0.150286% |
| B | 9981 | 14 | 0.140267% |
| C | 9981 | 313 | 3.135958% |
| D | 9981 | 1130 | 11.321511% |
Noise dominated data is calculated using 1-second bins in cleaned event files. If a bin has >2000 counts, and if more than 50% of those come from <1% of pixels, then it is considered to be noise-dominated and hence unusable.
| Quadrant | # 1 sec bins | Bins with >0 counts | Bins with >2000 counts | High rate bins dominated by noise | Noise dominated (total time) | Noise dominated (detector-on time) | Marked lightcurve |
|---|---|---|---|---|---|---|---|
| A | 12607 | 9983 | 6 | 6 | 0.05% | 0.06% | 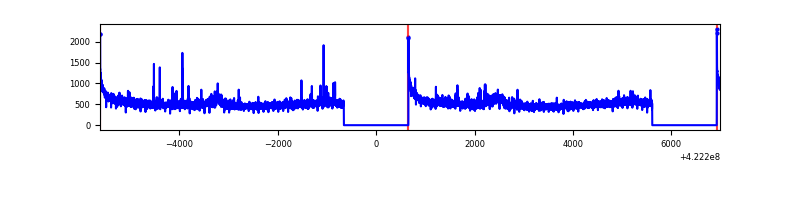 |
| B | 12607 | 9983 | 1 | 1 | 0.01% | 0.01% | 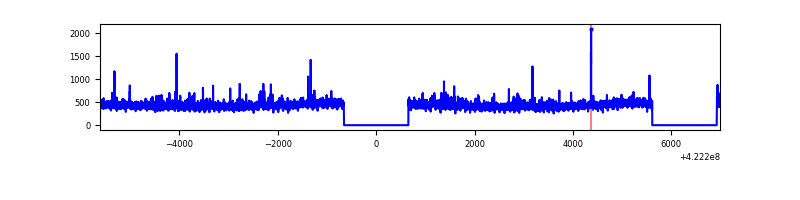 |
| C | 12606 | 9982 | 298 | 298 | 2.36% | 2.99% | 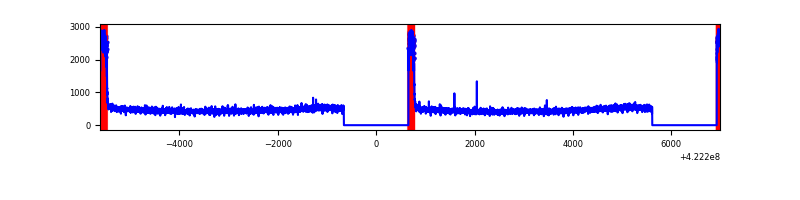 |
| D | 12607 | 9983 | 1062 | 1062 | 8.42% | 10.64% | 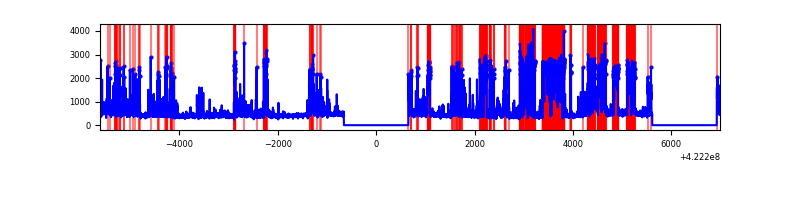 |
Top three noisy pixels from each quadrant. If the there are fewer than three noisy pixels in the level2.evt file, extra rows are filled as -1
| Pixel properties | Quadrant properties | ||||||
|---|---|---|---|---|---|---|---|
| Quadrant | DetID | PixID | Counts | Sigma | Mean | Median | Sigma |
| A | 10 | 83 | 836648 | 3809.13 | 1072 | 1050 | 219.4 |
| A | 12 | 189 | 135691 | 613.77 | 1072 | 1050 | 219.4 |
| A | 2 | 79 | 79860 | 359.26 | 1072 | 1050 | 219.4 |
| B | 0 | 245 | 52365 | 248.01 | 1070 | 1038 | 207.0 |
| B | 5 | 255 | 46041 | 217.45 | 1070 | 1038 | 207.0 |
| B | 0 | 229 | 34685 | 162.58 | 1070 | 1038 | 207.0 |
| C | 0 | 10 | 830301 | 3488.2 | 1027 | 1037 | 237.7 |
| C | 15 | 214 | 408316 | 1713.17 | 1027 | 1037 | 237.7 |
| C | 13 | 61 | 6884 | 24.59 | 1027 | 1037 | 237.7 |
| D | 2 | 120 | 1954134 | 8001.52 | 1000 | 970 | 244.1 |
| D | 2 | 249 | 890701 | 3644.96 | 1000 | 970 | 244.1 |
| D | 1 | 47 | 377565 | 1542.79 | 1000 | 970 | 244.1 |
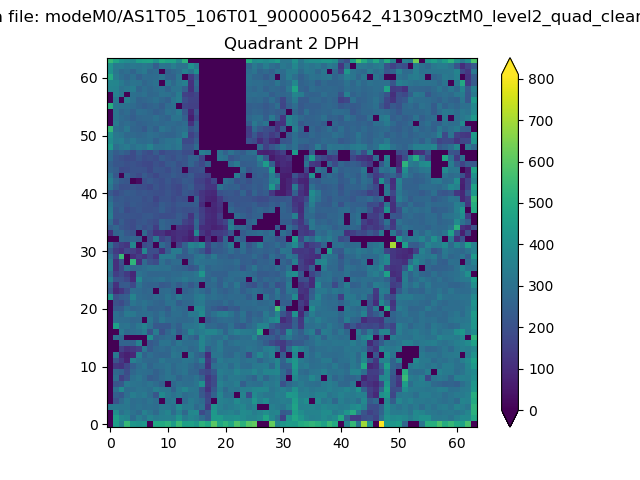
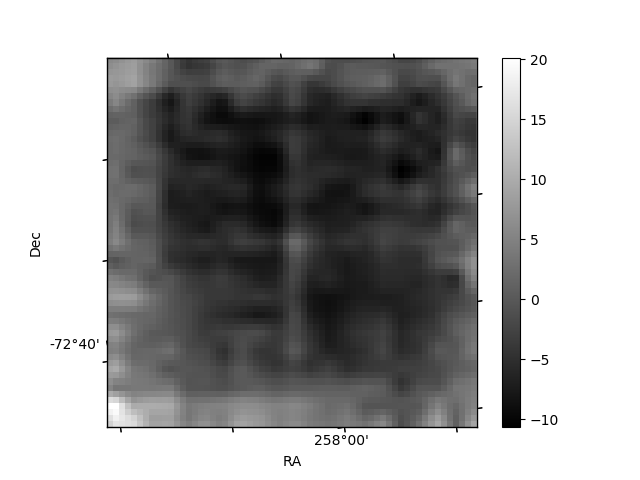
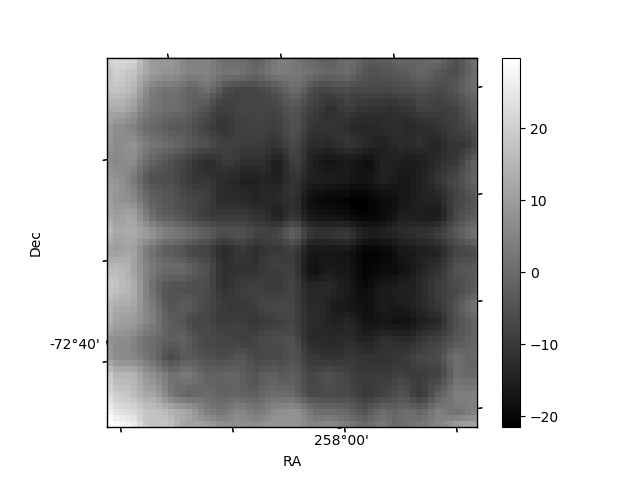
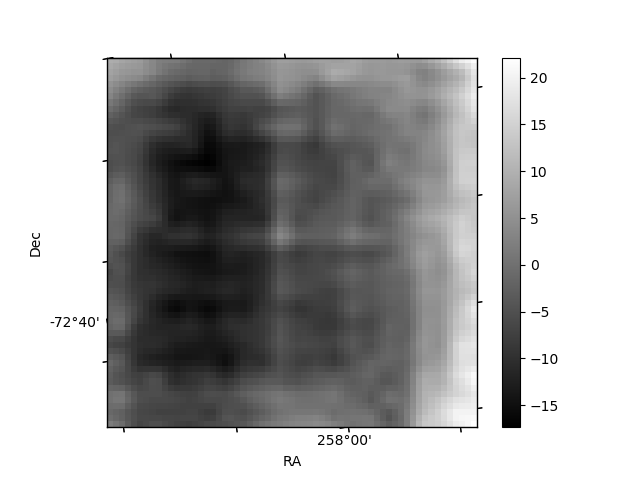
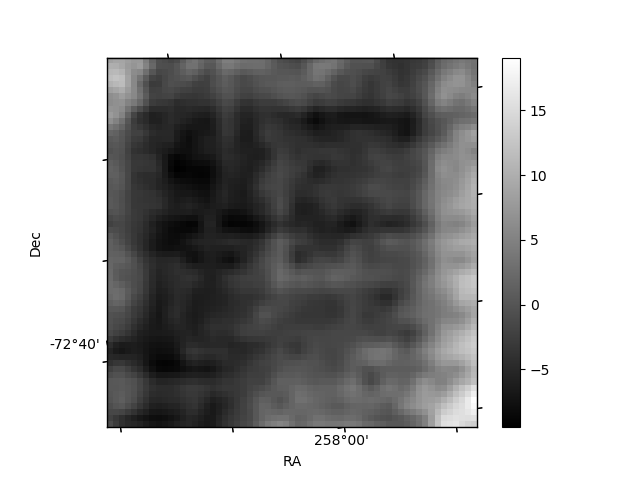
Histogram calculated using DETX and DETY for each event in the final _common_clean file
| Quadrant A | 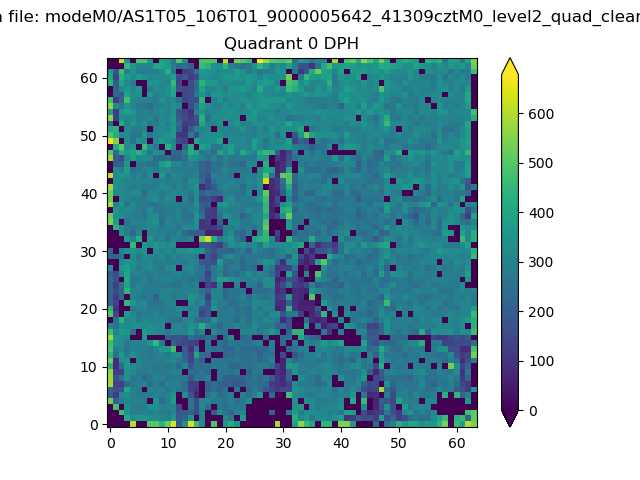 |
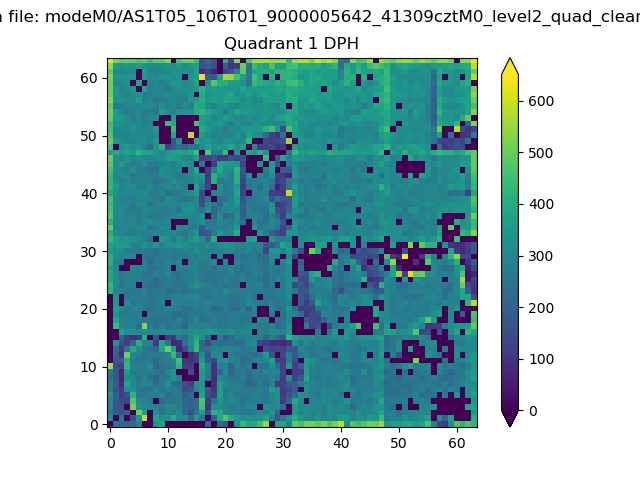 |
Quadrant B |
|---|---|---|---|
| Quadrant D | 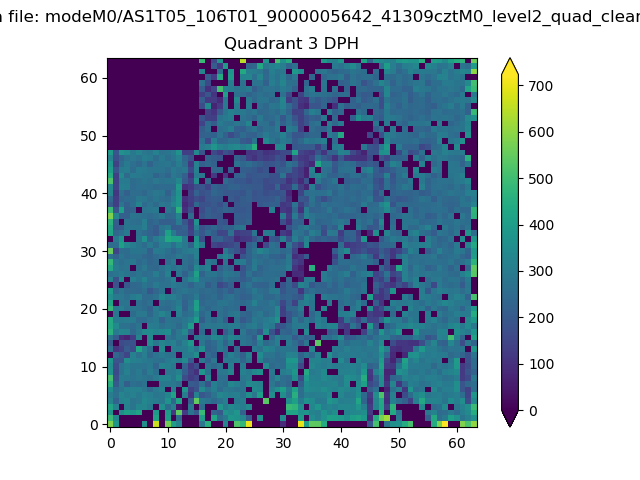 |
 |
Quadrant C |
| Plot type | Count rate plots | Images |
|---|---|---|
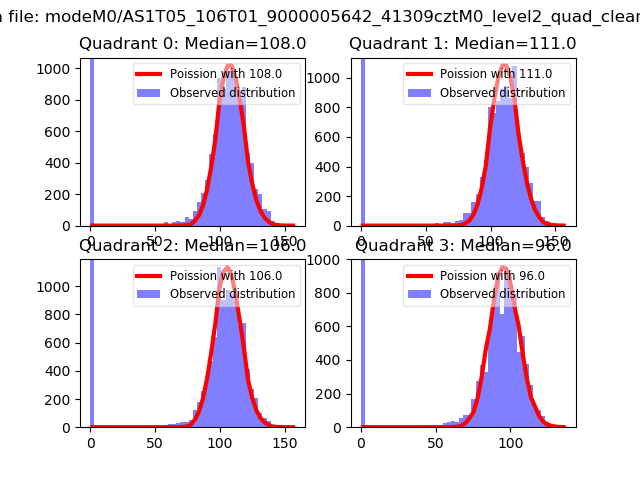
| Comparison with Poisson distribution Blue bars denote a histogram of data divided into 1 sec bins. Red curve is a Poisson curve with rate = median count rate of data. |
 |
 |
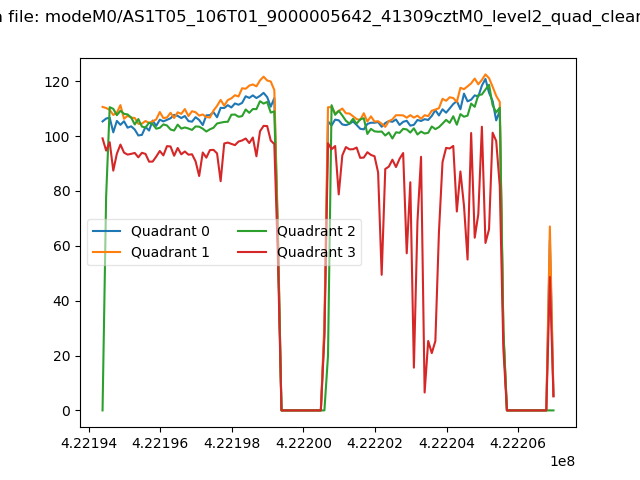
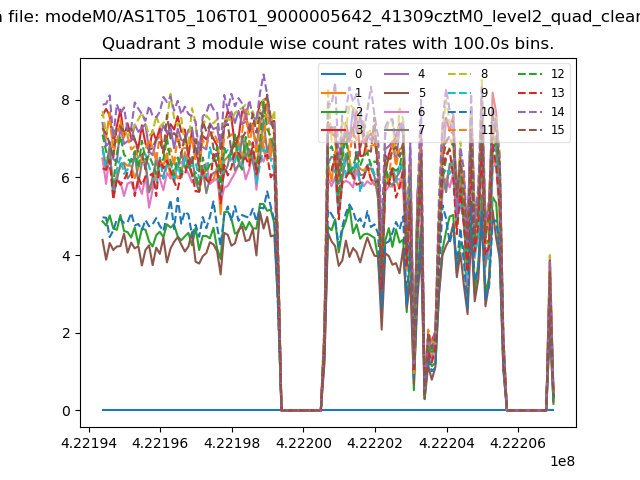
| Quadrant-wise count rates Data is divided into 100 sec bins |
 |
|
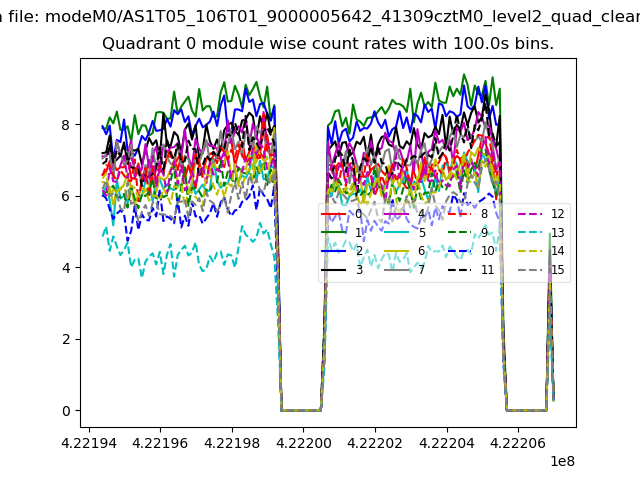
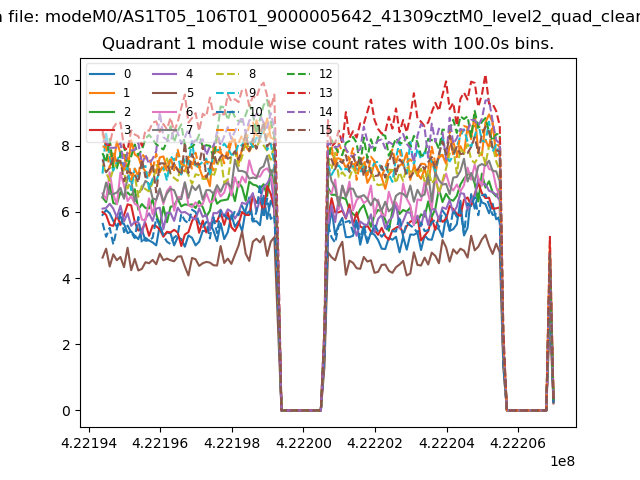
| Module-wise count rates for Quadrant A Data is divided into 100 sec bins |
 |
 |
| Module-wise count rates for Quadrant B Data is divided into 100 sec bins |
 |
 |
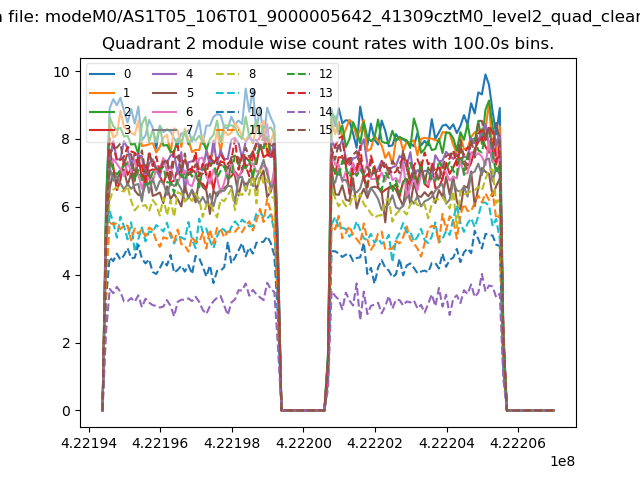
| Module-wise count rates for Quadrant C Data is divided into 100 sec bins |
 |
 |
| Module-wise count rates for Quadrant D Data is divided into 100 sec bins |
 |
 |
| Parameter | Plot |
|---|---|
| CZT HV Monitor | 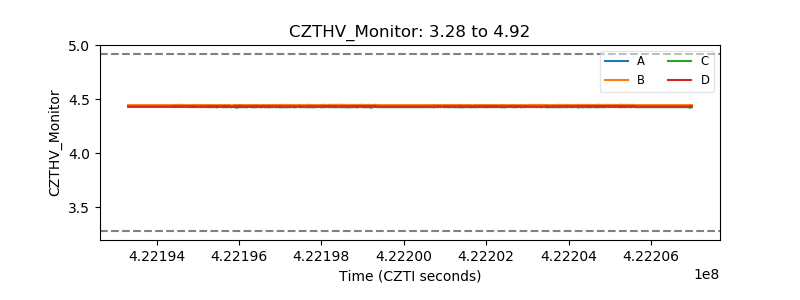 |
| D_VDD | 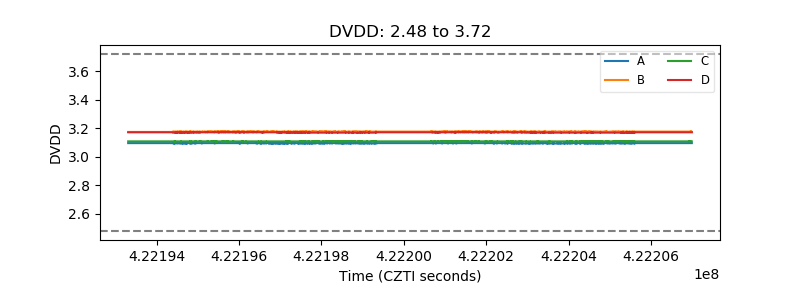 |
| Temperature 1 | 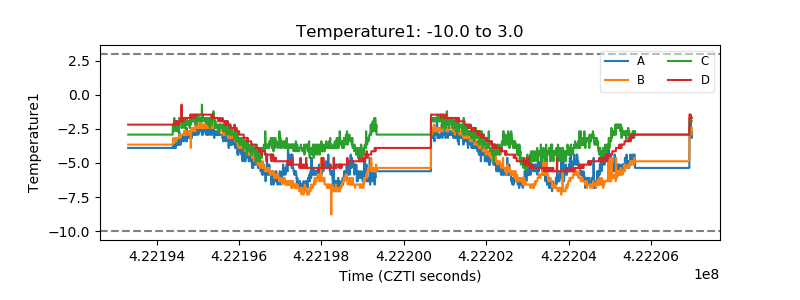 |
| Veto HV Monitor | 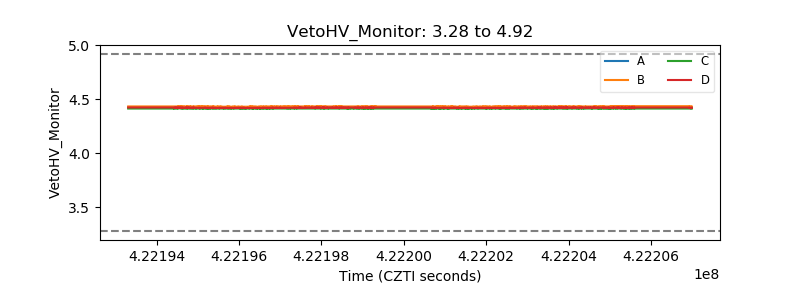 |
| Veto LLD | 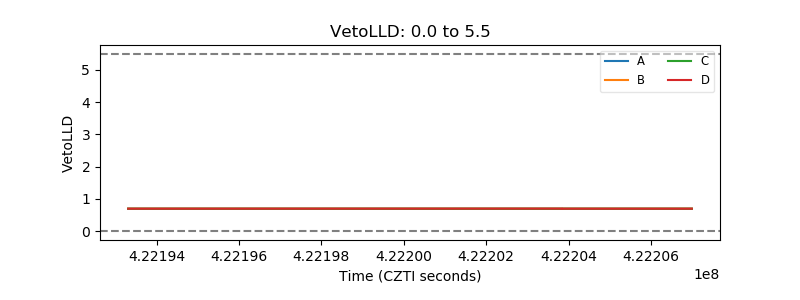 |
| Alpha Counter | 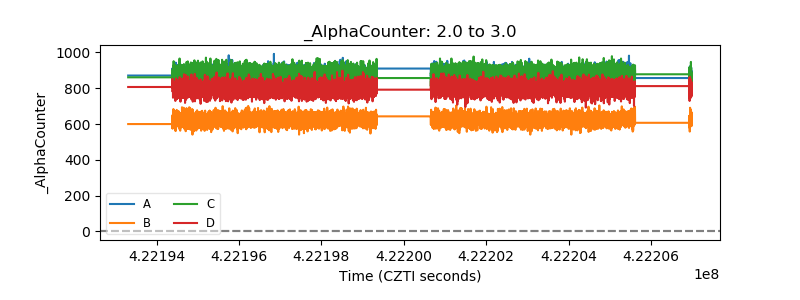 |
| _CPM_Rate | 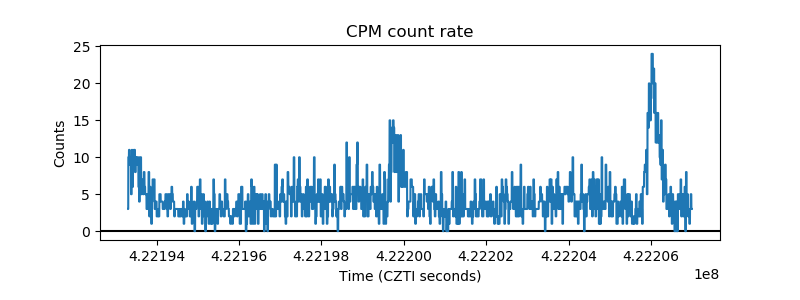 |
| CZT Counter | 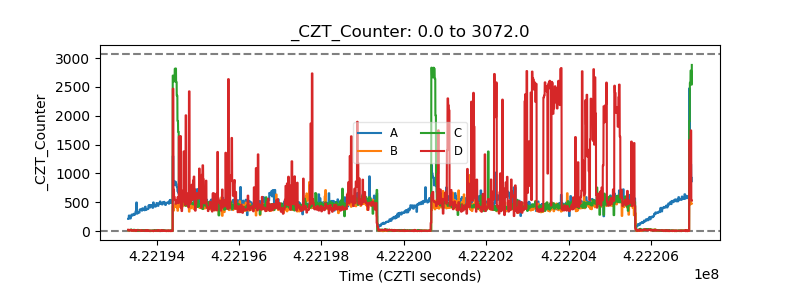 |
| +2.5 Volts monitor | 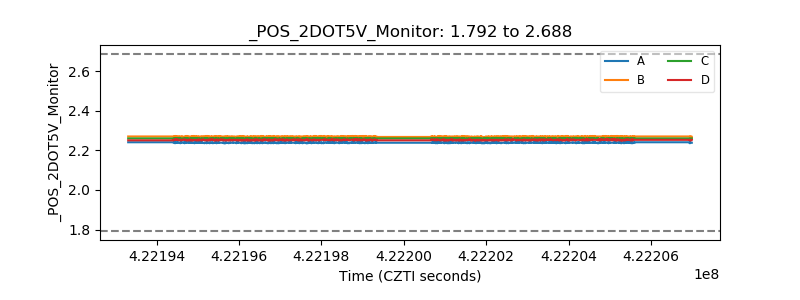 |
| +5 Volts monitor |  |
| _ROLL_ROT | 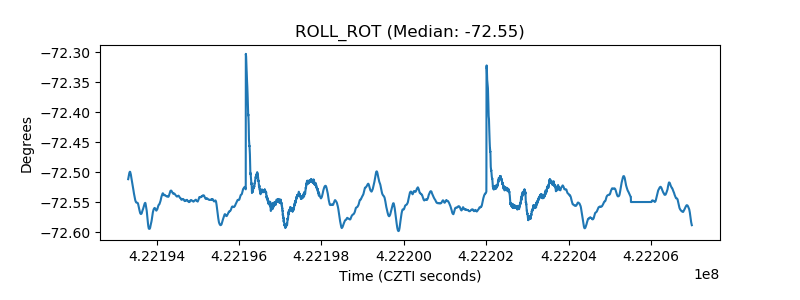 |
| _Roll_DEC |  |
| _Roll_RA | 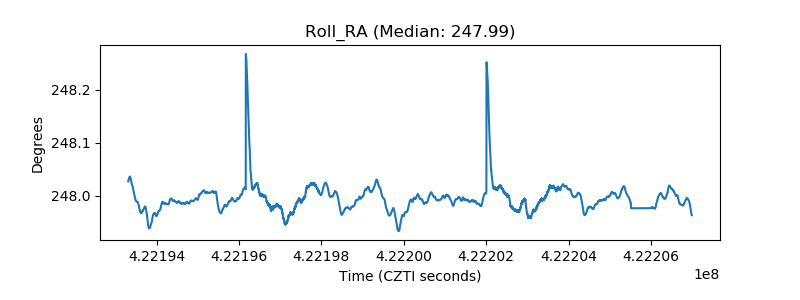 |
| Veto Counter | 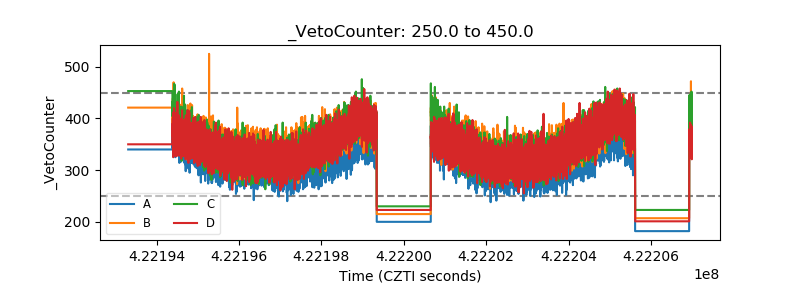 |