| Param | Original file | Final file |
|---|---|---|
| Filename | modeM0/AS1A12_025T08_9000005644_41309cztM0_level2.fits | modeM0/AS1A12_025T08_9000005644_41309cztM0_level2_quad_clean.evt |
| Size (bytes) | 642,470,400 | 153,319,680 |
| Size | 612.7 MB | 146.2 MB |
| Events in quadrant A | 5,337,252 | 1,057,052 |
| Events in quadrant B | 4,555,904 | 1,081,643 |
| Events in quadrant C | 4,924,542 | 993,263 |
| Events in quadrant D | 8,216,249 | 841,894 |
| Mode SS | |||
|---|---|---|---|
| Quadrant | BADHDUFLAG | Total packets | Discarded packets |
| A | 0 | 196 | 0 |
| B | 0 | 196 | 0 |
| C | 0 | 196 | 0 |
| D | 0 | 196 | 0 |
| Mode M9 | |||
|---|---|---|---|
| Quadrant | BADHDUFLAG | Total packets | Discarded packets |
| A | 0 | 29 | 0 |
| B | 0 | 29 | 0 |
| C | 0 | 29 | 0 |
| D | 0 | 29 | 0 |
| Mode M0 | |||
|---|---|---|---|
| Quadrant | BADHDUFLAG | Total packets | Discarded packets |
| A | 0 | 21839 | 3 |
| B | 0 | 20252 | 2 |
| C | 0 | 20944 | 2 |
| D | 0 | 31260 | 2 |
| Quadrant | Total seconds | Saturated seconds | Saturation percentage |
|---|---|---|---|
| A | 9643 | 45 | 0.466660% |
| B | 9643 | 24 | 0.248885% |
| C | 9643 | 206 | 2.136265% |
| D | 9643 | 1163 | 12.060562% |
Noise dominated data is calculated using 1-second bins in cleaned event files. If a bin has >2000 counts, and if more than 50% of those come from <1% of pixels, then it is considered to be noise-dominated and hence unusable.
| Quadrant | # 1 sec bins | Bins with >0 counts | Bins with >2000 counts | High rate bins dominated by noise | Noise dominated (total time) | Noise dominated (detector-on time) | Marked lightcurve |
|---|---|---|---|---|---|---|---|
| A | 12507 | 9645 | 26 | 26 | 0.21% | 0.27% | 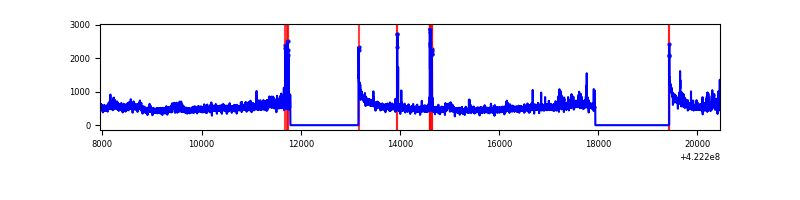 |
| B | 12507 | 9645 | 12 | 12 | 0.10% | 0.12% | 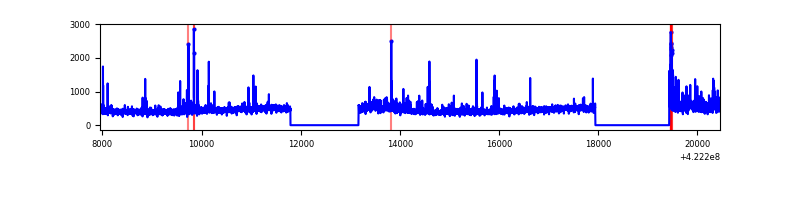 |
| C | 12507 | 9645 | 195 | 195 | 1.56% | 2.02% | 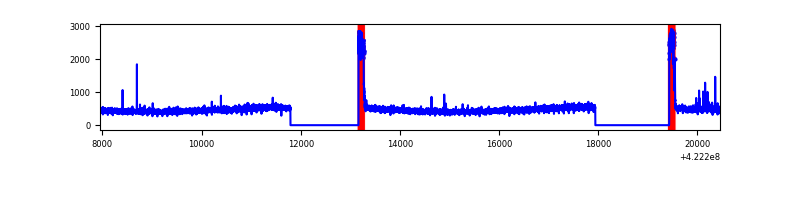 |
| D | 12506 | 9644 | 1237 | 1237 | 9.89% | 12.83% | 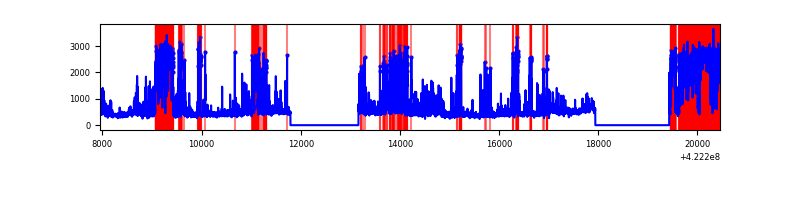 |
Top three noisy pixels from each quadrant. If the there are fewer than three noisy pixels in the level2.evt file, extra rows are filled as -1
| Pixel properties | Quadrant properties | ||||||
|---|---|---|---|---|---|---|---|
| Quadrant | DetID | PixID | Counts | Sigma | Mean | Median | Sigma |
| A | 10 | 83 | 782045 | 3593.52 | 1059 | 1037 | 217.3 |
| A | 12 | 189 | 277789 | 1273.37 | 1059 | 1037 | 217.3 |
| A | 2 | 79 | 85325 | 387.82 | 1059 | 1037 | 217.3 |
| B | 5 | 255 | 157622 | 768.03 | 1051 | 1022 | 203.9 |
| B | 0 | 245 | 106233 | 516.0 | 1051 | 1022 | 203.9 |
| B | 7 | 202 | 60665 | 292.51 | 1051 | 1022 | 203.9 |
| C | 0 | 10 | 552773 | 2331.43 | 1011 | 1016 | 236.7 |
| C | 15 | 214 | 397219 | 1674.14 | 1011 | 1016 | 236.7 |
| C | 9 | 54 | 25404 | 103.05 | 1011 | 1016 | 236.7 |
| D | 2 | 249 | 3321637 | 13876.65 | 979 | 952 | 239.3 |
| D | 5 | 222 | 453856 | 1892.62 | 979 | 952 | 239.3 |
| D | 13 | 249 | 272664 | 1135.44 | 979 | 952 | 239.3 |
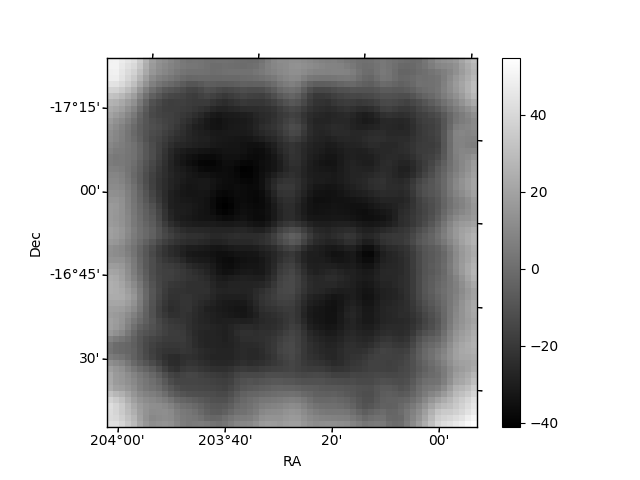
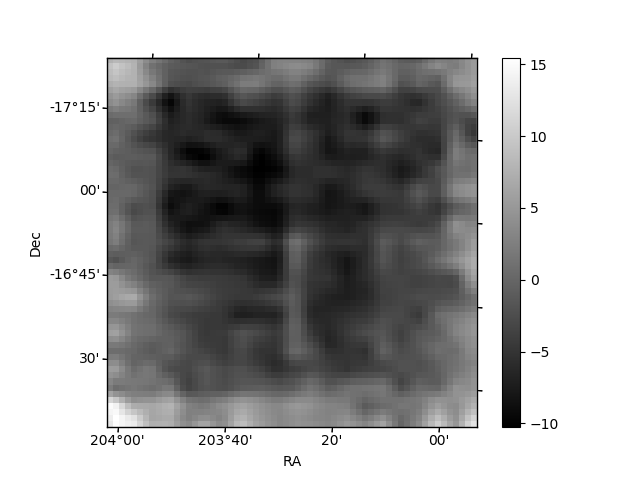
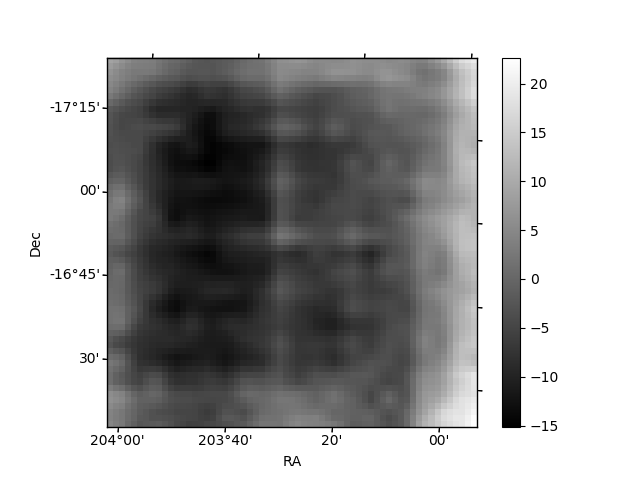
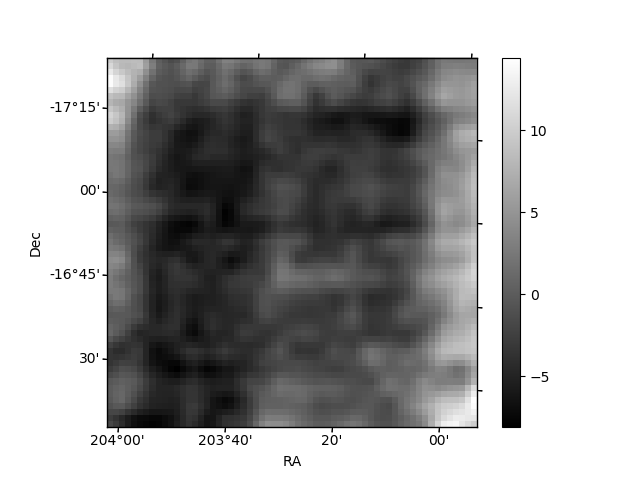
Histogram calculated using DETX and DETY for each event in the final _common_clean file
| Quadrant A | 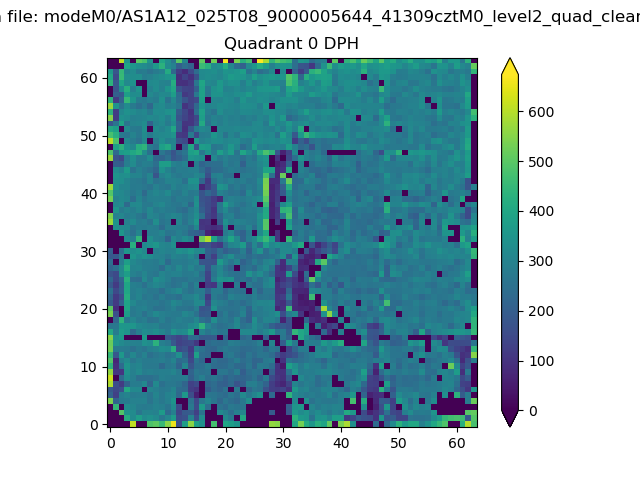 |
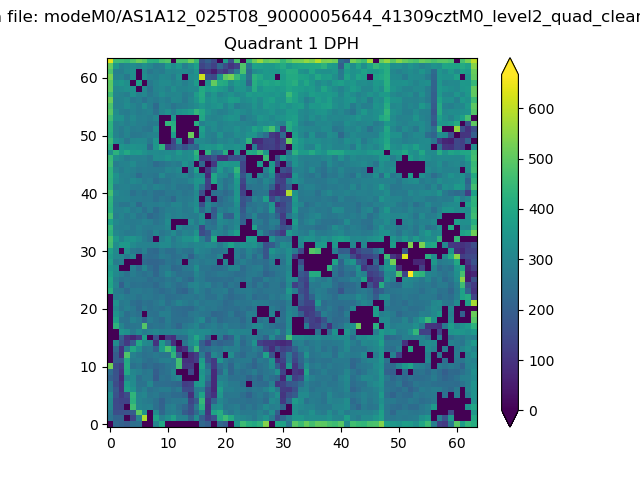 |
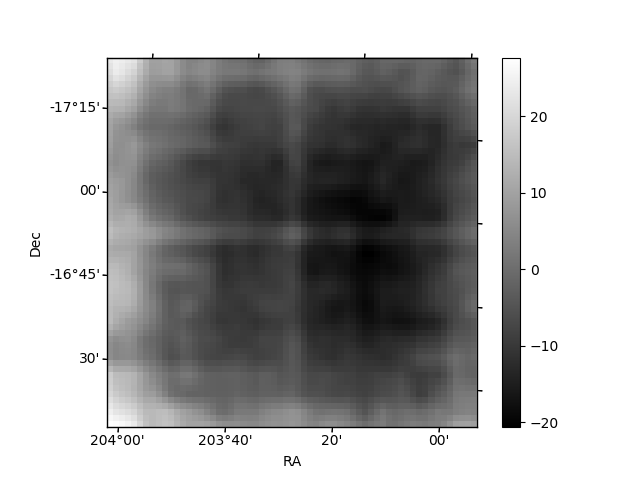
Quadrant B |
|---|---|---|---|
| Quadrant D | 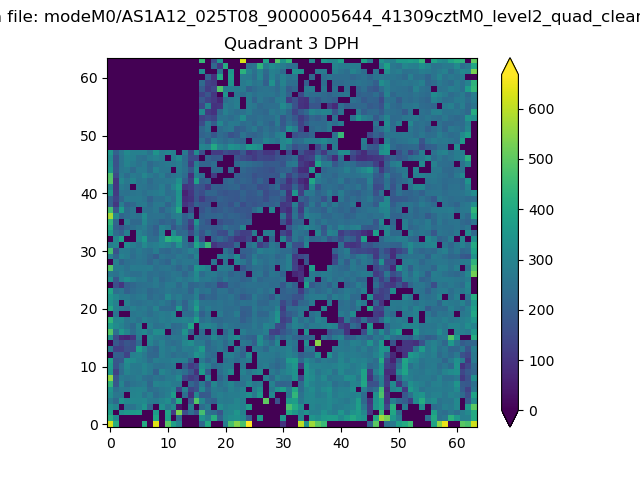 |
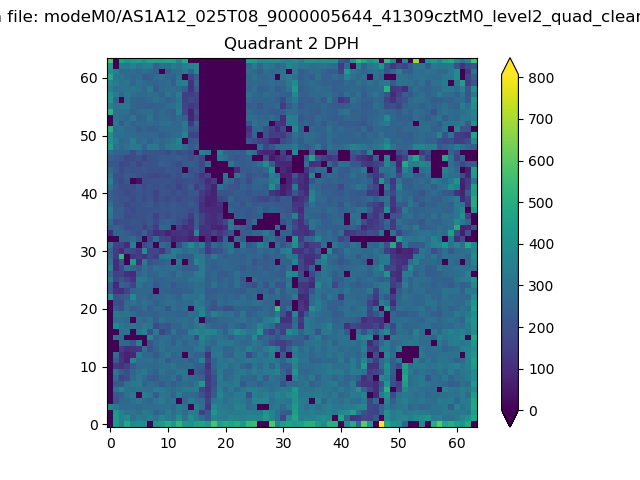 |
Quadrant C |
| Plot type | Count rate plots | Images |
|---|---|---|
| Comparison with Poisson distribution Blue bars denote a histogram of data divided into 1 sec bins. Red curve is a Poisson curve with rate = median count rate of data. |
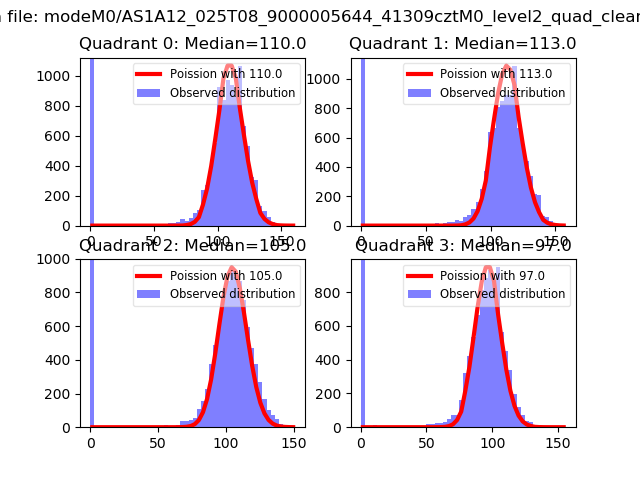 |
 |
| Quadrant-wise count rates Data is divided into 100 sec bins |
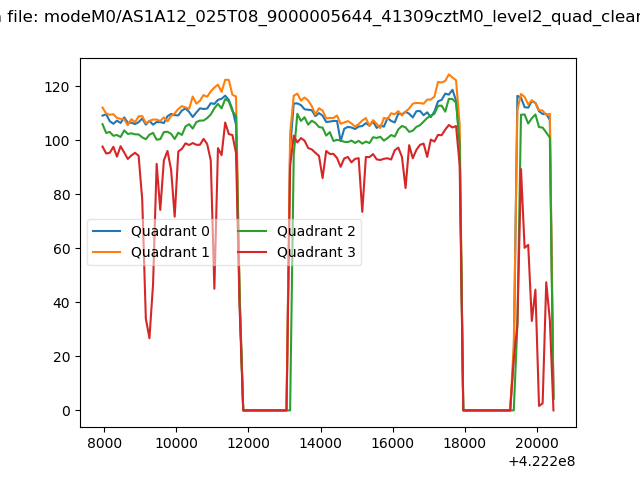 |
|
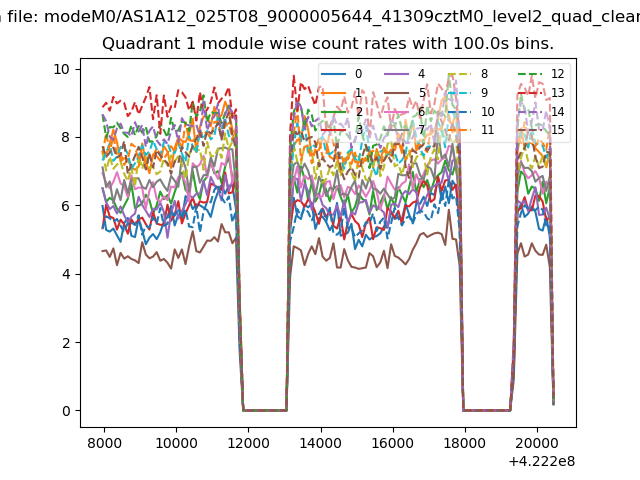
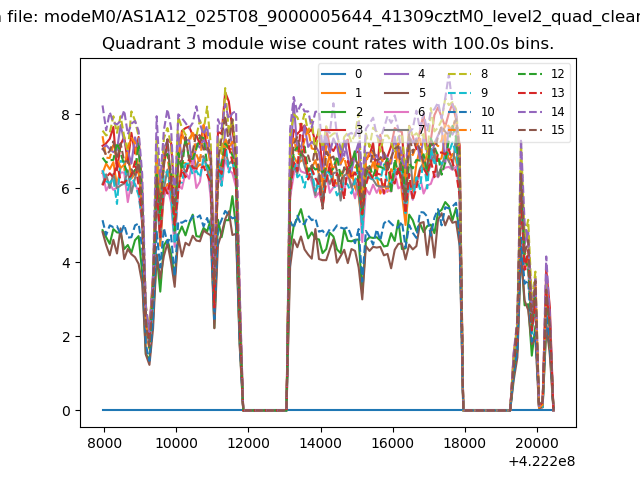
| Module-wise count rates for Quadrant A Data is divided into 100 sec bins |
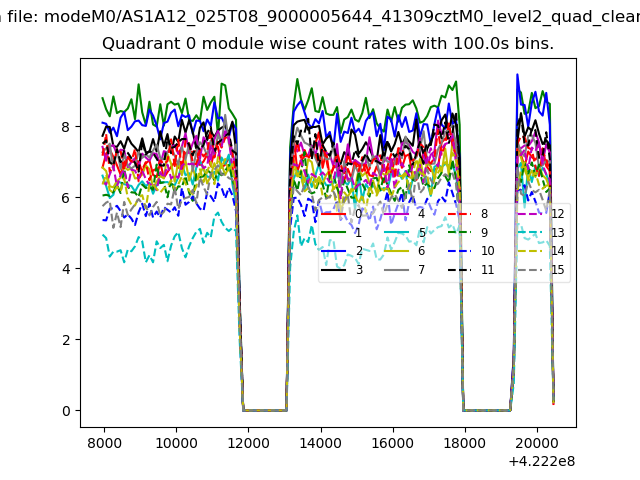 |
 |
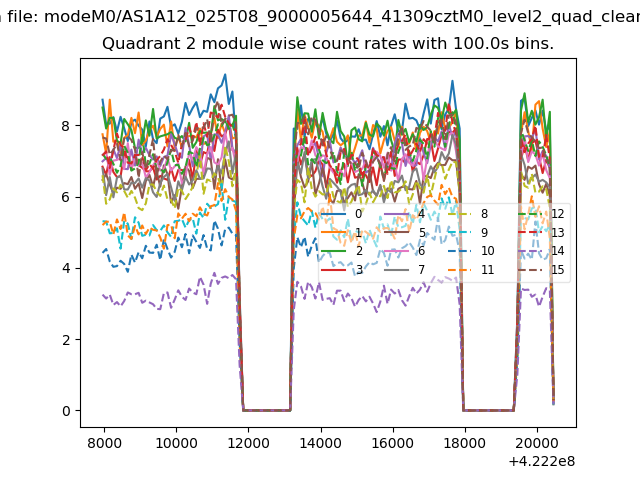
| Module-wise count rates for Quadrant B Data is divided into 100 sec bins |
 |
 |
| Module-wise count rates for Quadrant C Data is divided into 100 sec bins |
 |
 |
| Module-wise count rates for Quadrant D Data is divided into 100 sec bins |
 |
 |
| Parameter | Plot |
|---|---|
| CZT HV Monitor | 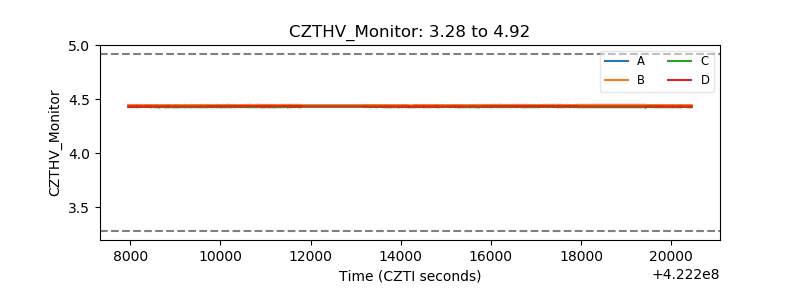 |
| D_VDD | 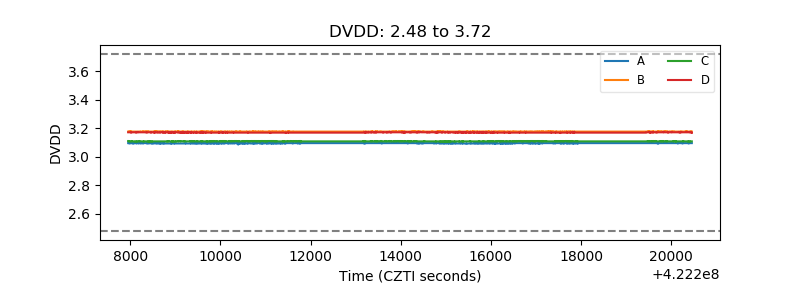 |
| Temperature 1 | 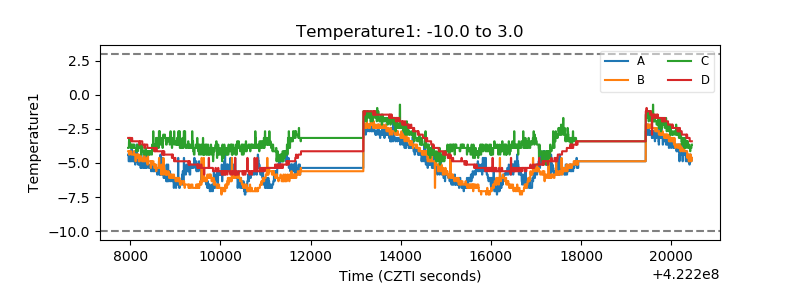 |
| Veto HV Monitor | 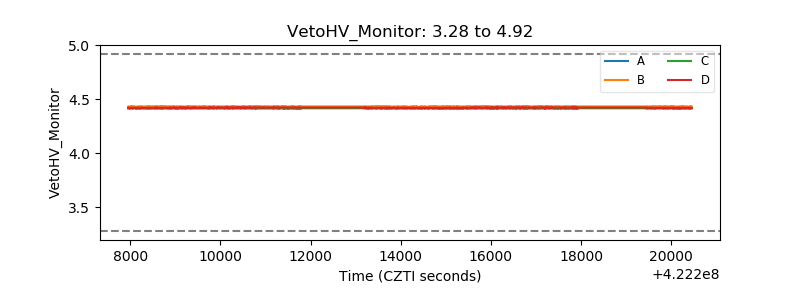 |
| Veto LLD | 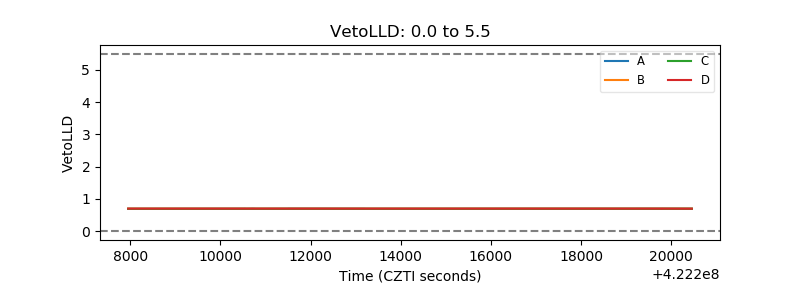 |
| Alpha Counter | 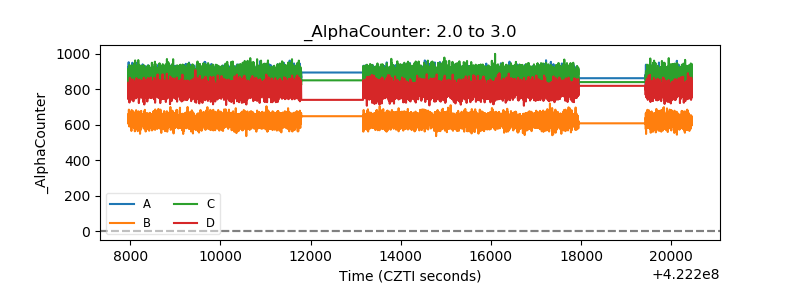 |
| _CPM_Rate | 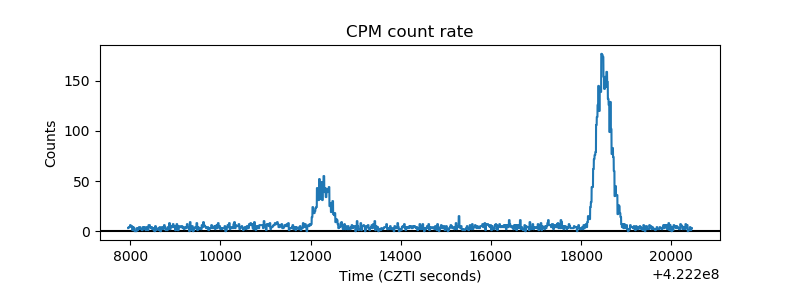 |
| CZT Counter | 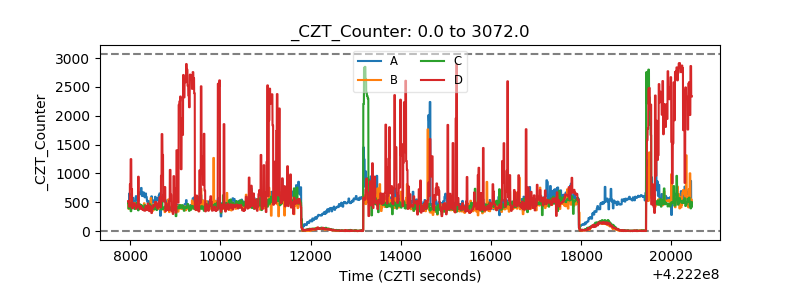 |
| +2.5 Volts monitor | 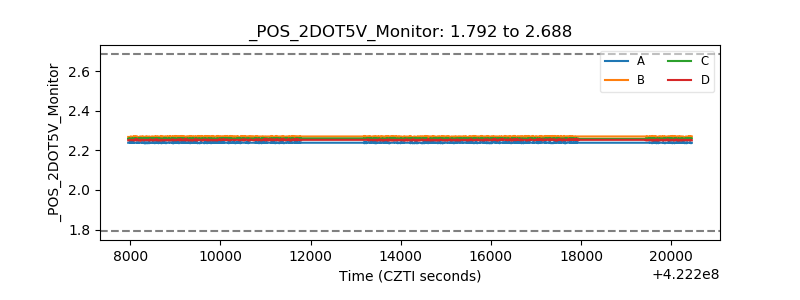 |
| +5 Volts monitor | 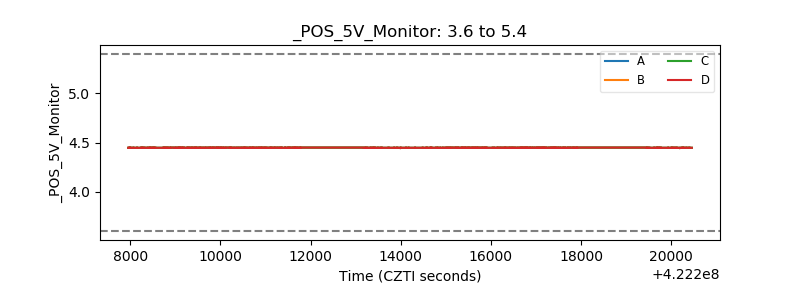 |
| _ROLL_ROT | 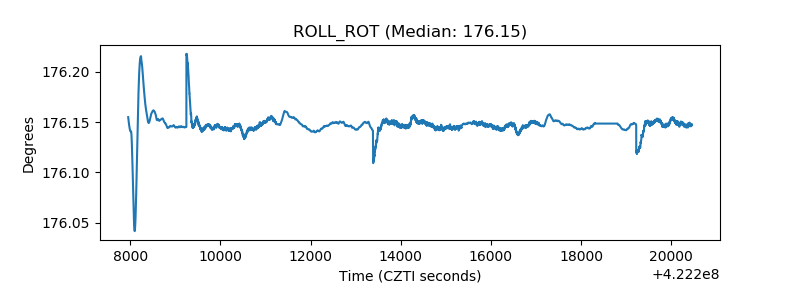 |
| _Roll_DEC | 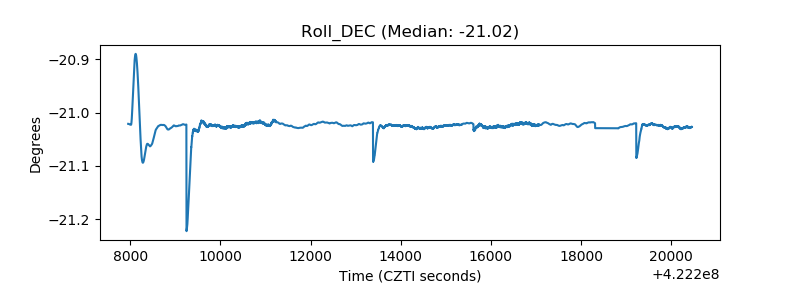 |
| _Roll_RA | 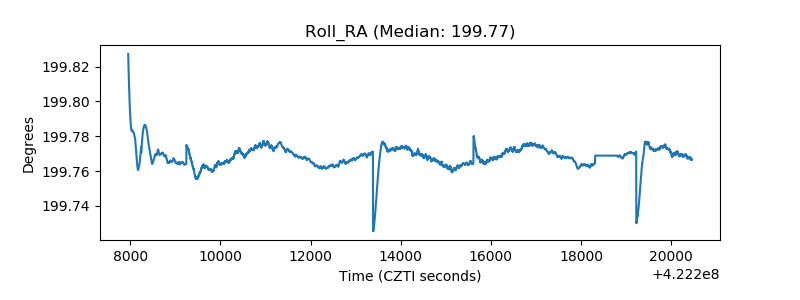 |
| Veto Counter | 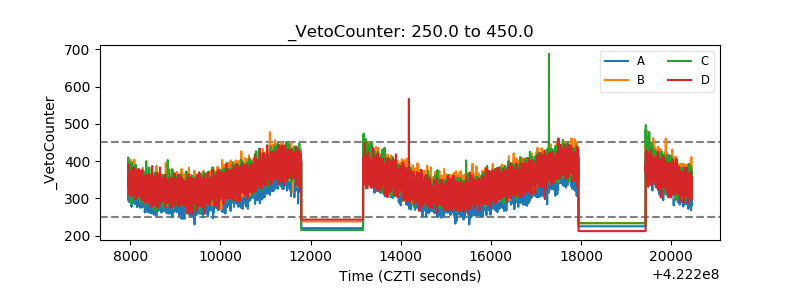 |