| Param | Original file | Final file |
|---|---|---|
| Filename | modeM0/AS1A12_025T08_9000005644_41310cztM0_level2.fits | modeM0/AS1A12_025T08_9000005644_41310cztM0_level2_quad_clean.evt |
| Size (bytes) | 165,199,680 | 27,437,760 |
| Size | 157.5 MB | 26.2 MB |
| Events in quadrant A | 1,069,050 | 201,176 |
| Events in quadrant B | 990,565 | 201,544 |
| Events in quadrant C | 1,097,968 | 180,819 |
| Events in quadrant D | 2,812,401 | 113,572 |
| Mode SS | |||
|---|---|---|---|
| Quadrant | BADHDUFLAG | Total packets | Discarded packets |
| A | 0 | 36 | 0 |
| B | 0 | 36 | 0 |
| C | 0 | 36 | 0 |
| D | 0 | 36 | 0 |
| Mode M9 | |||
|---|---|---|---|
| Quadrant | BADHDUFLAG | Total packets | Discarded packets |
| A | 0 | 13 | 0 |
| B | 0 | 13 | 0 |
| C | 0 | 13 | 0 |
| D | 0 | 14 | 0 |
| Mode M0 | |||
|---|---|---|---|
| Quadrant | BADHDUFLAG | Total packets | Discarded packets |
| A | 0 | 4349 | 1 |
| B | 0 | 4244 | 1 |
| C | 0 | 4480 | 1 |
| D | 0 | 9660 | 1 |
| Quadrant | Total seconds | Saturated seconds | Saturation percentage |
|---|---|---|---|
| A | 1833 | 7 | 0.381888% |
| B | 1833 | 15 | 0.818331% |
| C | 1833 | 93 | 5.073650% |
| D | 1833 | 743 | 40.534643% |
Noise dominated data is calculated using 1-second bins in cleaned event files. If a bin has >2000 counts, and if more than 50% of those come from <1% of pixels, then it is considered to be noise-dominated and hence unusable.
| Quadrant | # 1 sec bins | Bins with >0 counts | Bins with >2000 counts | High rate bins dominated by noise | Noise dominated (total time) | Noise dominated (detector-on time) | Marked lightcurve |
|---|---|---|---|---|---|---|---|
| A | 1833 | 1833 | 3 | 3 | 0.16% | 0.16% | 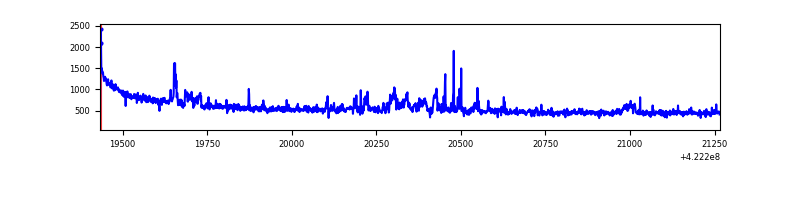 |
| B | 1833 | 1833 | 11 | 11 | 0.60% | 0.60% | 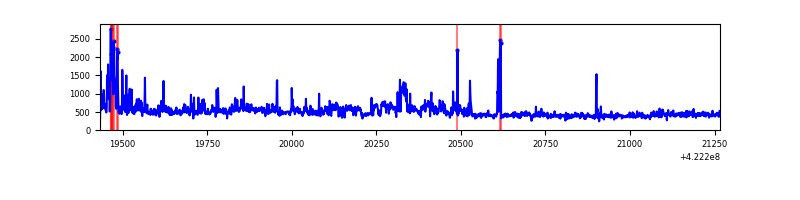 |
| C | 1833 | 1833 | 92 | 92 | 5.02% | 5.02% | 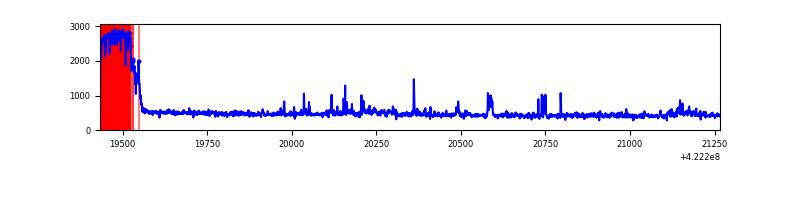 |
| D | 1833 | 1833 | 789 | 789 | 43.04% | 43.04% | 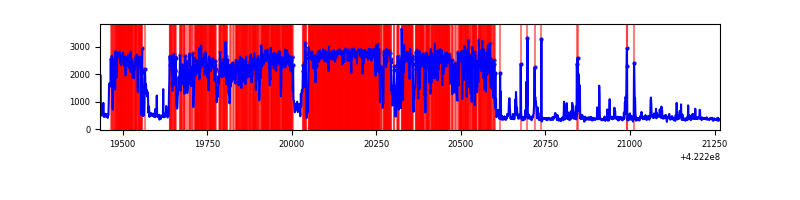 |
Top three noisy pixels from each quadrant. If the there are fewer than three noisy pixels in the level2.evt file, extra rows are filled as -1
| Pixel properties | Quadrant properties | ||||||
|---|---|---|---|---|---|---|---|
| Quadrant | DetID | PixID | Counts | Sigma | Mean | Median | Sigma |
| A | 10 | 83 | 218812 | 5235.69 | 193 | 189 | 41.8 |
| A | 12 | 189 | 56687 | 1353.04 | 193 | 189 | 41.8 |
| A | 13 | 248 | 20481 | 485.96 | 193 | 189 | 41.8 |
| B | 5 | 255 | 98362 | 2511.85 | 191 | 186 | 39.1 |
| B | 7 | 202 | 75194 | 1919.1 | 191 | 186 | 39.1 |
| B | 0 | 229 | 27851 | 707.81 | 191 | 186 | 39.1 |
| C | 0 | 10 | 271941 | 6368.23 | 176 | 177 | 42.7 |
| C | 15 | 214 | 77665 | 1815.77 | 176 | 177 | 42.7 |
| C | 9 | 54 | 40821 | 952.41 | 176 | 177 | 42.7 |
| D | 2 | 249 | 2096657 | 52497.18 | 156 | 152 | 39.9 |
| D | 1 | 52 | 30618 | 762.88 | 156 | 152 | 39.9 |
| D | 12 | 233 | 27707 | 689.99 | 156 | 152 | 39.9 |
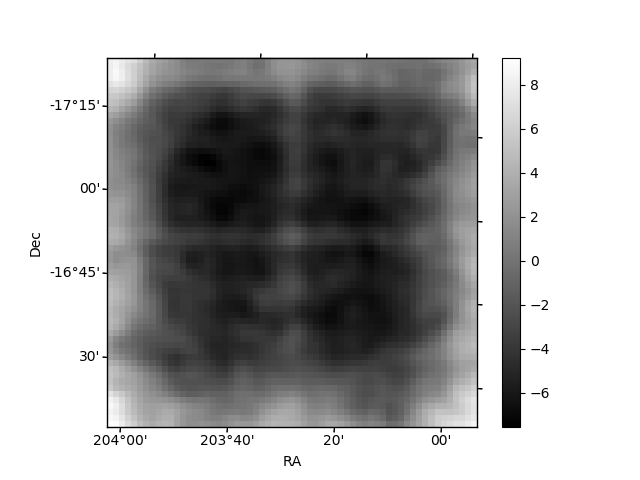
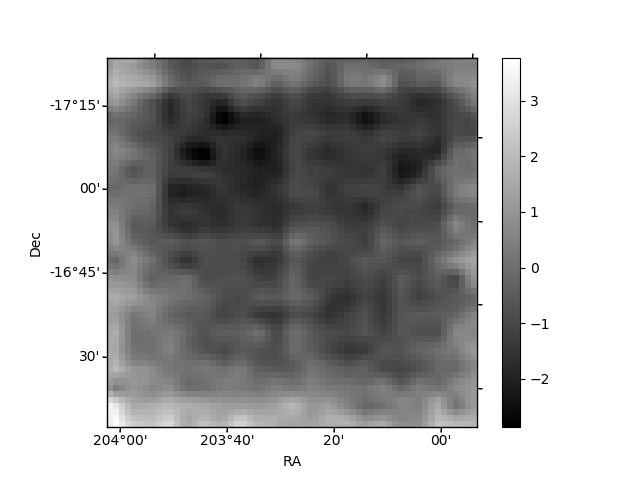
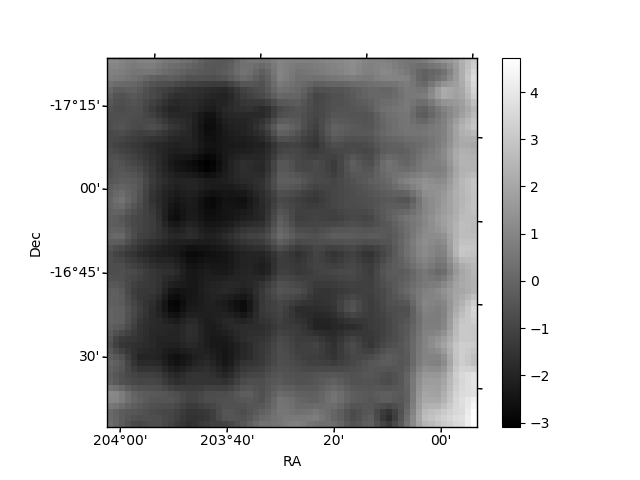
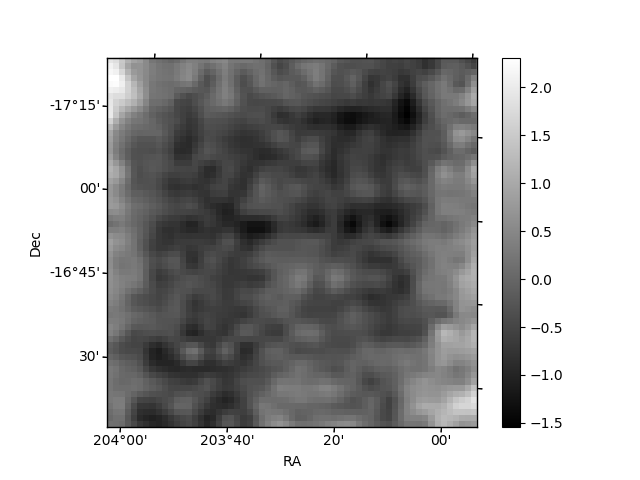
Histogram calculated using DETX and DETY for each event in the final _common_clean file
| Quadrant A | 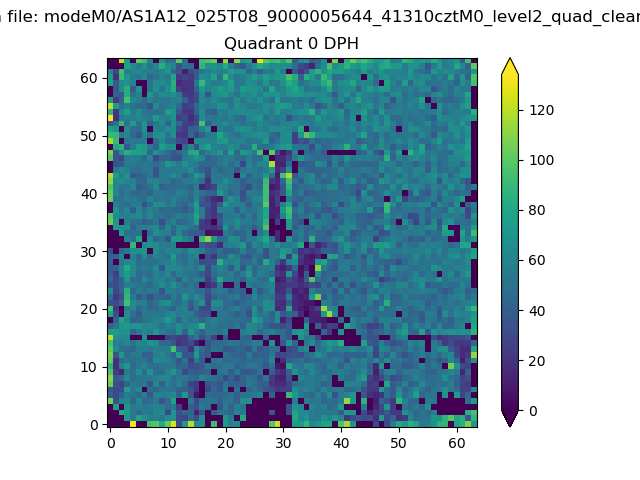 |
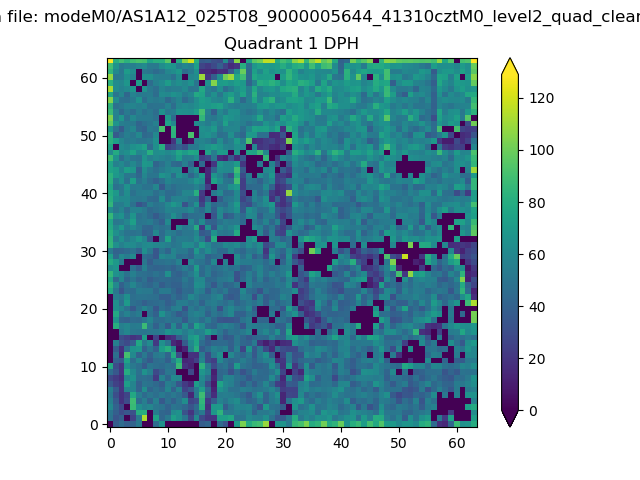 |
Quadrant B |
|---|---|---|---|
| Quadrant D | 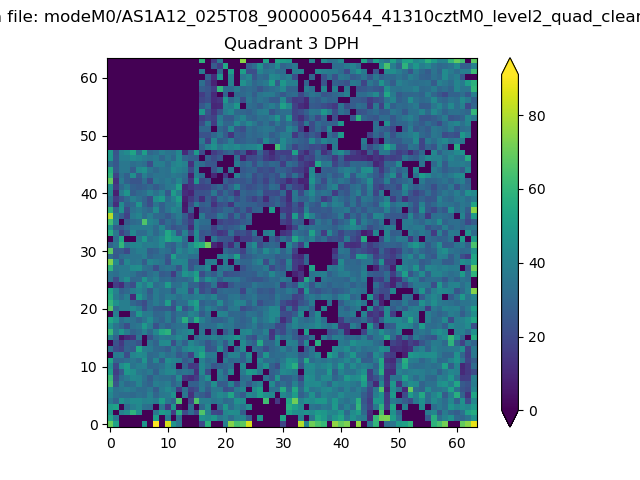 |
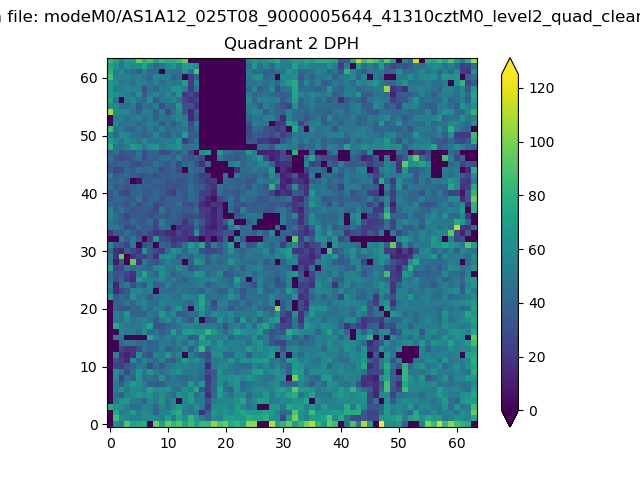 |
Quadrant C |
| Plot type | Count rate plots | Images |
|---|---|---|
| Comparison with Poisson distribution Blue bars denote a histogram of data divided into 1 sec bins. Red curve is a Poisson curve with rate = median count rate of data. |
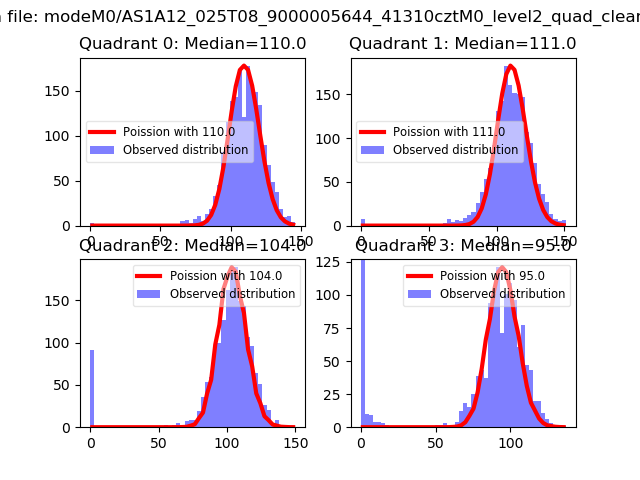 |
 |
| Quadrant-wise count rates Data is divided into 100 sec bins |
 |
|
| Module-wise count rates for Quadrant A Data is divided into 100 sec bins |
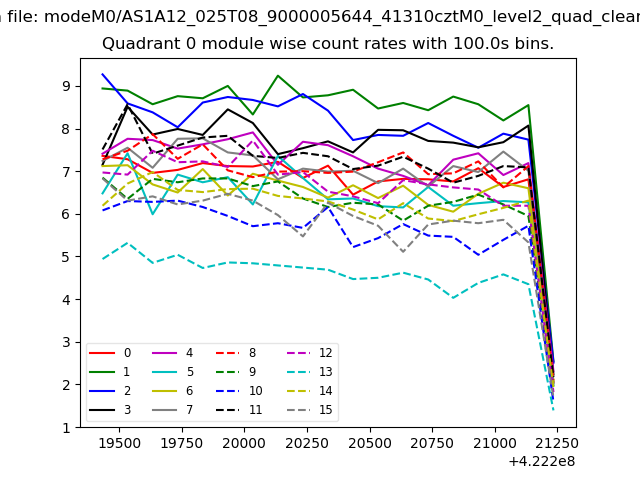 |
 |
| Module-wise count rates for Quadrant B Data is divided into 100 sec bins |
 |
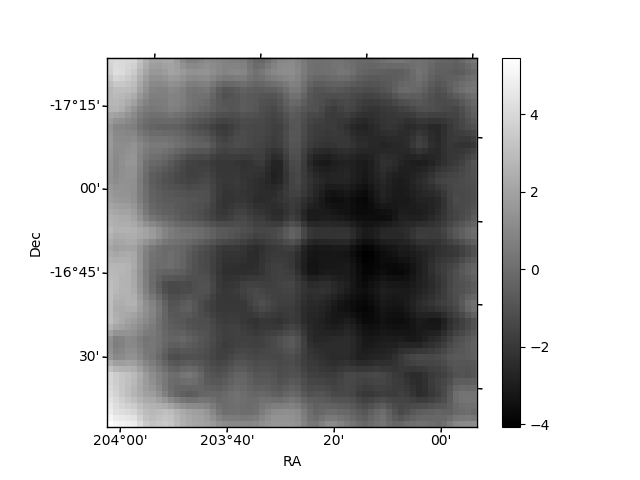 |
| Module-wise count rates for Quadrant C Data is divided into 100 sec bins |
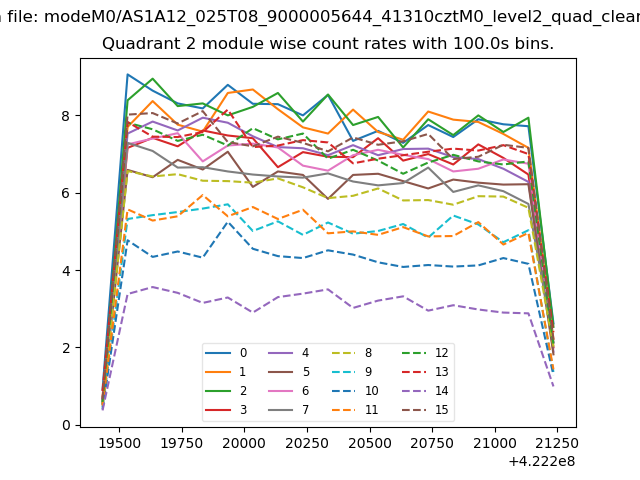 |
 |
| Module-wise count rates for Quadrant D Data is divided into 100 sec bins |
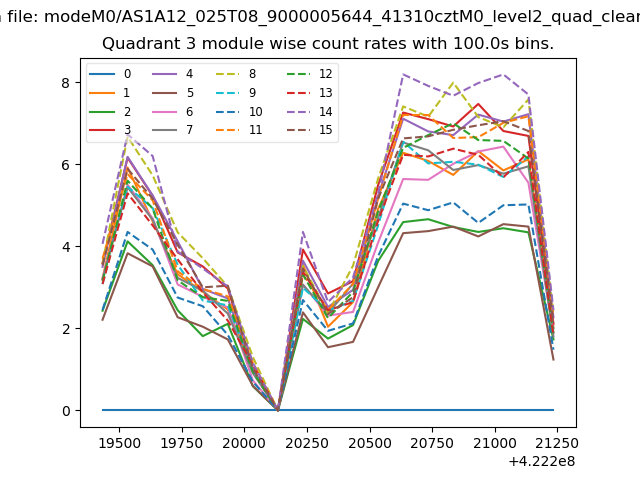 |
 |
| Parameter | Plot |
|---|---|
| CZT HV Monitor | 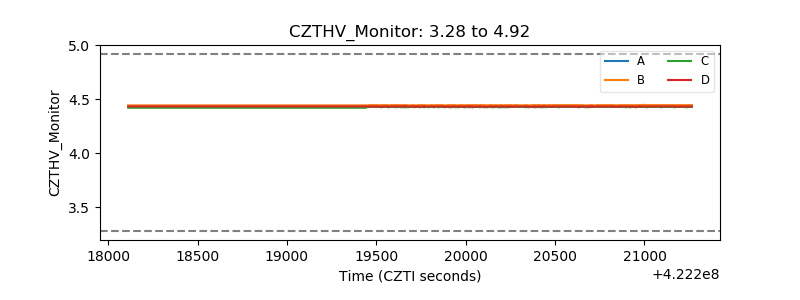 |
| D_VDD | 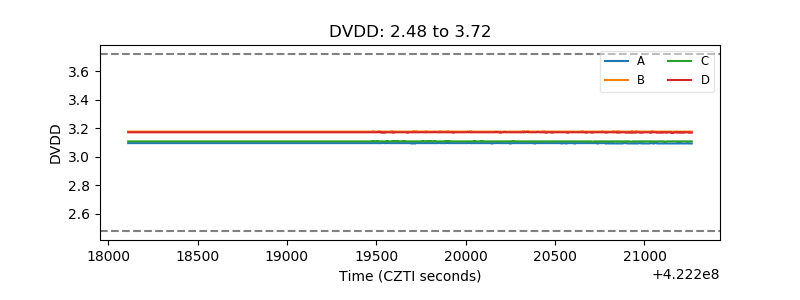 |
| Temperature 1 | 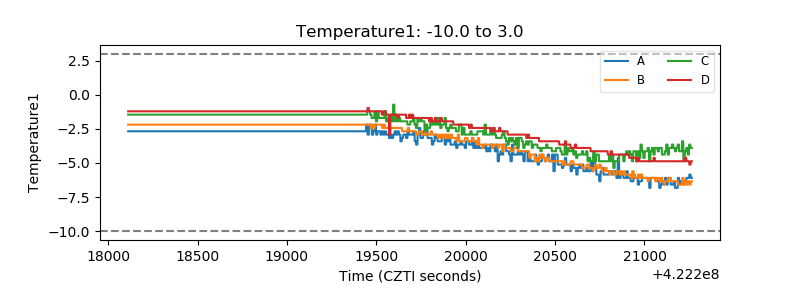 |
| Veto HV Monitor | 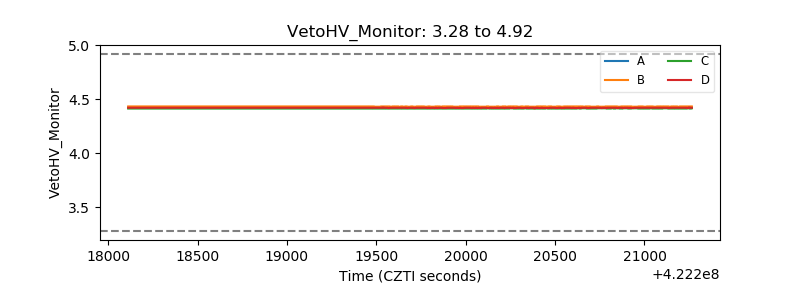 |
| Veto LLD | 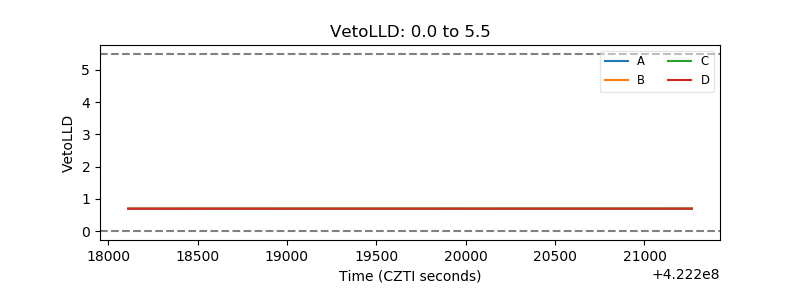 |
| Alpha Counter | 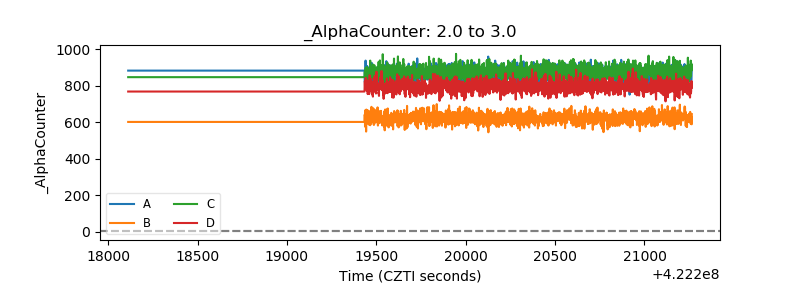 |
| _CPM_Rate | 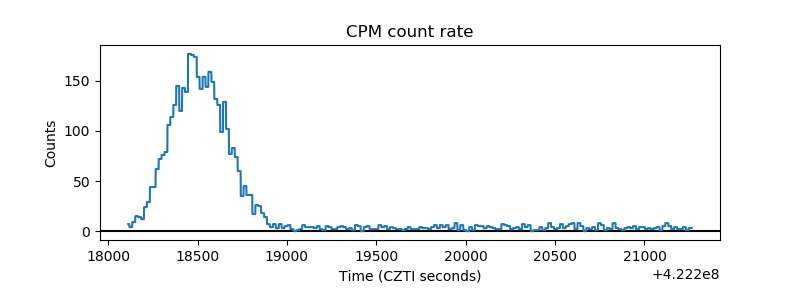 |
| CZT Counter | 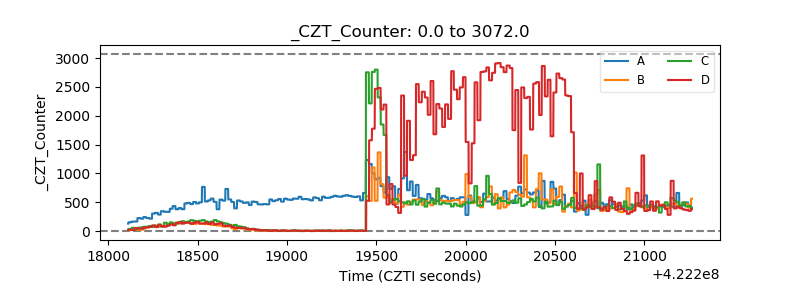 |
| +2.5 Volts monitor | 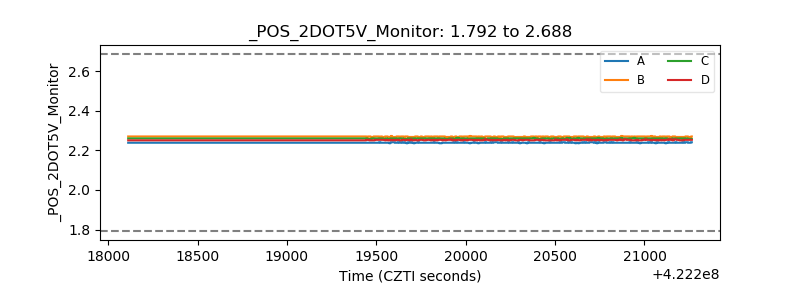 |
| +5 Volts monitor | 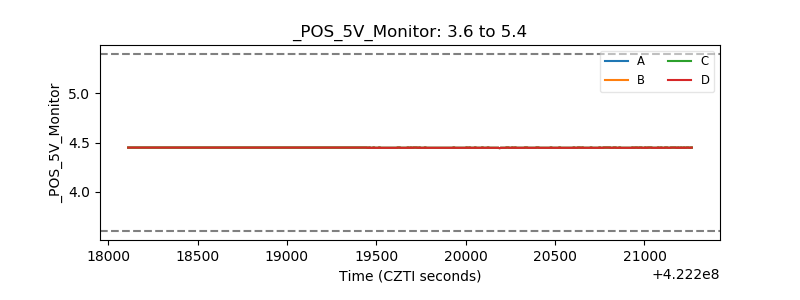 |
| _ROLL_ROT | 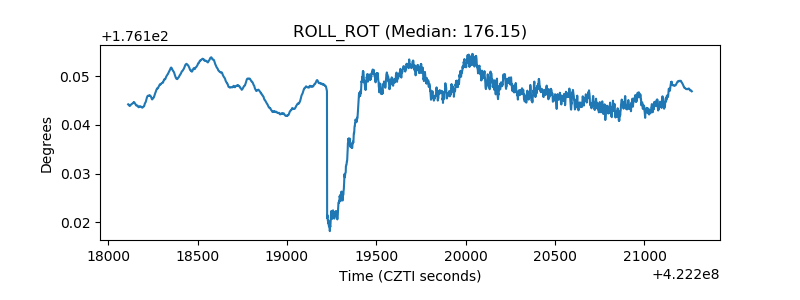 |
| _Roll_DEC | 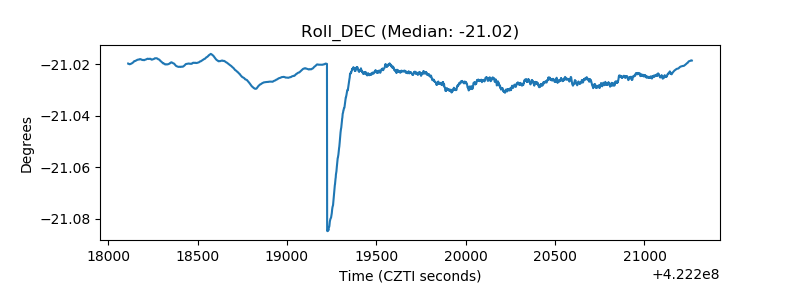 |
| _Roll_RA | 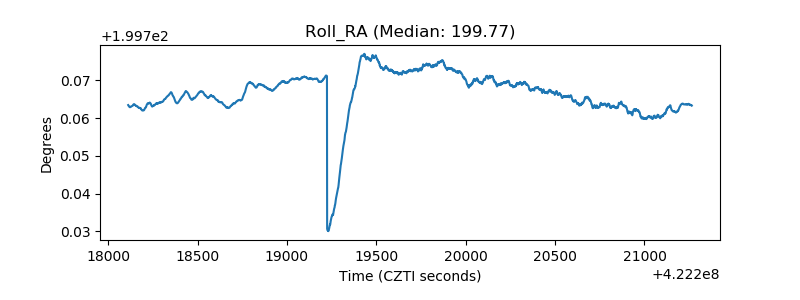 |
| Veto Counter | 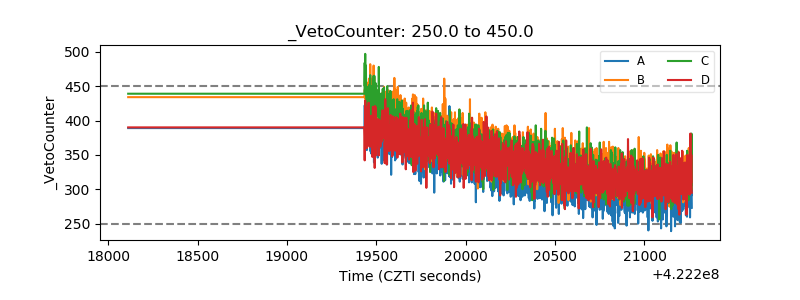 |