| Param | Original file | Final file |
|---|---|---|
| Filename | modeM0/AS1A12_025T14_9000005646_41310cztM0_level2.fits | modeM0/AS1A12_025T14_9000005646_41310cztM0_level2_quad_clean.evt |
| Size (bytes) | 203,745,600 | 51,439,680 |
| Size | 194.3 MB | 49.1 MB |
| Events in quadrant A | 1,712,691 | 344,972 |
| Events in quadrant B | 1,750,607 | 357,746 |
| Events in quadrant C | 1,820,037 | 326,313 |
| Events in quadrant D | 2,010,950 | 303,927 |
| Mode SS | |||
|---|---|---|---|
| Quadrant | BADHDUFLAG | Total packets | Discarded packets |
| A | 0 | 64 | 0 |
| B | 0 | 64 | 0 |
| C | 0 | 64 | 0 |
| D | 0 | 64 | 0 |
| Mode M0 | |||
|---|---|---|---|
| Quadrant | BADHDUFLAG | Total packets | Discarded packets |
| A | 0 | 6912 | 2 |
| B | 0 | 7334 | 1 |
| C | 0 | 7252 | 1 |
| D | 0 | 8165 | 1 |
| Mode M9 | |||
|---|---|---|---|
| Quadrant | BADHDUFLAG | Total packets | Discarded packets |
| A | 0 | 16 | 0 |
| B | 0 | 16 | 0 |
| C | 0 | 16 | 0 |
| D | 0 | 16 | 0 |
| Quadrant | Total seconds | Saturated seconds | Saturation percentage |
|---|---|---|---|
| A | 3162 | 10 | 0.316256% |
| B | 3162 | 32 | 1.012018% |
| C | 3162 | 116 | 3.668564% |
| D | 3162 | 141 | 4.459203% |
Noise dominated data is calculated using 1-second bins in cleaned event files. If a bin has >2000 counts, and if more than 50% of those come from <1% of pixels, then it is considered to be noise-dominated and hence unusable.
| Quadrant | # 1 sec bins | Bins with >0 counts | Bins with >2000 counts | High rate bins dominated by noise | Noise dominated (total time) | Noise dominated (detector-on time) | Marked lightcurve |
|---|---|---|---|---|---|---|---|
| A | 4774 | 3163 | 2 | 2 | 0.04% | 0.06% | 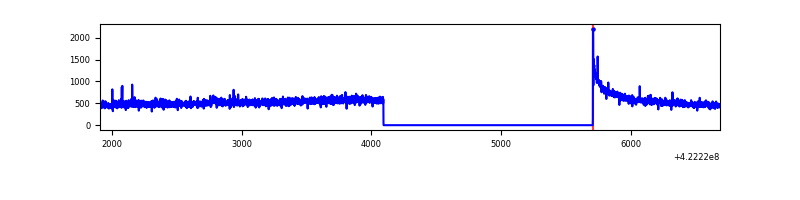 |
| B | 4774 | 3163 | 21 | 21 | 0.44% | 0.66% | 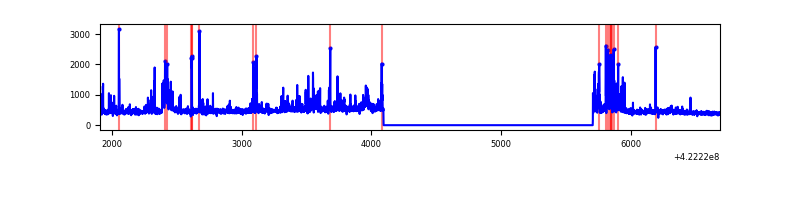 |
| C | 4774 | 3163 | 109 | 109 | 2.28% | 3.45% | 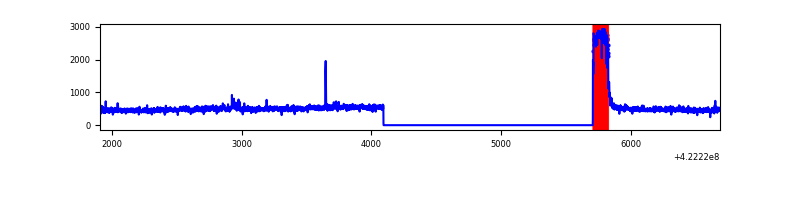 |
| D | 4774 | 3163 | 121 | 121 | 2.53% | 3.83% | 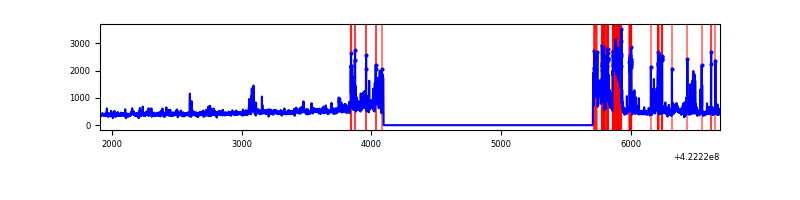 |
Top three noisy pixels from each quadrant. If the there are fewer than three noisy pixels in the level2.evt file, extra rows are filled as -1
| Pixel properties | Quadrant properties | ||||||
|---|---|---|---|---|---|---|---|
| Quadrant | DetID | PixID | Counts | Sigma | Mean | Median | Sigma |
| A | 10 | 83 | 281226 | 3714.19 | 358 | 351 | 75.6 |
| A | 12 | 189 | 33663 | 440.51 | 358 | 351 | 75.6 |
| A | 13 | 254 | 4538 | 55.37 | 358 | 351 | 75.6 |
| B | 5 | 255 | 328680 | 4626.99 | 355 | 344 | 71.0 |
| B | 7 | 202 | 12044 | 164.88 | 355 | 344 | 71.0 |
| B | 0 | 245 | 9625 | 130.79 | 355 | 344 | 71.0 |
| C | 0 | 10 | 334954 | 4137.62 | 339 | 341 | 80.9 |
| C | 15 | 214 | 131506 | 1621.91 | 339 | 341 | 80.9 |
| C | 7 | 220 | 15833 | 191.56 | 339 | 341 | 80.9 |
| D | 2 | 249 | 385463 | 4458.79 | 342 | 330 | 86.4 |
| D | 5 | 222 | 203966 | 2357.55 | 342 | 330 | 86.4 |
| D | 13 | 249 | 52296 | 601.62 | 342 | 330 | 86.4 |
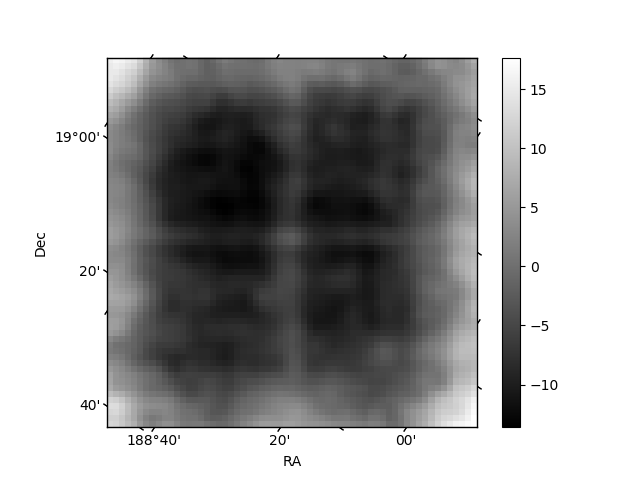
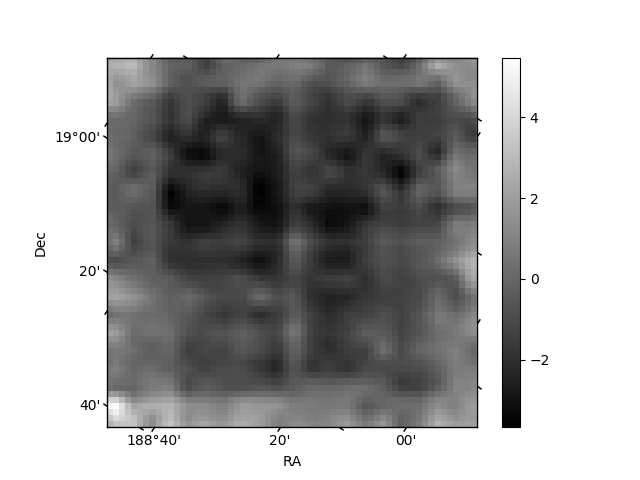
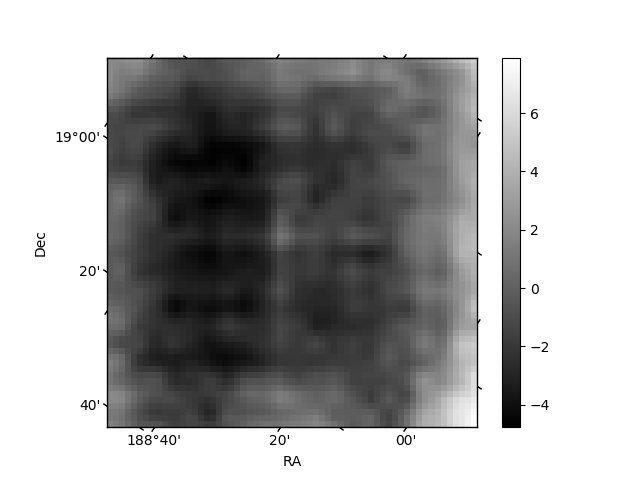
Histogram calculated using DETX and DETY for each event in the final _common_clean file
| Quadrant A | 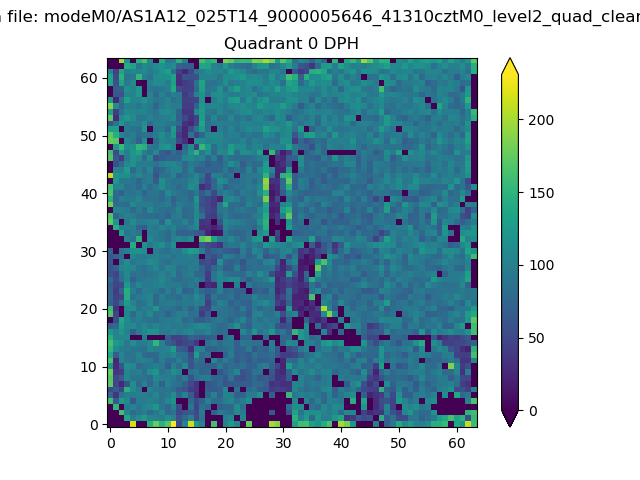 |
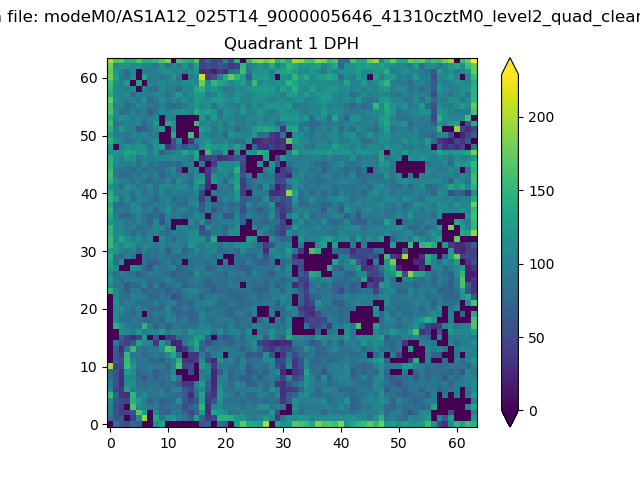 |
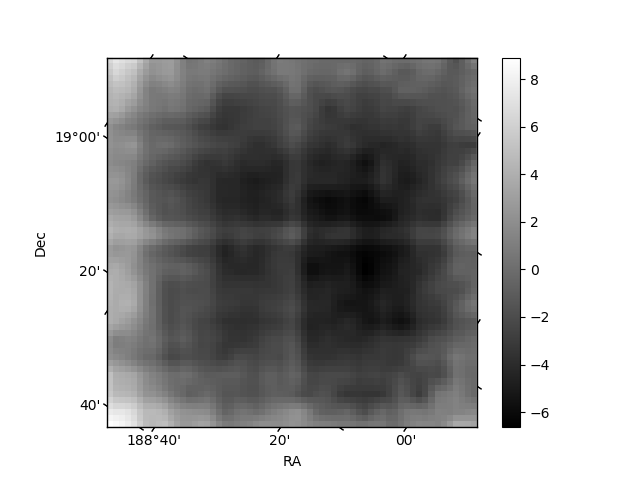
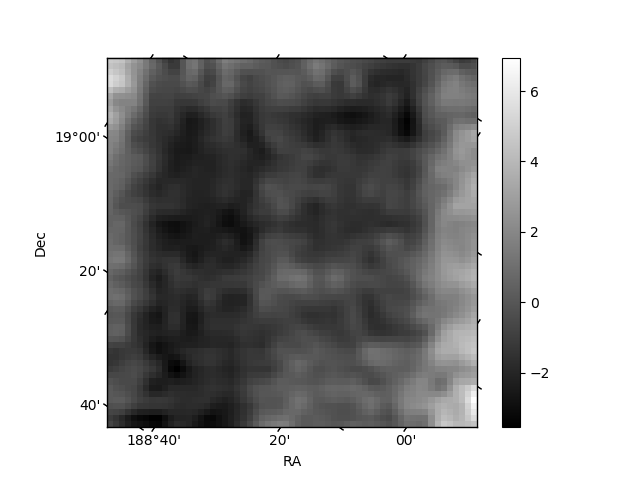
Quadrant B |
|---|---|---|---|
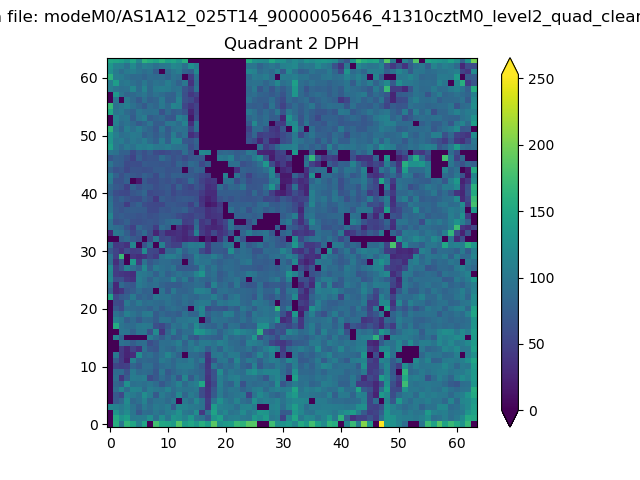
| Quadrant D | 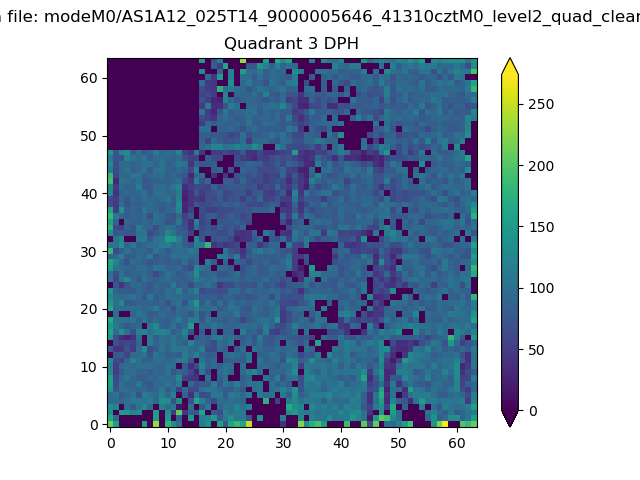 |
 |
Quadrant C |
| Plot type | Count rate plots | Images |
|---|---|---|
| Comparison with Poisson distribution Blue bars denote a histogram of data divided into 1 sec bins. Red curve is a Poisson curve with rate = median count rate of data. |
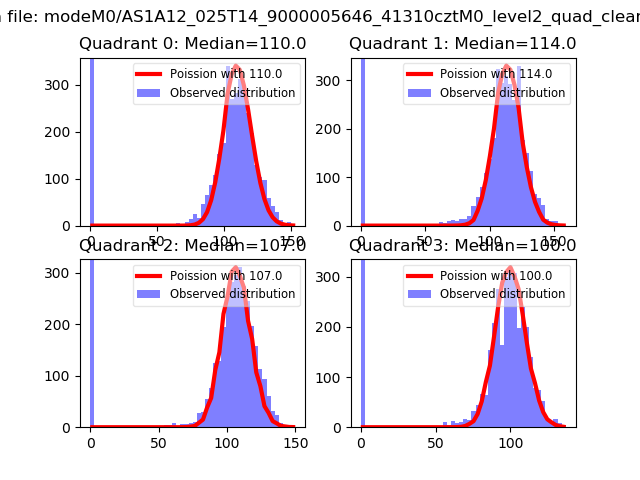 |
 |
| Quadrant-wise count rates Data is divided into 100 sec bins |
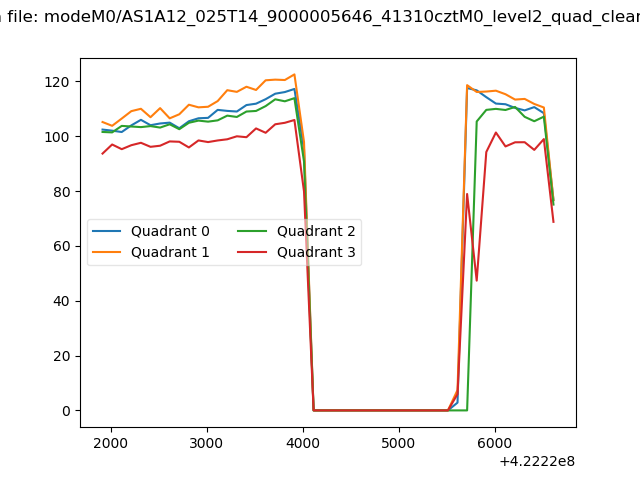 |
|
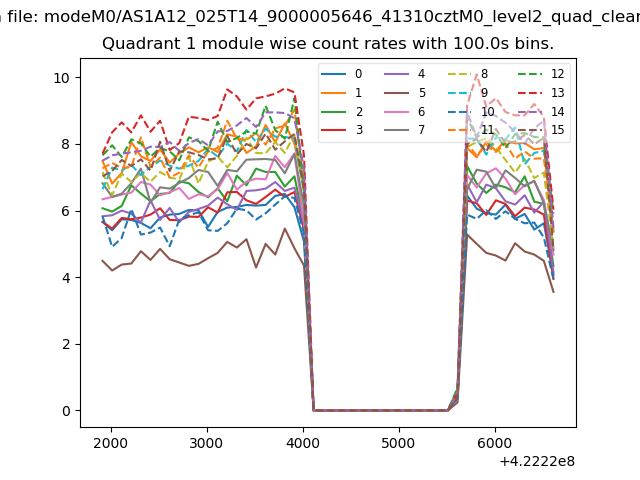
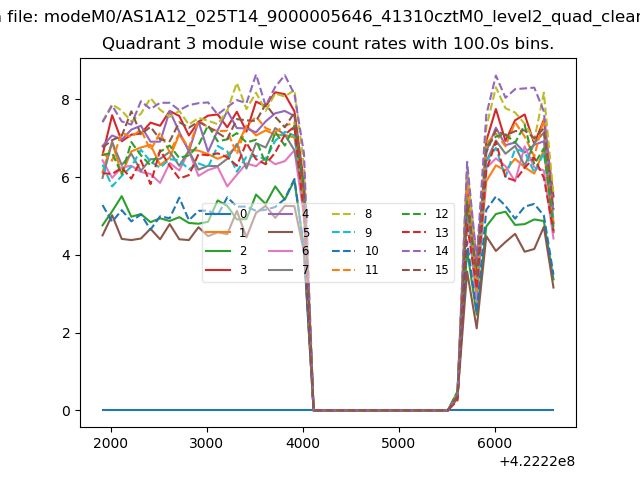
| Module-wise count rates for Quadrant A Data is divided into 100 sec bins |
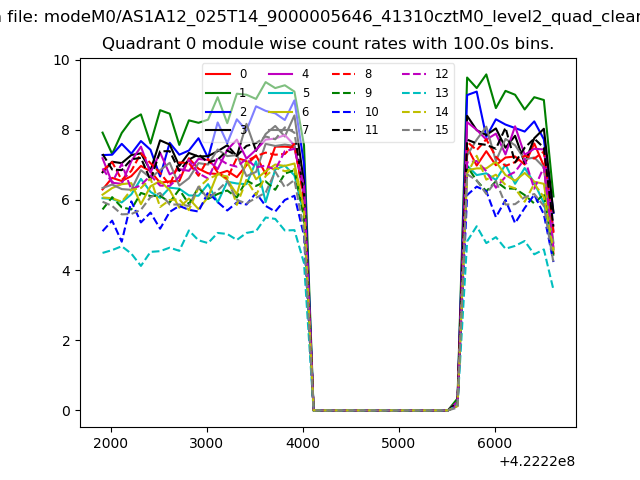 |
 |
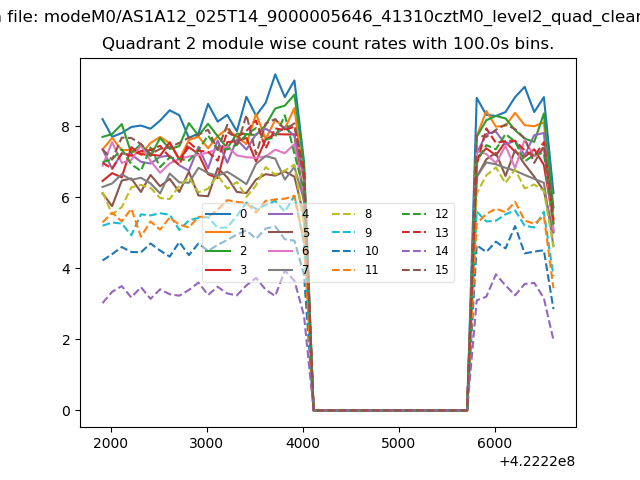
| Module-wise count rates for Quadrant B Data is divided into 100 sec bins |
 |
 |
| Module-wise count rates for Quadrant C Data is divided into 100 sec bins |
 |
 |
| Module-wise count rates for Quadrant D Data is divided into 100 sec bins |
 |
 |
| Parameter | Plot |
|---|---|
| CZT HV Monitor | 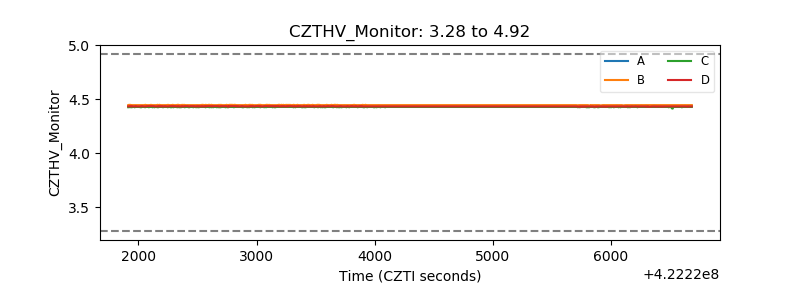 |
| D_VDD | 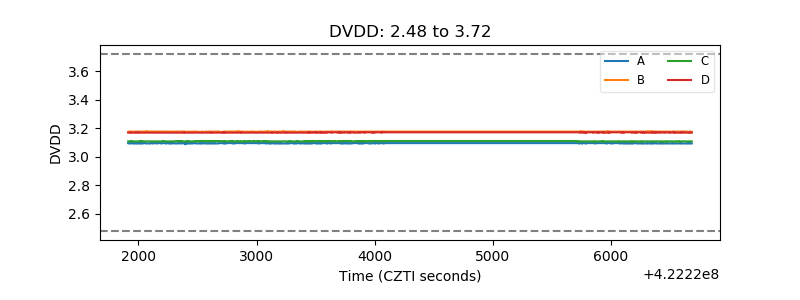 |
| Temperature 1 | 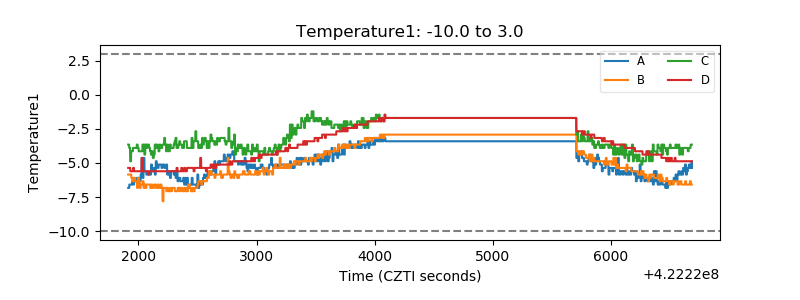 |
| Veto HV Monitor | 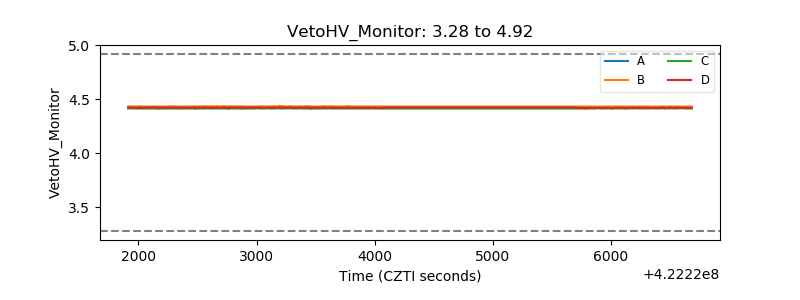 |
| Veto LLD | 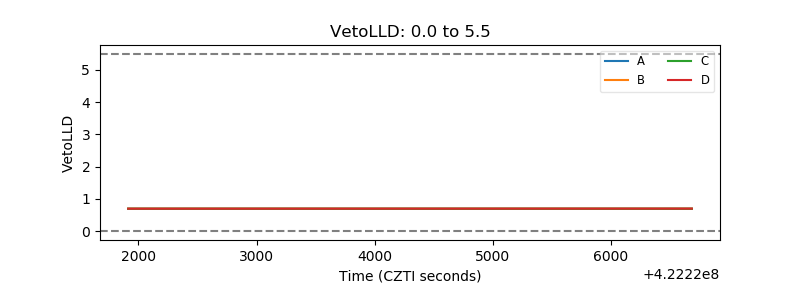 |
| Alpha Counter | 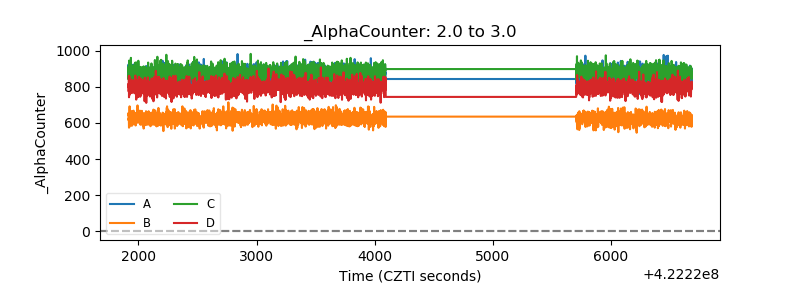 |
| _CPM_Rate | 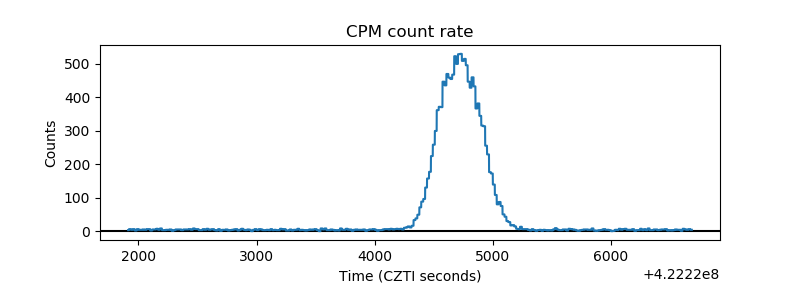 |
| CZT Counter | 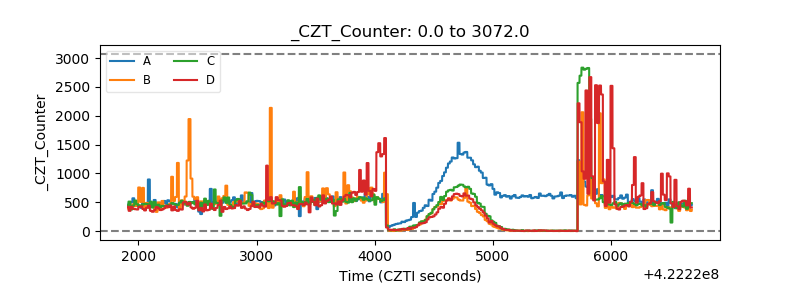 |
| +2.5 Volts monitor |  |
| +5 Volts monitor | 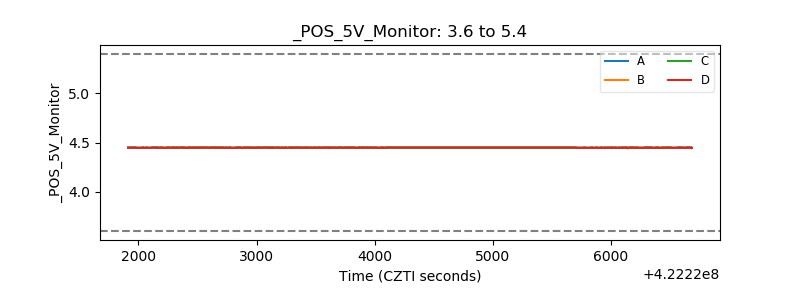 |
| _ROLL_ROT | 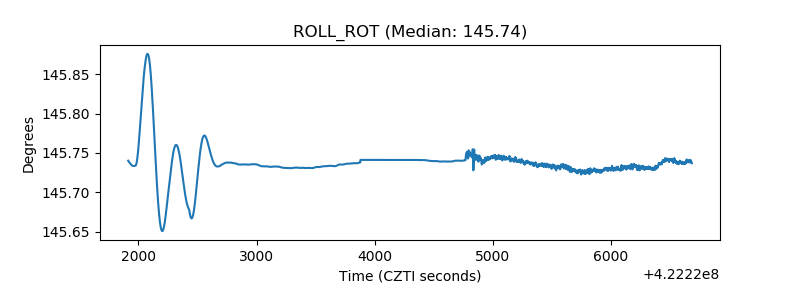 |
| _Roll_DEC | 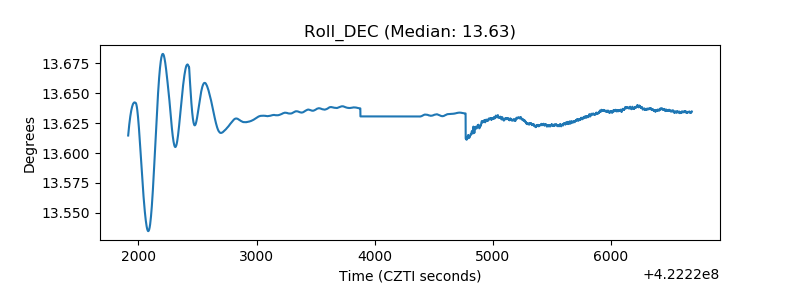 |
| _Roll_RA | 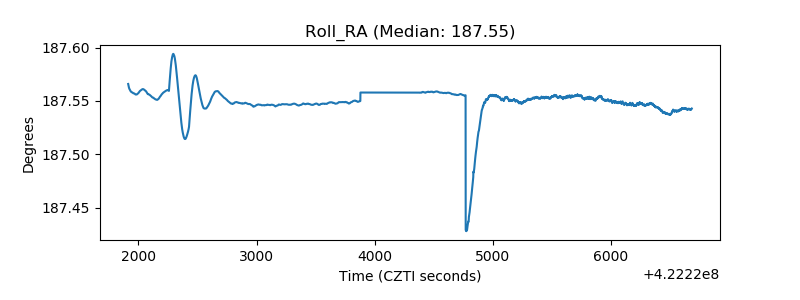 |
| Veto Counter | 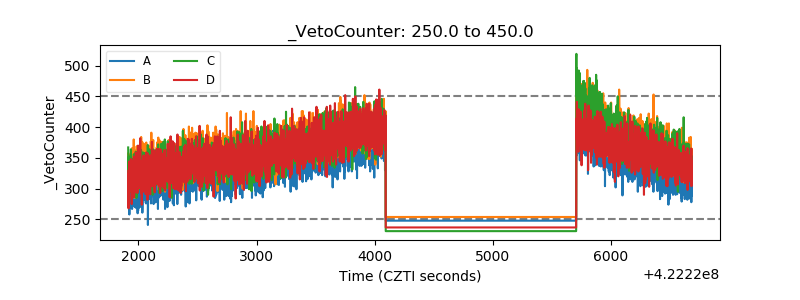 |