| Param | Original file | Final file |
|---|---|---|
| Filename | modeM0/AS1A12_025T14_9000005646_41312cztM0_level2.fits | modeM0/AS1A12_025T14_9000005646_41312cztM0_level2_quad_clean.evt |
| Size (bytes) | 334,232,640 | 86,218,560 |
| Size | 318.7 MB | 82.2 MB |
| Events in quadrant A | 2,847,964 | 584,588 |
| Events in quadrant B | 2,491,601 | 602,333 |
| Events in quadrant C | 3,197,572 | 544,403 |
| Events in quadrant D | 3,418,635 | 504,840 |
| Mode SS | |||
|---|---|---|---|
| Quadrant | BADHDUFLAG | Total packets | Discarded packets |
| A | 0 | 110 | 0 |
| B | 0 | 110 | 0 |
| C | 0 | 110 | 0 |
| D | 0 | 110 | 0 |
| Mode M0 | |||
|---|---|---|---|
| Quadrant | BADHDUFLAG | Total packets | Discarded packets |
| A | 0 | 11681 | 3 |
| B | 0 | 11170 | 2 |
| C | 0 | 12783 | 2 |
| D | 0 | 13997 | 2 |
| Mode M9 | |||
|---|---|---|---|
| Quadrant | BADHDUFLAG | Total packets | Discarded packets |
| A | 0 | 29 | 0 |
| B | 0 | 29 | 0 |
| C | 0 | 29 | 0 |
| D | 0 | 30 | 0 |
| Quadrant | Total seconds | Saturated seconds | Saturation percentage |
|---|---|---|---|
| A | 5344 | 15 | 0.280689% |
| B | 5344 | 11 | 0.205838% |
| C | 5344 | 254 | 4.752994% |
| D | 5344 | 286 | 5.351796% |
Noise dominated data is calculated using 1-second bins in cleaned event files. If a bin has >2000 counts, and if more than 50% of those come from <1% of pixels, then it is considered to be noise-dominated and hence unusable.
| Quadrant | # 1 sec bins | Bins with >0 counts | Bins with >2000 counts | High rate bins dominated by noise | Noise dominated (total time) | Noise dominated (detector-on time) | Marked lightcurve |
|---|---|---|---|---|---|---|---|
| A | 7077 | 5345 | 4 | 4 | 0.06% | 0.07% | 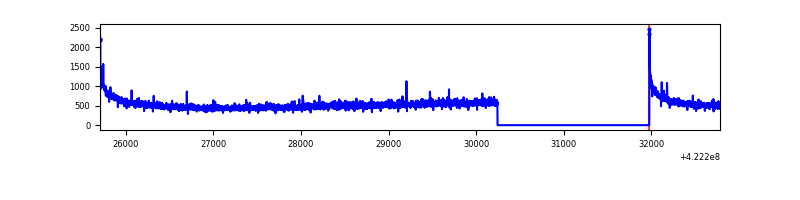 |
| B | 7077 | 5345 | 12 | 12 | 0.17% | 0.22% | 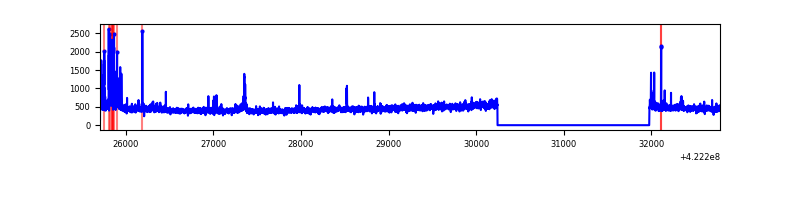 |
| C | 7077 | 5345 | 250 | 250 | 3.53% | 4.68% | 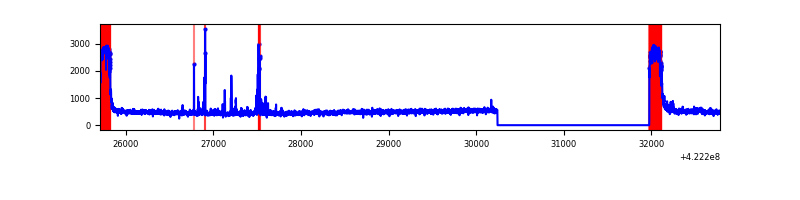 |
| D | 7077 | 5345 | 262 | 262 | 3.70% | 4.90% | 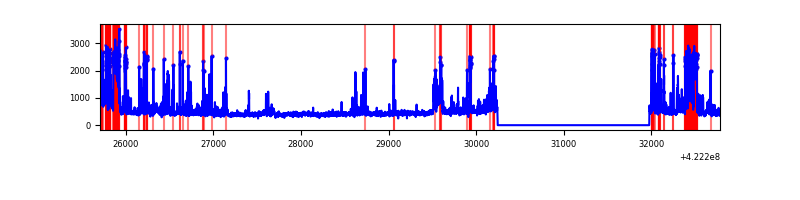 |
Top three noisy pixels from each quadrant. If the there are fewer than three noisy pixels in the level2.evt file, extra rows are filled as -1
| Pixel properties | Quadrant properties | ||||||
|---|---|---|---|---|---|---|---|
| Quadrant | DetID | PixID | Counts | Sigma | Mean | Median | Sigma |
| A | 10 | 83 | 507880 | 4202.23 | 584 | 572 | 120.7 |
| A | 12 | 189 | 53077 | 434.92 | 584 | 572 | 120.7 |
| A | 2 | 79 | 18182 | 145.87 | 584 | 572 | 120.7 |
| B | 5 | 255 | 146654 | 1284.88 | 581 | 566 | 113.7 |
| B | 0 | 245 | 24599 | 211.38 | 581 | 566 | 113.7 |
| B | 0 | 229 | 19107 | 163.07 | 581 | 566 | 113.7 |
| C | 0 | 10 | 714894 | 5465.47 | 550 | 553 | 130.7 |
| C | 15 | 214 | 221678 | 1691.84 | 550 | 553 | 130.7 |
| C | 15 | 159 | 86706 | 659.16 | 550 | 553 | 130.7 |
| D | 2 | 249 | 783054 | 5692.11 | 554 | 537 | 137.5 |
| D | 1 | 52 | 166507 | 1207.28 | 554 | 537 | 137.5 |
| D | 13 | 249 | 123685 | 895.79 | 554 | 537 | 137.5 |
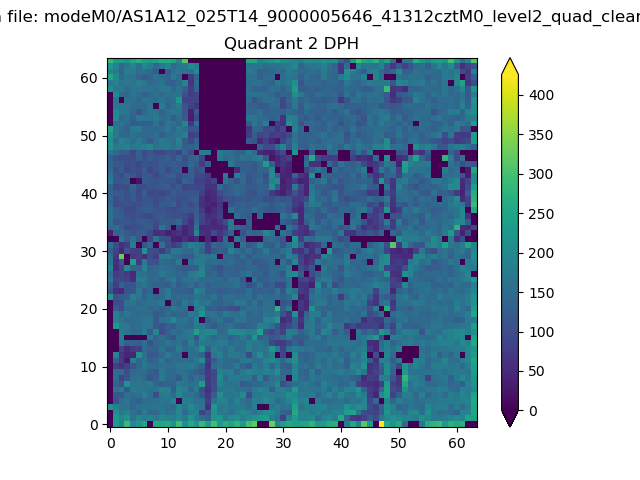
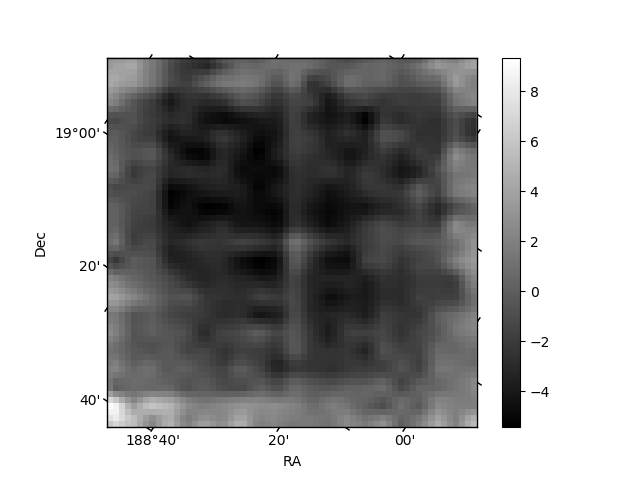
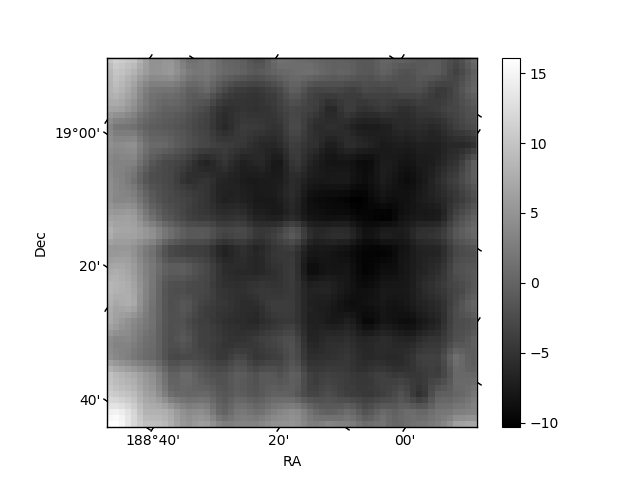
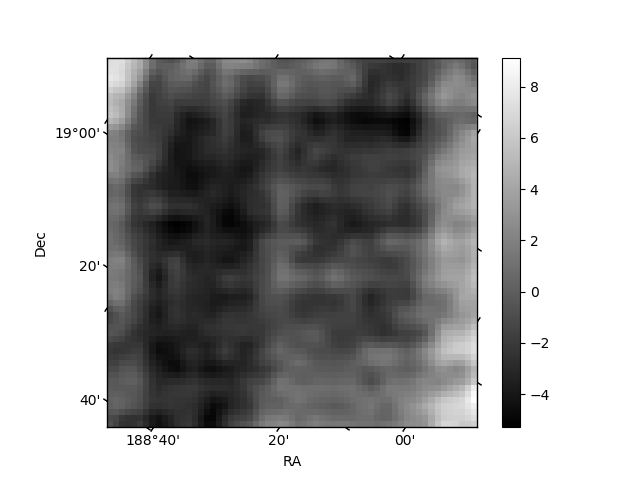
Histogram calculated using DETX and DETY for each event in the final _common_clean file
| Quadrant A | 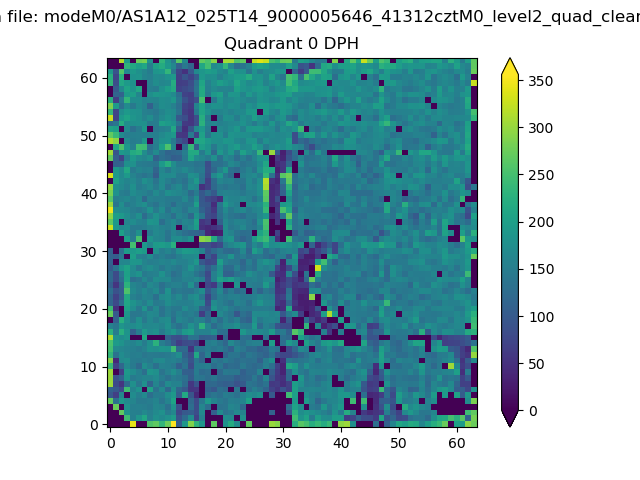 |
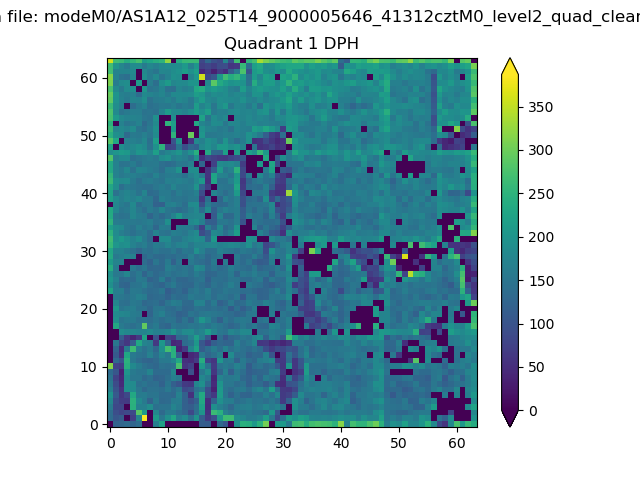 |
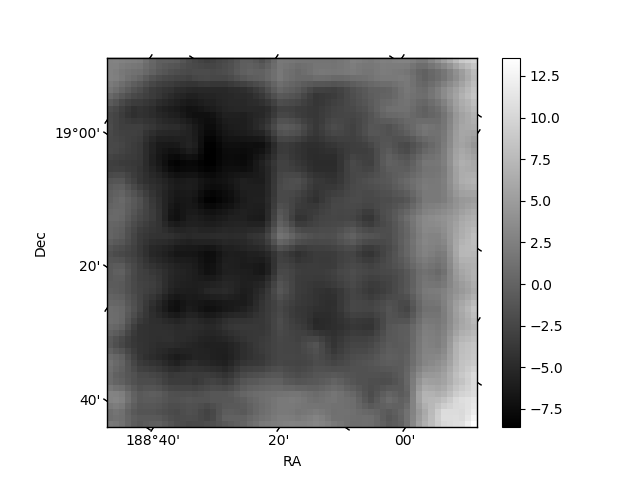
Quadrant B |
|---|---|---|---|
| Quadrant D | 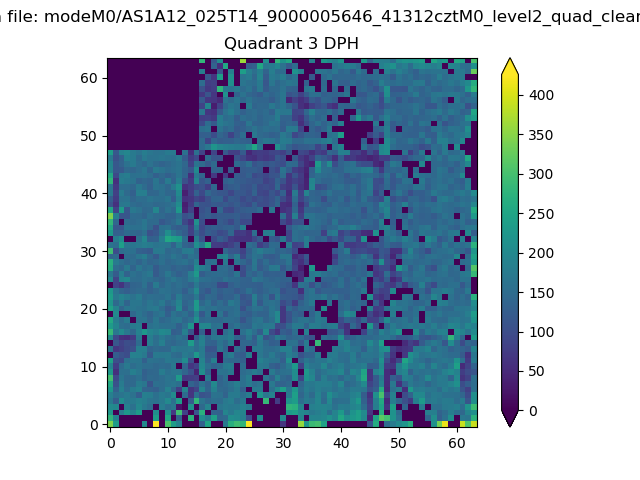 |
 |
Quadrant C |
| Plot type | Count rate plots | Images |
|---|---|---|
| Comparison with Poisson distribution Blue bars denote a histogram of data divided into 1 sec bins. Red curve is a Poisson curve with rate = median count rate of data. |
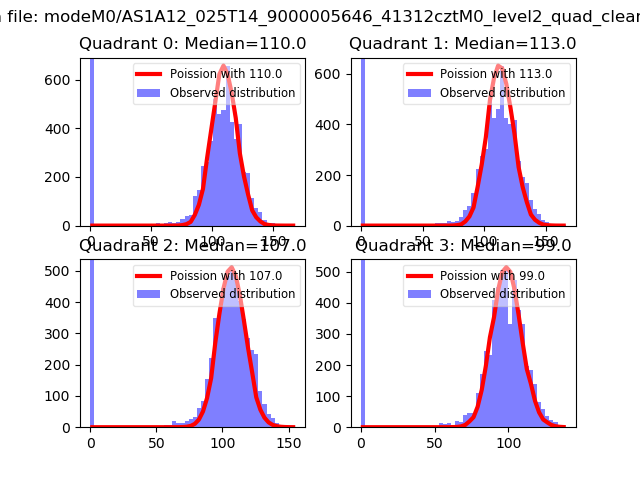 |
 |
| Quadrant-wise count rates Data is divided into 100 sec bins |
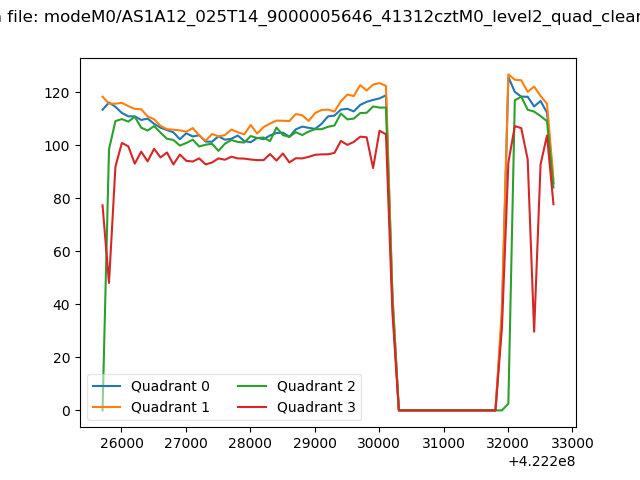 |
|
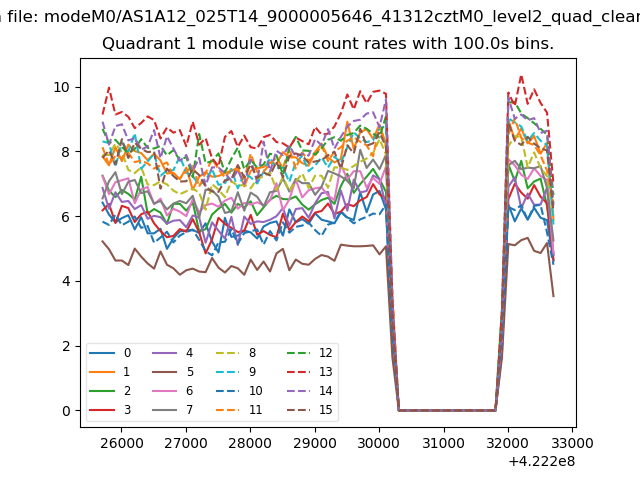
| Module-wise count rates for Quadrant A Data is divided into 100 sec bins |
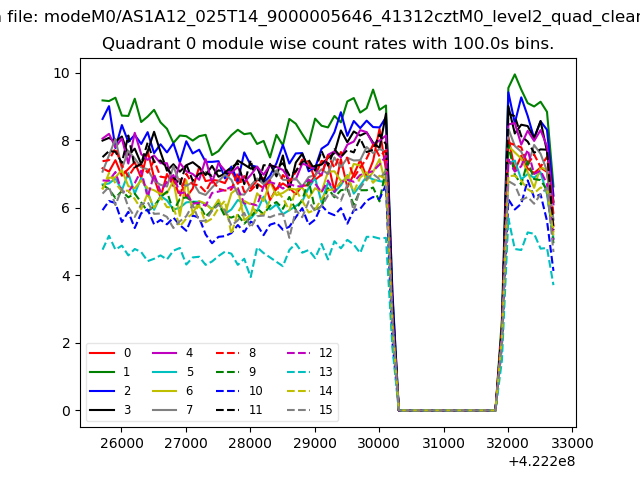 |
 |
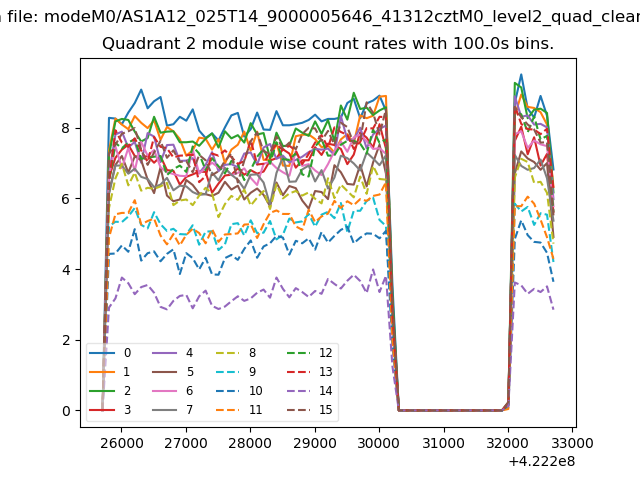
| Module-wise count rates for Quadrant B Data is divided into 100 sec bins |
 |
 |
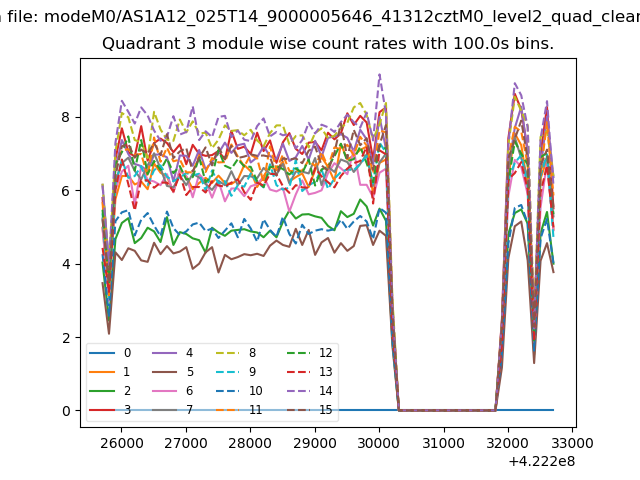
| Module-wise count rates for Quadrant C Data is divided into 100 sec bins |
 |
 |
| Module-wise count rates for Quadrant D Data is divided into 100 sec bins |
 |
 |
| Parameter | Plot |
|---|---|
| CZT HV Monitor | 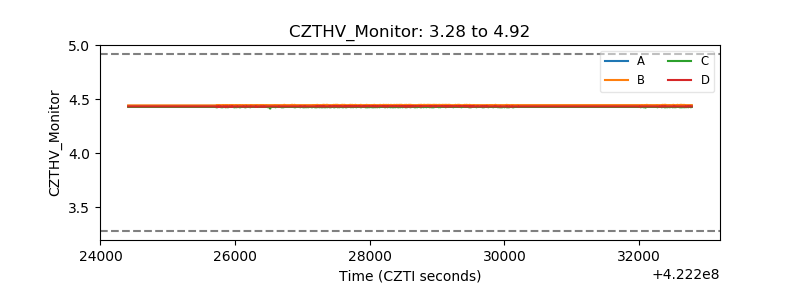 |
| D_VDD | 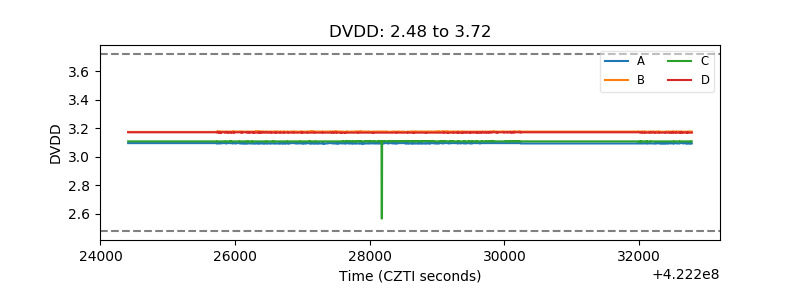 |
| Temperature 1 | 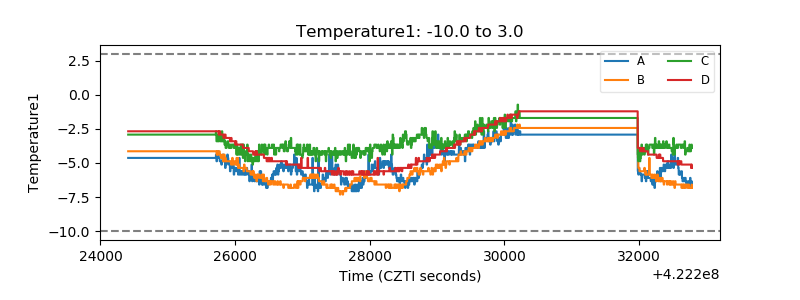 |
| Veto HV Monitor | 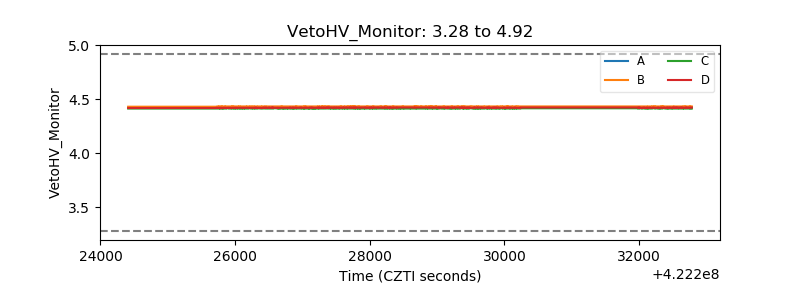 |
| Veto LLD | 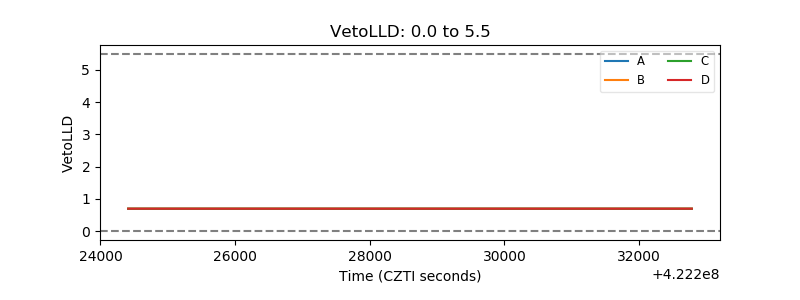 |
| Alpha Counter | 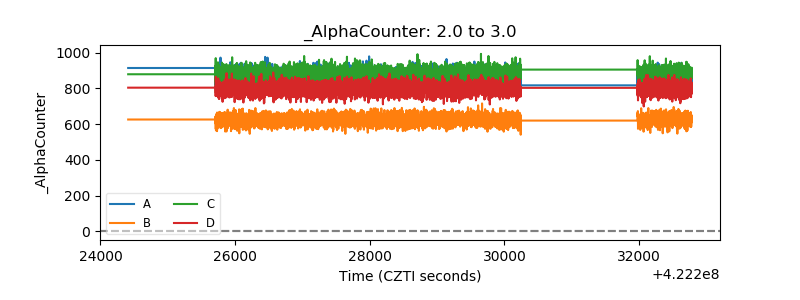 |
| _CPM_Rate | 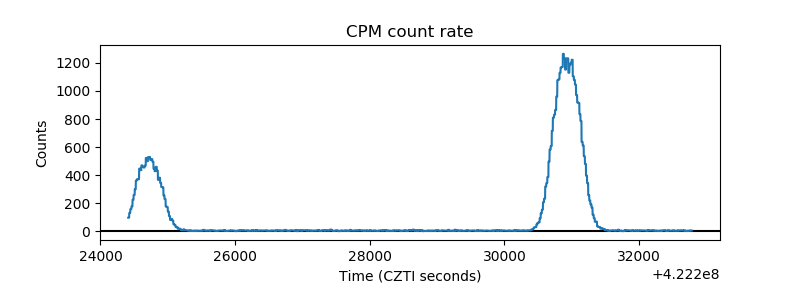 |
| CZT Counter | 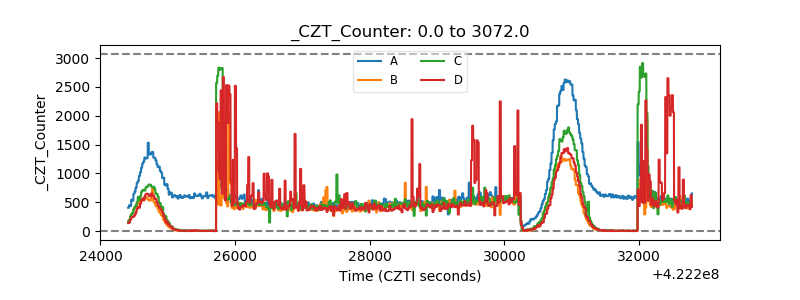 |
| +2.5 Volts monitor | 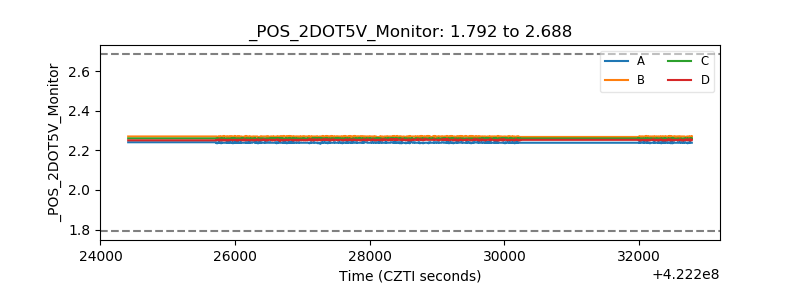 |
| +5 Volts monitor | 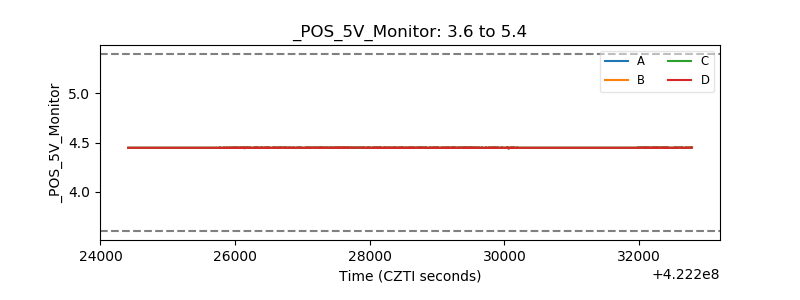 |
| _ROLL_ROT | 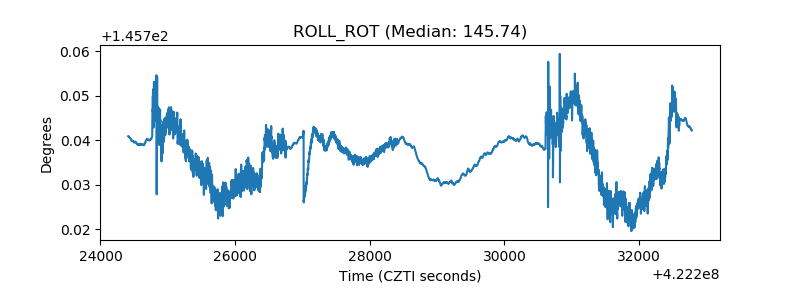 |
| _Roll_DEC | 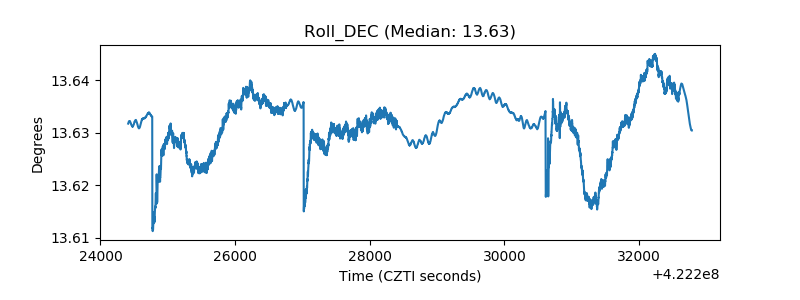 |
| _Roll_RA |  |
| Veto Counter | 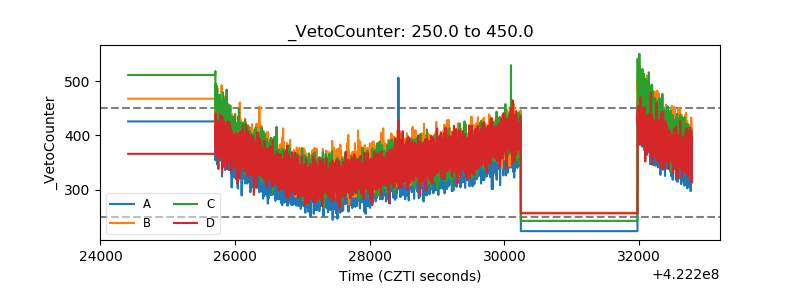 |