| Param | Original file | Final file |
|---|---|---|
| Filename | modeM0/AS1A12_025T14_9000005646_41313cztM0_level2.fits | modeM0/AS1A12_025T14_9000005646_41313cztM0_level2_quad_clean.evt |
| Size (bytes) | 332,231,040 | 85,112,640 |
| Size | 316.8 MB | 81.2 MB |
| Events in quadrant A | 2,770,580 | 581,976 |
| Events in quadrant B | 2,686,653 | 598,652 |
| Events in quadrant C | 3,214,623 | 533,086 |
| Events in quadrant D | 3,227,117 | 504,865 |
| Mode SS | |||
|---|---|---|---|
| Quadrant | BADHDUFLAG | Total packets | Discarded packets |
| A | 0 | 104 | 0 |
| B | 0 | 104 | 0 |
| C | 0 | 104 | 0 |
| D | 0 | 104 | 0 |
| Mode M0 | |||
|---|---|---|---|
| Quadrant | BADHDUFLAG | Total packets | Discarded packets |
| A | 0 | 11312 | 3 |
| B | 0 | 11358 | 2 |
| C | 0 | 12616 | 2 |
| D | 0 | 13278 | 2 |
| Mode M9 | |||
|---|---|---|---|
| Quadrant | BADHDUFLAG | Total packets | Discarded packets |
| A | 0 | 28 | 0 |
| B | 0 | 28 | 0 |
| C | 0 | 28 | 0 |
| D | 0 | 29 | 0 |
| Quadrant | Total seconds | Saturated seconds | Saturation percentage |
|---|---|---|---|
| A | 5119 | 5 | 0.097675% |
| B | 5119 | 50 | 0.976753% |
| C | 5119 | 292 | 5.704239% |
| D | 5119 | 226 | 4.414925% |
Noise dominated data is calculated using 1-second bins in cleaned event files. If a bin has >2000 counts, and if more than 50% of those come from <1% of pixels, then it is considered to be noise-dominated and hence unusable.
| Quadrant | # 1 sec bins | Bins with >0 counts | Bins with >2000 counts | High rate bins dominated by noise | Noise dominated (total time) | Noise dominated (detector-on time) | Marked lightcurve |
|---|---|---|---|---|---|---|---|
| A | 7002 | 5120 | 4 | 4 | 0.06% | 0.08% | 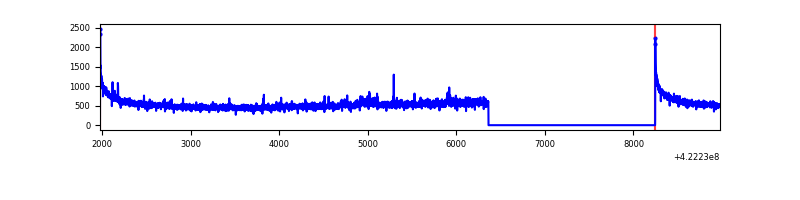 |
| B | 7002 | 5120 | 50 | 50 | 0.71% | 0.98% | 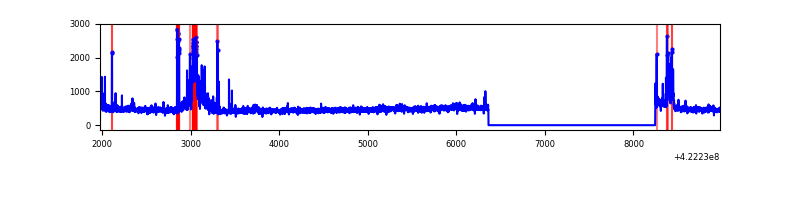 |
| C | 7002 | 5120 | 286 | 286 | 4.08% | 5.59% | 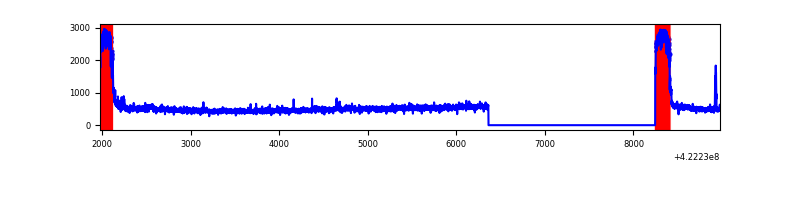 |
| D | 7001 | 5119 | 212 | 212 | 3.03% | 4.14% | 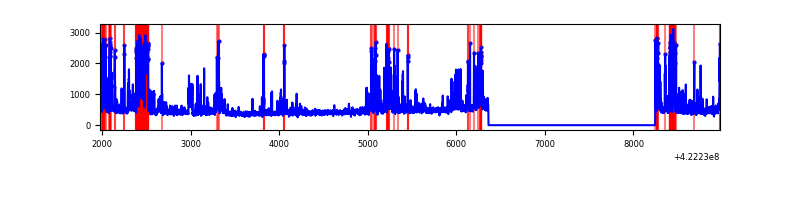 |
Top three noisy pixels from each quadrant. If the there are fewer than three noisy pixels in the level2.evt file, extra rows are filled as -1
| Pixel properties | Quadrant properties | ||||||
|---|---|---|---|---|---|---|---|
| Quadrant | DetID | PixID | Counts | Sigma | Mean | Median | Sigma |
| A | 10 | 83 | 479241 | 4049.26 | 575 | 564 | 118.2 |
| A | 12 | 189 | 24649 | 203.74 | 575 | 564 | 118.2 |
| A | 2 | 79 | 18631 | 152.83 | 575 | 564 | 118.2 |
| B | 5 | 255 | 287436 | 2562.23 | 571 | 554 | 112.0 |
| B | 0 | 229 | 97125 | 862.5 | 571 | 554 | 112.0 |
| B | 0 | 245 | 26000 | 227.27 | 571 | 554 | 112.0 |
| C | 0 | 10 | 857435 | 6763.32 | 537 | 540 | 126.7 |
| C | 15 | 214 | 213230 | 1678.72 | 537 | 540 | 126.7 |
| C | 9 | 54 | 20624 | 158.52 | 537 | 540 | 126.7 |
| D | 2 | 249 | 765186 | 5661.53 | 544 | 528 | 135.1 |
| D | 13 | 249 | 184285 | 1360.53 | 544 | 528 | 135.1 |
| D | 5 | 222 | 86035 | 633.09 | 544 | 528 | 135.1 |
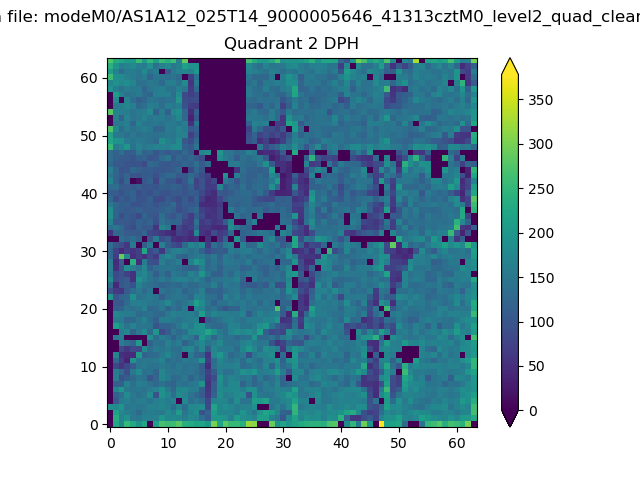
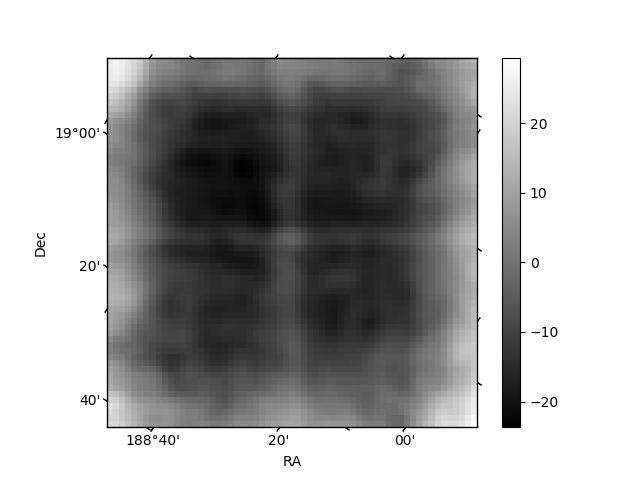
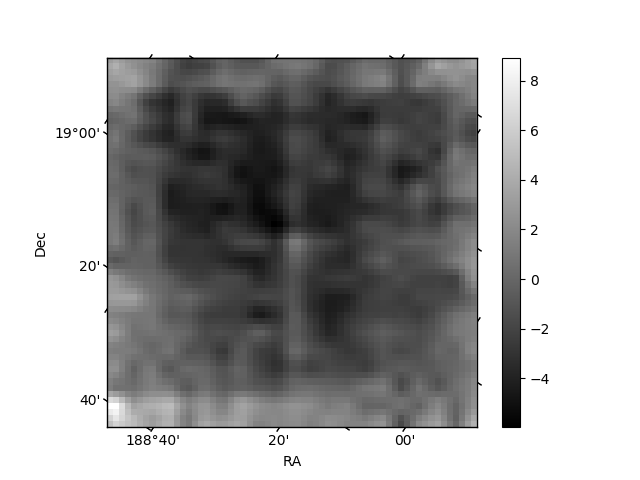
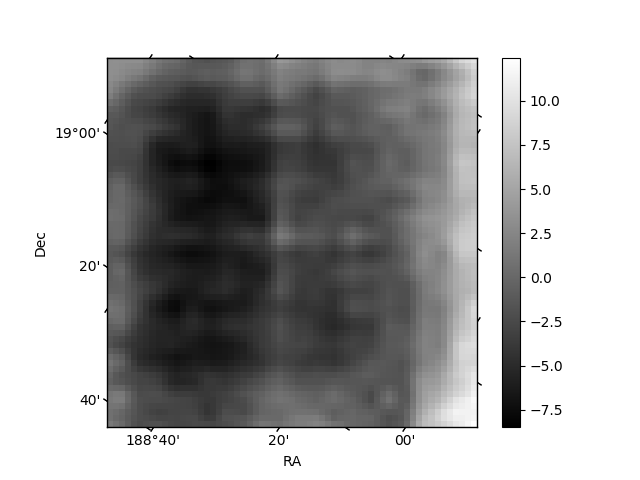
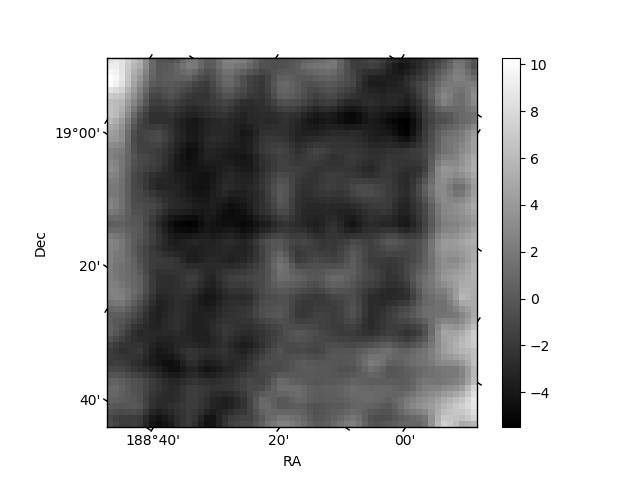
Histogram calculated using DETX and DETY for each event in the final _common_clean file
| Quadrant A | 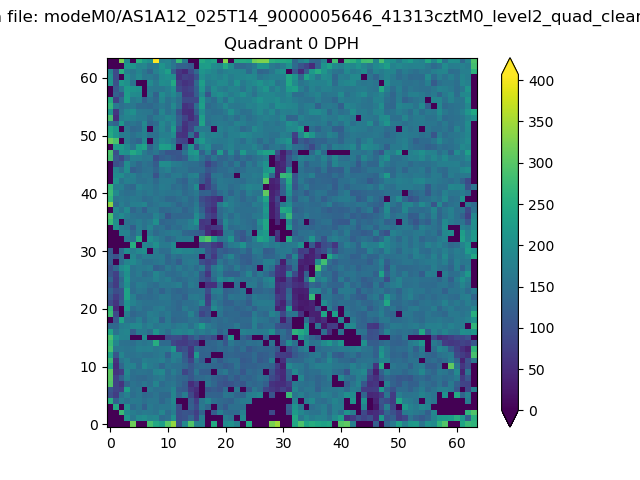 |
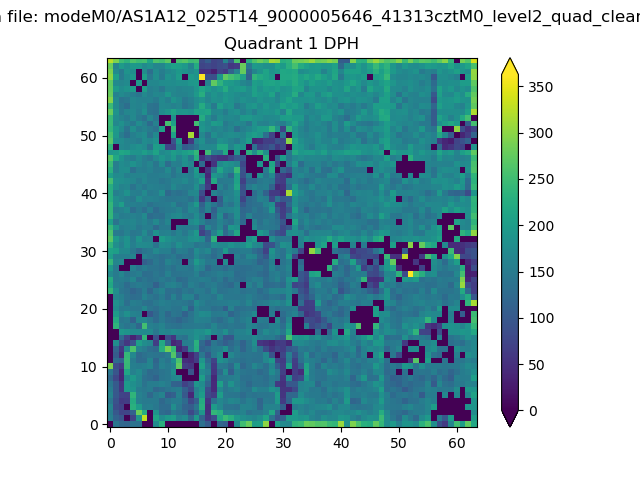 |
Quadrant B |
|---|---|---|---|
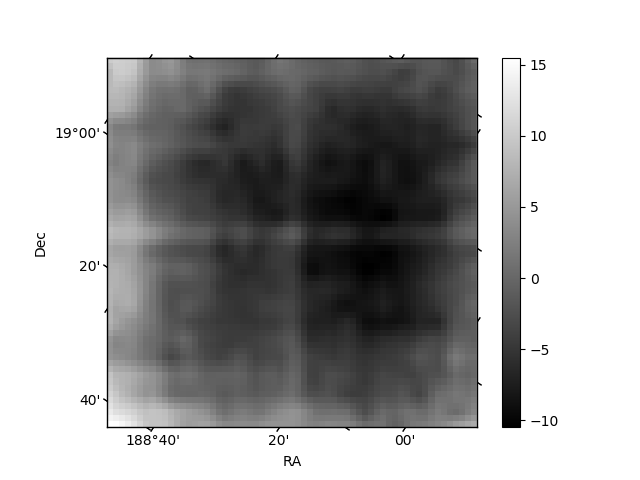
| Quadrant D | 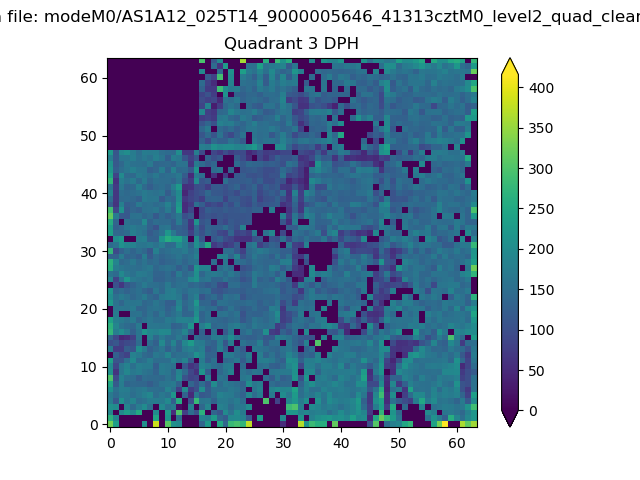 |
 |
Quadrant C |
| Plot type | Count rate plots | Images |
|---|---|---|
| Comparison with Poisson distribution Blue bars denote a histogram of data divided into 1 sec bins. Red curve is a Poisson curve with rate = median count rate of data. |
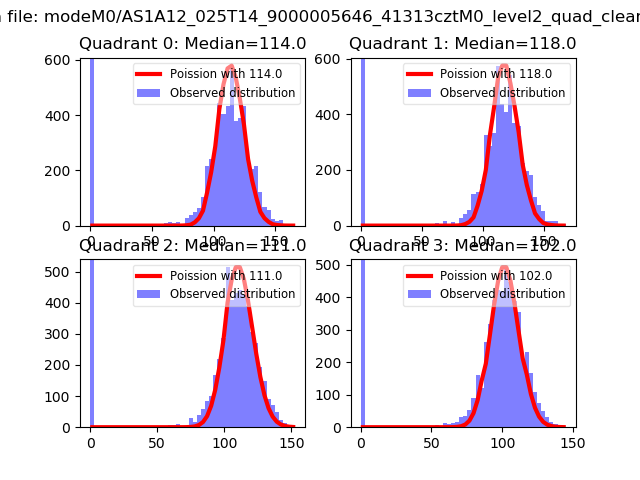 |
 |
| Quadrant-wise count rates Data is divided into 100 sec bins |
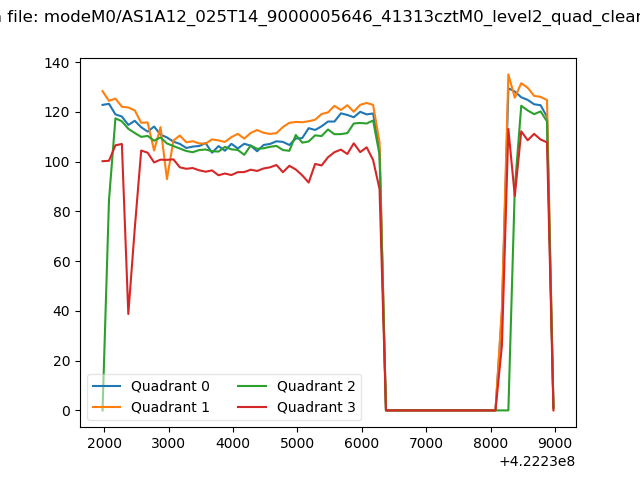 |
|
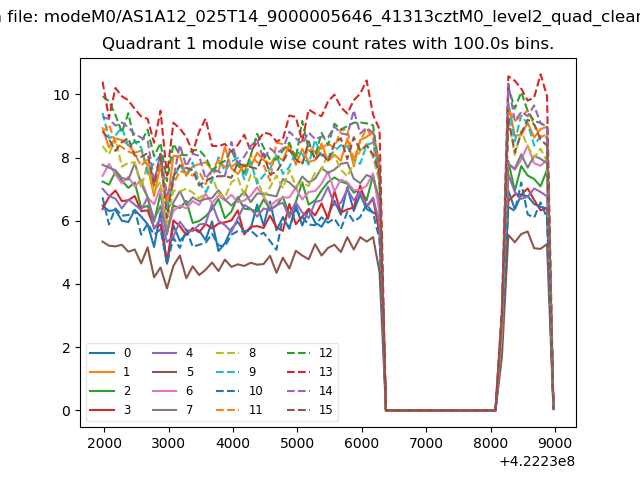
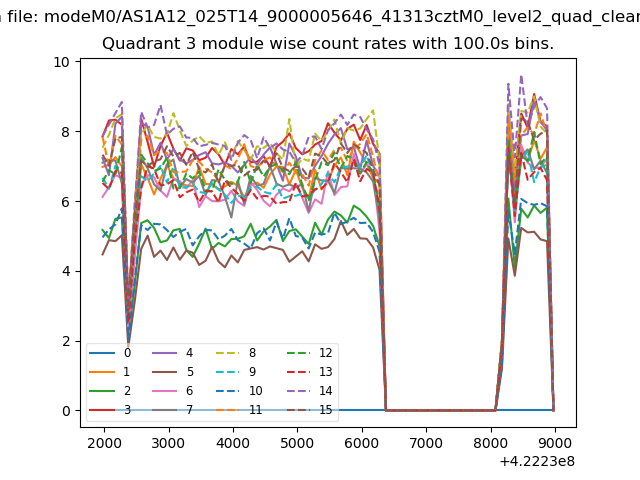
| Module-wise count rates for Quadrant A Data is divided into 100 sec bins |
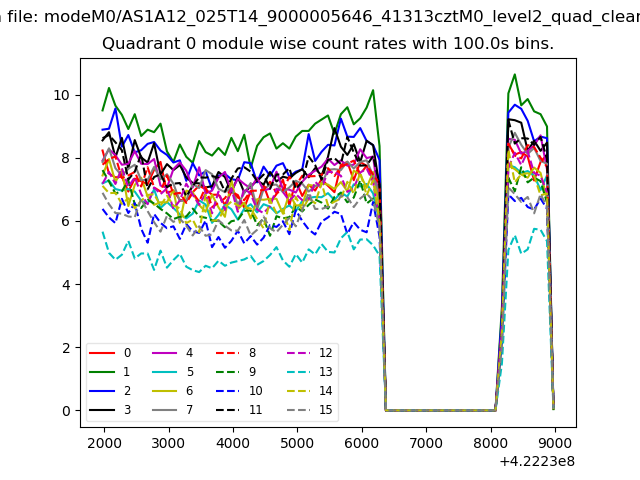 |
 |
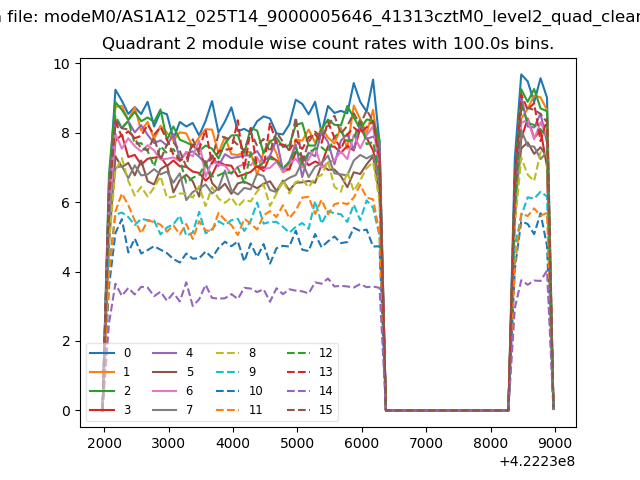
| Module-wise count rates for Quadrant B Data is divided into 100 sec bins |
 |
 |
| Module-wise count rates for Quadrant C Data is divided into 100 sec bins |
 |
 |
| Module-wise count rates for Quadrant D Data is divided into 100 sec bins |
 |
 |
| Parameter | Plot |
|---|---|
| CZT HV Monitor |  |
| D_VDD | 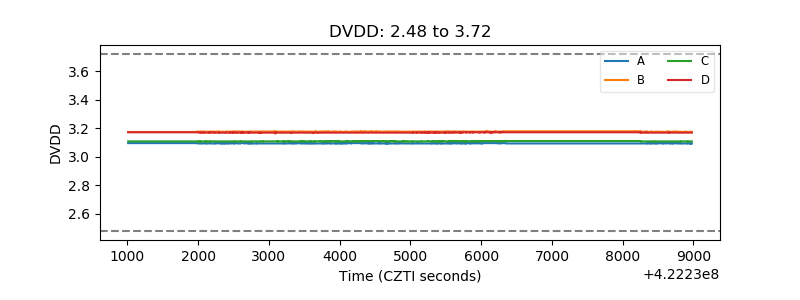 |
| Temperature 1 | 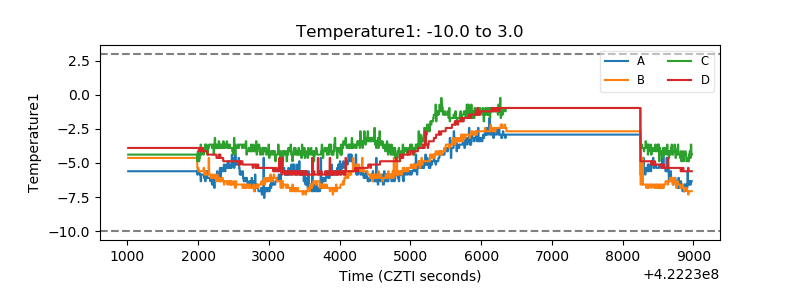 |
| Veto HV Monitor | 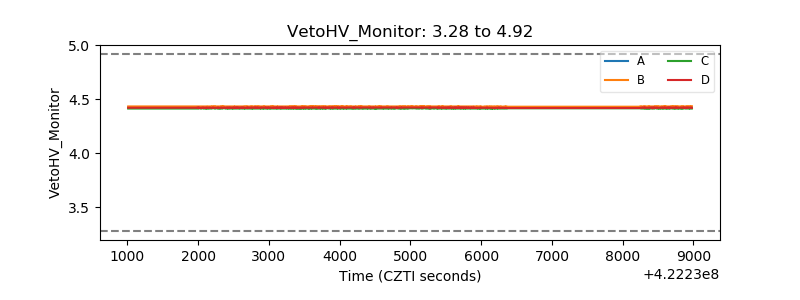 |
| Veto LLD | 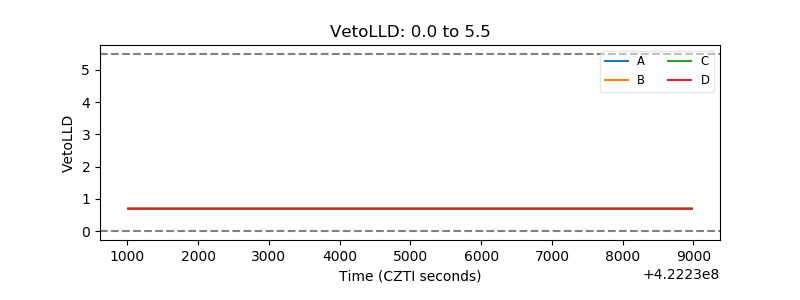 |
| Alpha Counter | 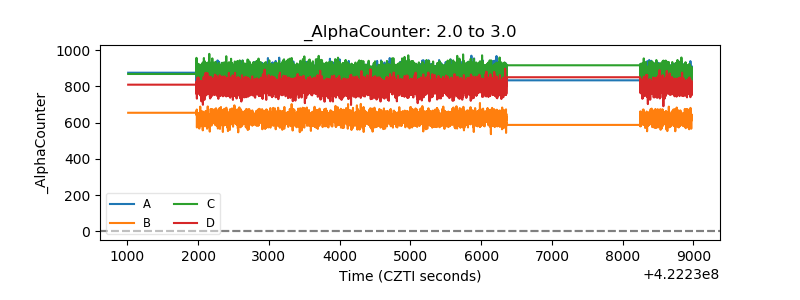 |
| _CPM_Rate | 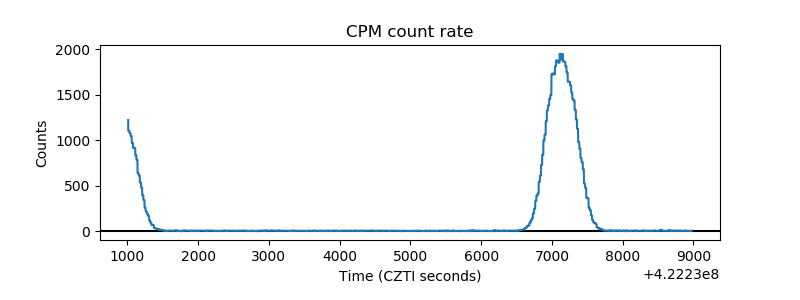 |
| CZT Counter | 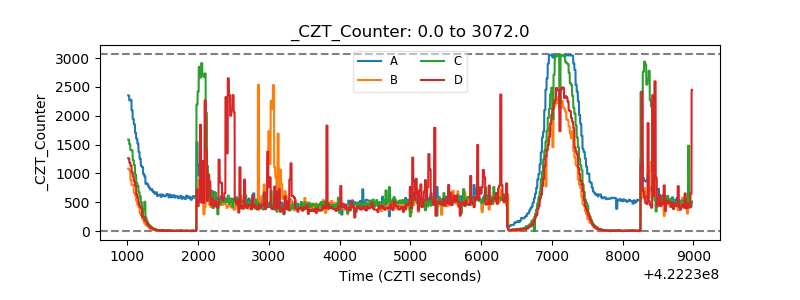 |
| +2.5 Volts monitor | 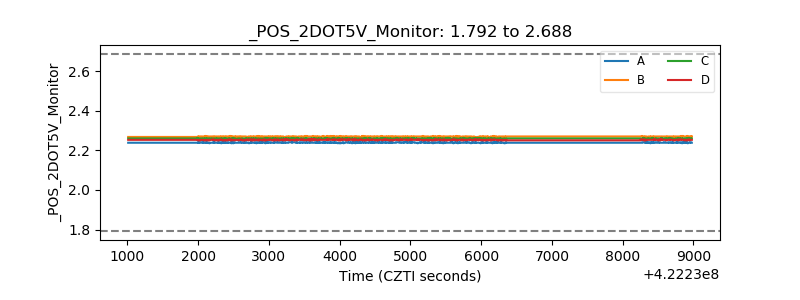 |
| +5 Volts monitor | 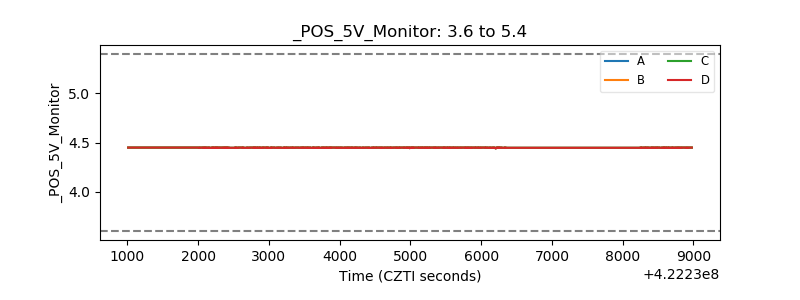 |
| _ROLL_ROT | 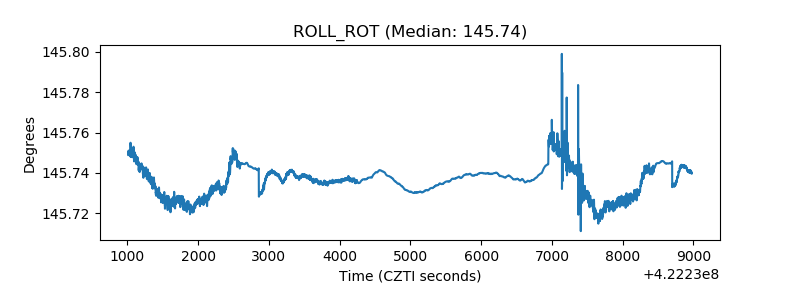 |
| _Roll_DEC | 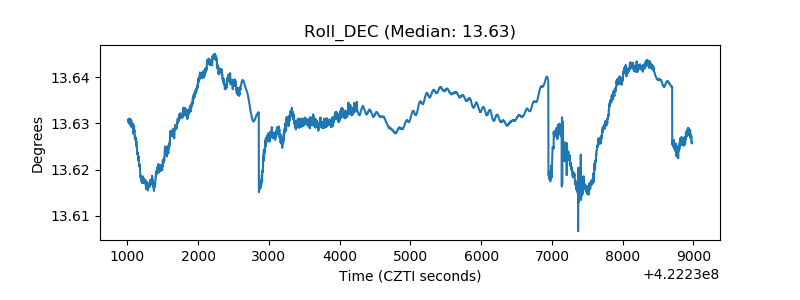 |
| _Roll_RA | 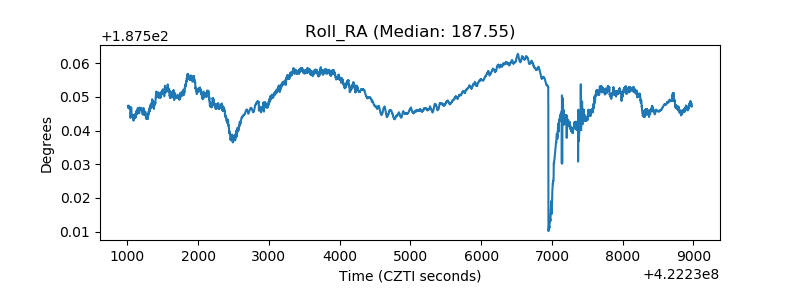 |
| Veto Counter | 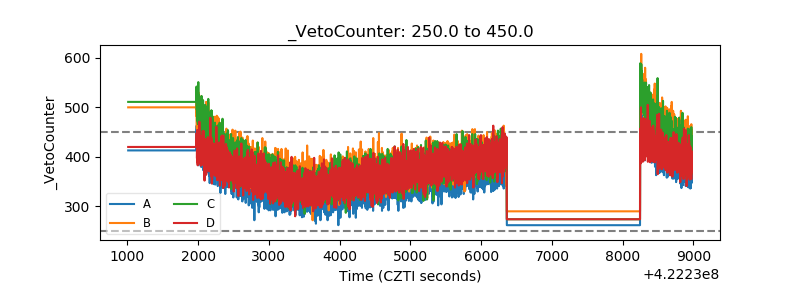 |