| Param | Original file | Final file |
|---|---|---|
| Filename | modeM0/AS1A12_025T14_9000005646_41314cztM0_level2.fits | modeM0/AS1A12_025T14_9000005646_41314cztM0_level2_quad_clean.evt |
| Size (bytes) | 356,002,560 | 90,201,600 |
| Size | 339.5 MB | 86.0 MB |
| Events in quadrant A | 2,906,628 | 619,806 |
| Events in quadrant B | 3,109,345 | 639,263 |
| Events in quadrant C | 3,492,601 | 565,414 |
| Events in quadrant D | 3,261,445 | 539,950 |
| Mode SS | |||
|---|---|---|---|
| Quadrant | BADHDUFLAG | Total packets | Discarded packets |
| A | 0 | 110 | 0 |
| B | 0 | 110 | 0 |
| C | 0 | 110 | 0 |
| D | 0 | 110 | 0 |
| Mode M0 | |||
|---|---|---|---|
| Quadrant | BADHDUFLAG | Total packets | Discarded packets |
| A | 0 | 11686 | 3 |
| B | 0 | 12663 | 2 |
| C | 0 | 13348 | 2 |
| D | 0 | 13312 | 2 |
| Mode M9 | |||
|---|---|---|---|
| Quadrant | BADHDUFLAG | Total packets | Discarded packets |
| A | 0 | 38 | 0 |
| B | 0 | 38 | 0 |
| C | 0 | 38 | 0 |
| D | 0 | 38 | 0 |
| Quadrant | Total seconds | Saturated seconds | Saturation percentage |
|---|---|---|---|
| A | 5238 | 10 | 0.190913% |
| B | 5238 | 81 | 1.546392% |
| C | 5238 | 316 | 6.032837% |
| D | 5238 | 167 | 3.188240% |
Noise dominated data is calculated using 1-second bins in cleaned event files. If a bin has >2000 counts, and if more than 50% of those come from <1% of pixels, then it is considered to be noise-dominated and hence unusable.
| Quadrant | # 1 sec bins | Bins with >0 counts | Bins with >2000 counts | High rate bins dominated by noise | Noise dominated (total time) | Noise dominated (detector-on time) | Marked lightcurve |
|---|---|---|---|---|---|---|---|
| A | 9094 | 5240 | 4 | 4 | 0.04% | 0.08% | 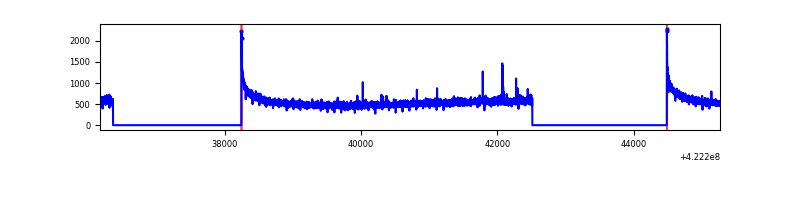 |
| B | 9094 | 5240 | 51 | 51 | 0.56% | 0.97% | 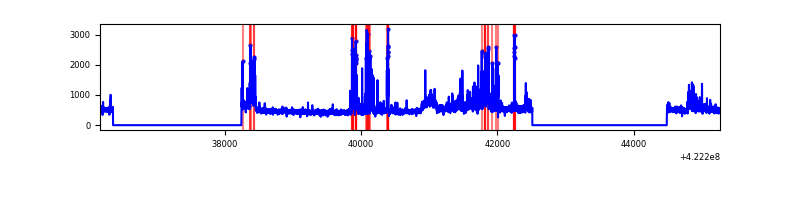 |
| C | 9094 | 5240 | 313 | 313 | 3.44% | 5.97% | 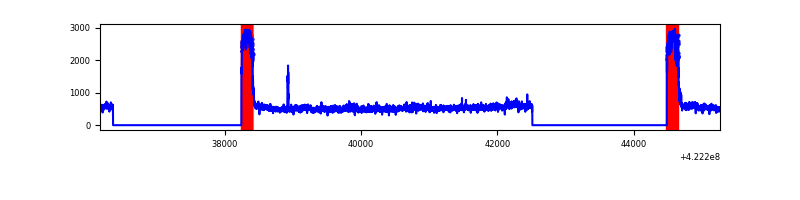 |
| D | 9094 | 5240 | 150 | 150 | 1.65% | 2.86% | 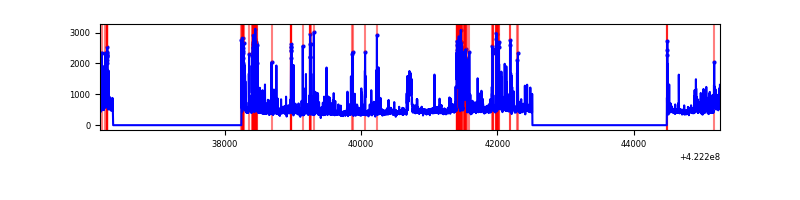 |
Top three noisy pixels from each quadrant. If the there are fewer than three noisy pixels in the level2.evt file, extra rows are filled as -1
| Pixel properties | Quadrant properties | ||||||
|---|---|---|---|---|---|---|---|
| Quadrant | DetID | PixID | Counts | Sigma | Mean | Median | Sigma |
| A | 10 | 83 | 502847 | 4008.02 | 612 | 602 | 125.3 |
| A | 2 | 79 | 17473 | 134.63 | 612 | 602 | 125.3 |
| A | 12 | 189 | 8754 | 65.05 | 612 | 602 | 125.3 |
| B | 5 | 255 | 508746 | 4313.11 | 608 | 592 | 117.8 |
| B | 0 | 229 | 179278 | 1516.65 | 608 | 592 | 117.8 |
| B | 0 | 245 | 19105 | 157.13 | 608 | 592 | 117.8 |
| C | 0 | 10 | 1044344 | 7817.84 | 568 | 572 | 133.5 |
| C | 15 | 214 | 214781 | 1604.42 | 568 | 572 | 133.5 |
| C | 15 | 159 | 18346 | 133.13 | 568 | 572 | 133.5 |
| D | 2 | 249 | 470270 | 3261.11 | 580 | 563 | 144.0 |
| D | 13 | 249 | 322335 | 2234.02 | 580 | 563 | 144.0 |
| D | 5 | 222 | 235027 | 1627.85 | 580 | 563 | 144.0 |
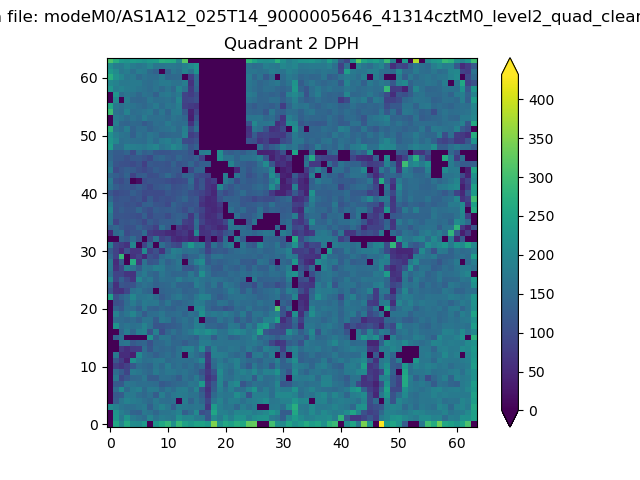
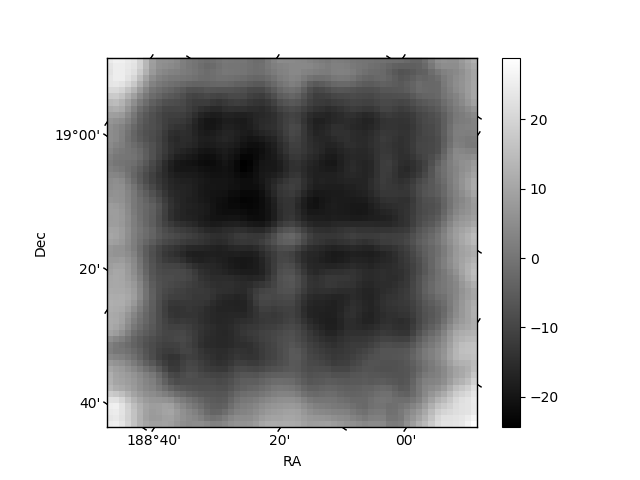
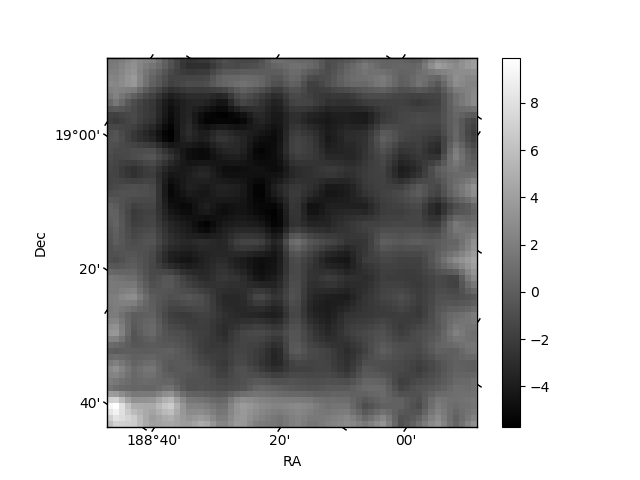
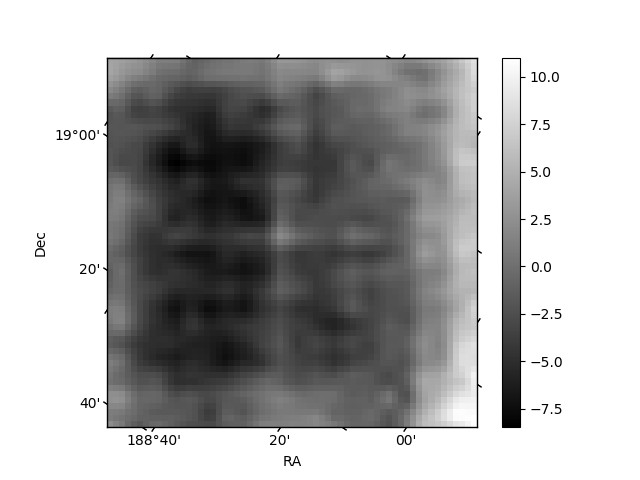
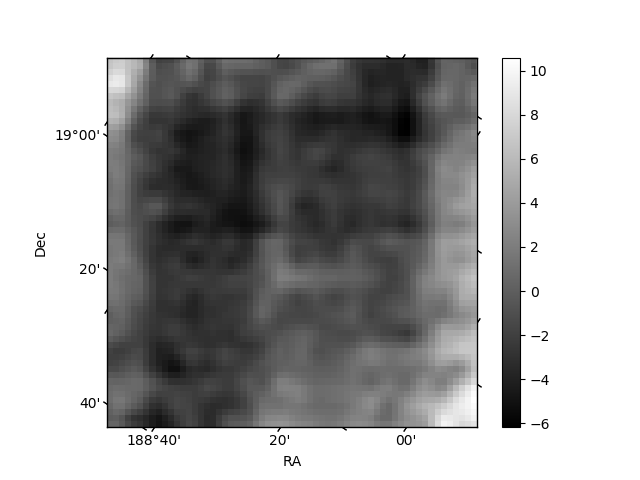
Histogram calculated using DETX and DETY for each event in the final _common_clean file
| Quadrant A | 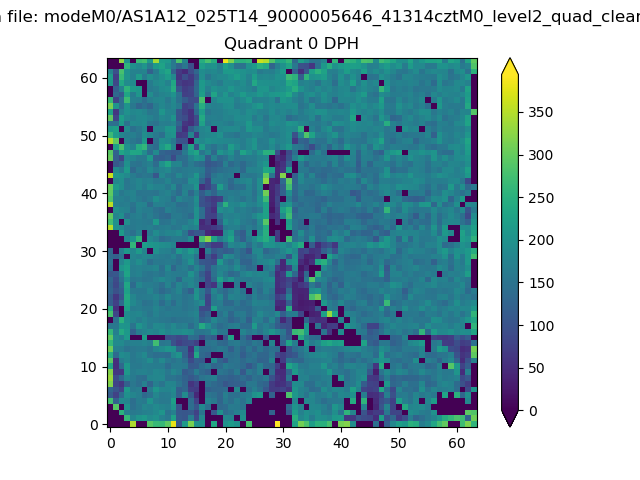 |
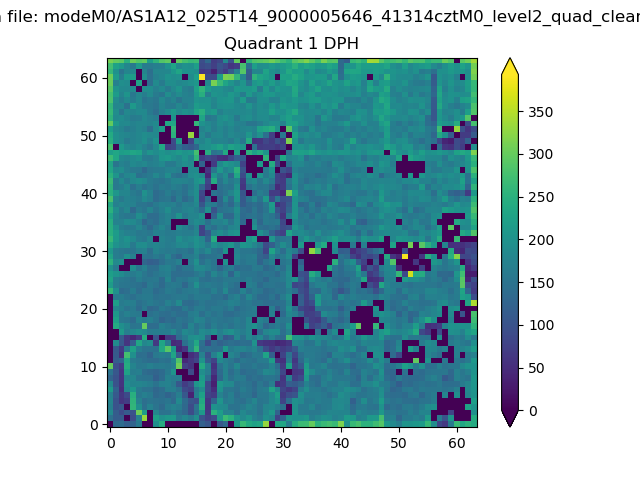 |
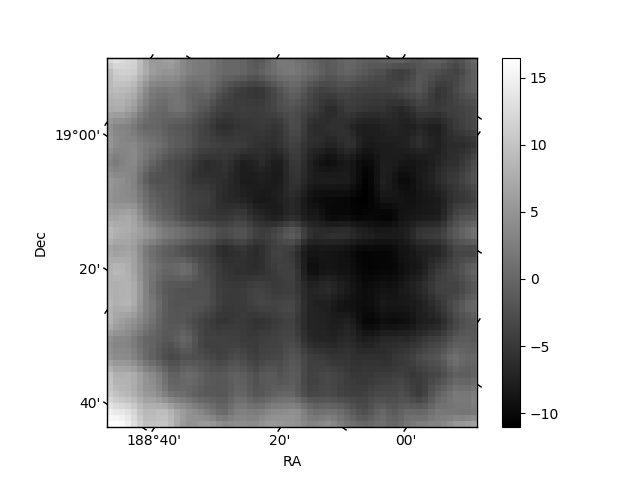
Quadrant B |
|---|---|---|---|
| Quadrant D | 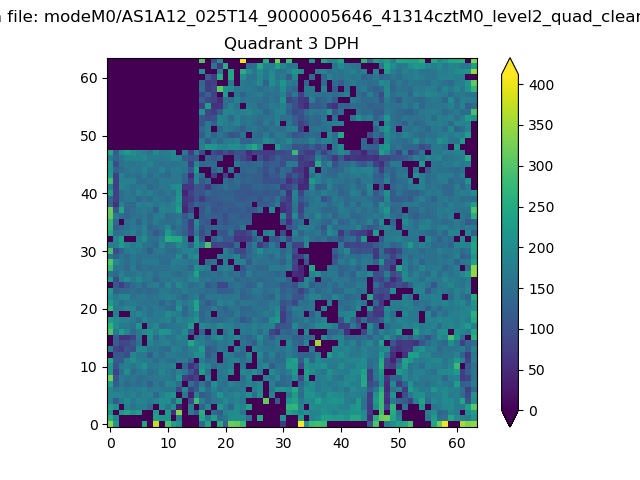 |
 |
Quadrant C |
| Plot type | Count rate plots | Images |
|---|---|---|
| Comparison with Poisson distribution Blue bars denote a histogram of data divided into 1 sec bins. Red curve is a Poisson curve with rate = median count rate of data. |
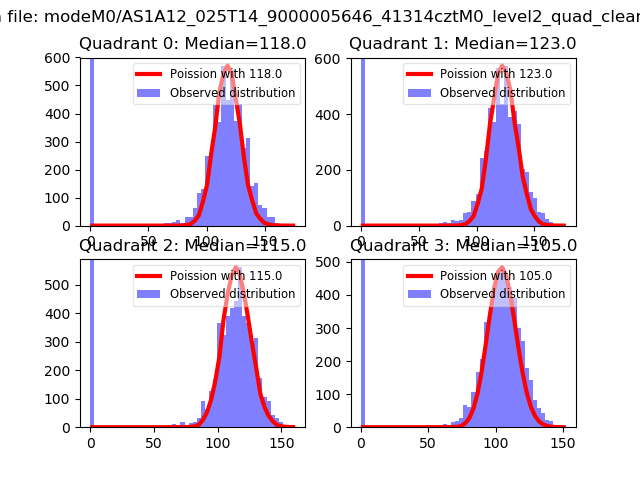 |
 |
| Quadrant-wise count rates Data is divided into 100 sec bins |
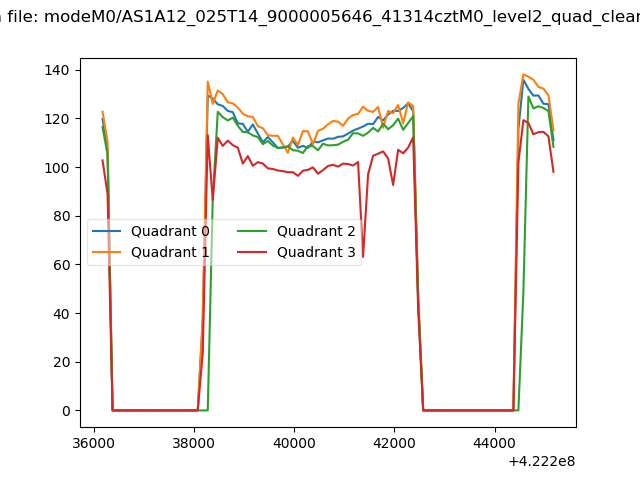 |
|
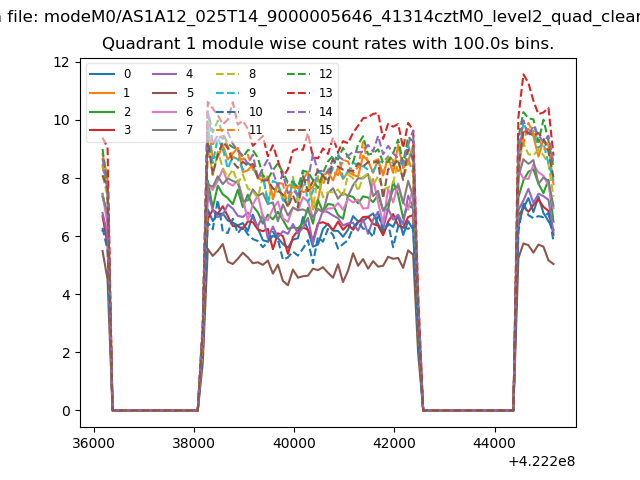
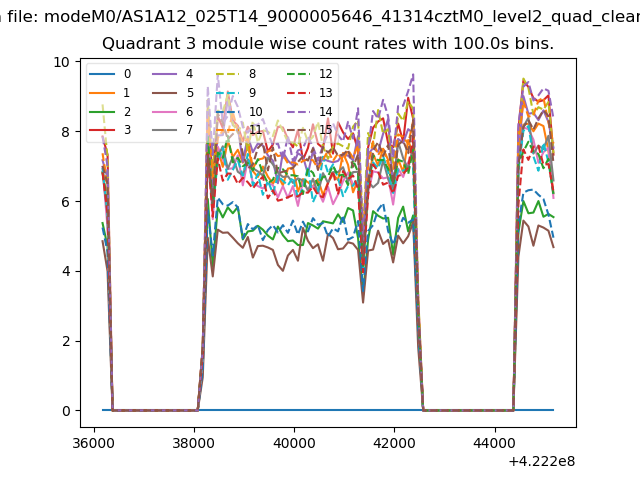
| Module-wise count rates for Quadrant A Data is divided into 100 sec bins |
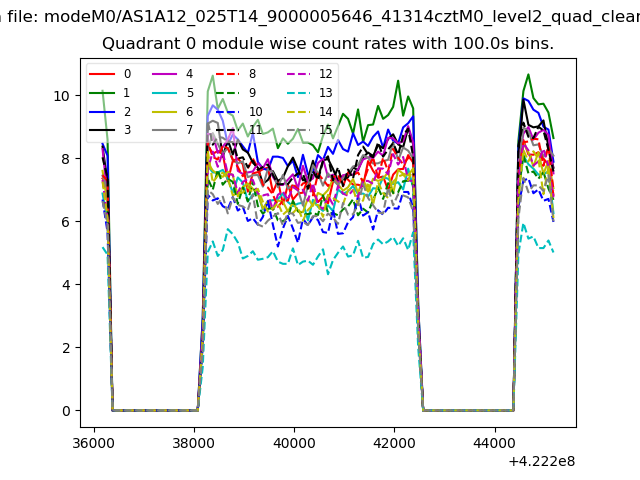 |
 |
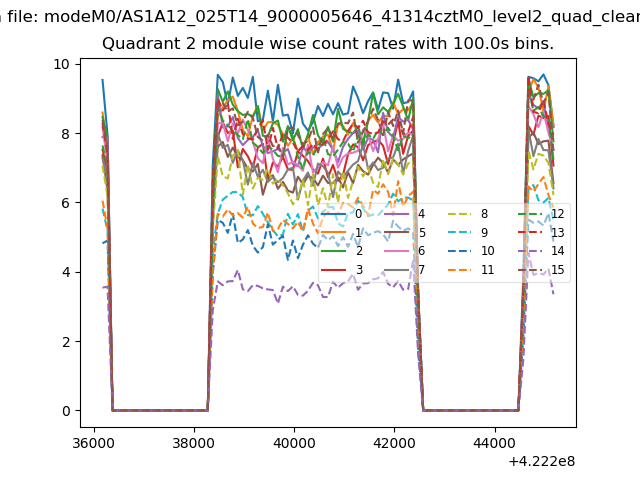
| Module-wise count rates for Quadrant B Data is divided into 100 sec bins |
 |
 |
| Module-wise count rates for Quadrant C Data is divided into 100 sec bins |
 |
 |
| Module-wise count rates for Quadrant D Data is divided into 100 sec bins |
 |
 |
| Parameter | Plot |
|---|---|
| CZT HV Monitor | 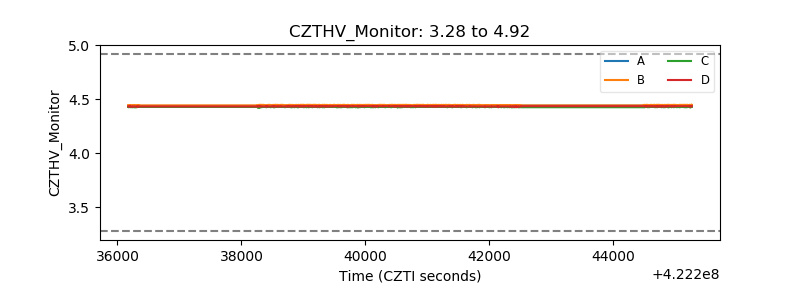 |
| D_VDD | 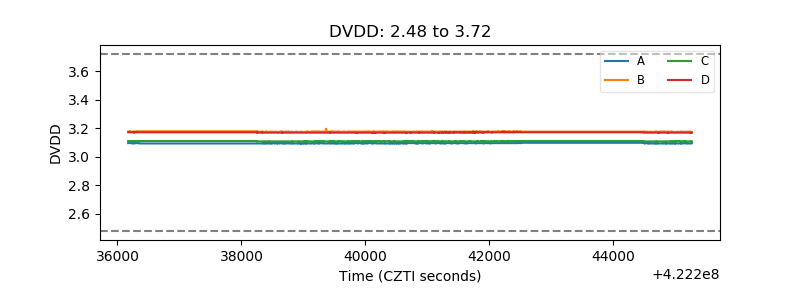 |
| Temperature 1 | 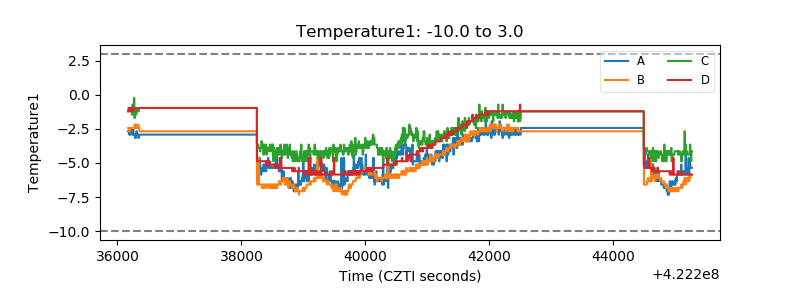 |
| Veto HV Monitor | 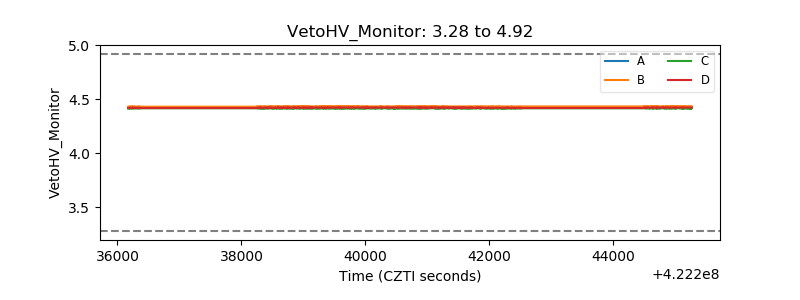 |
| Veto LLD | 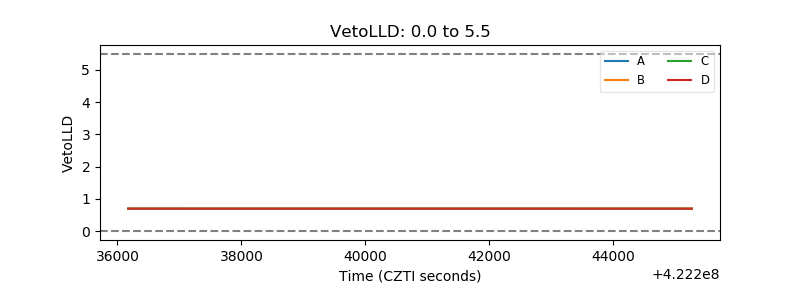 |
| Alpha Counter | 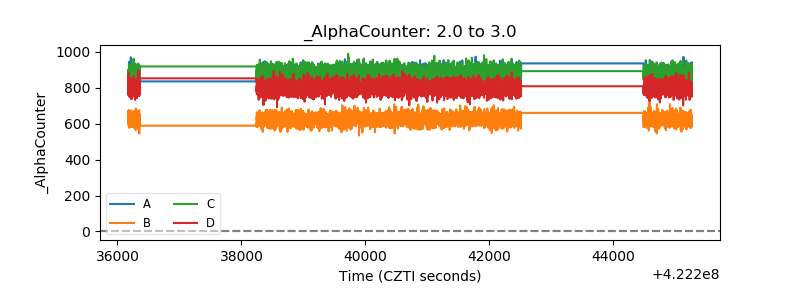 |
| _CPM_Rate | 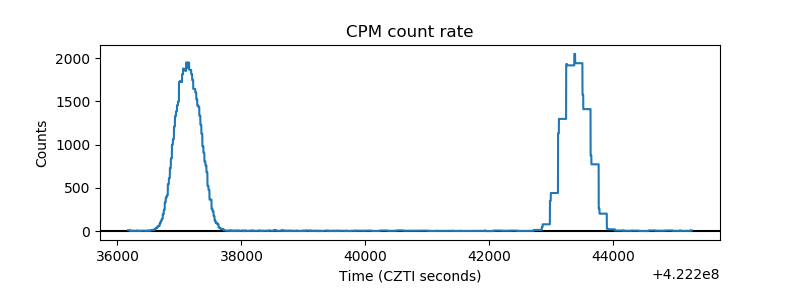 |
| CZT Counter | 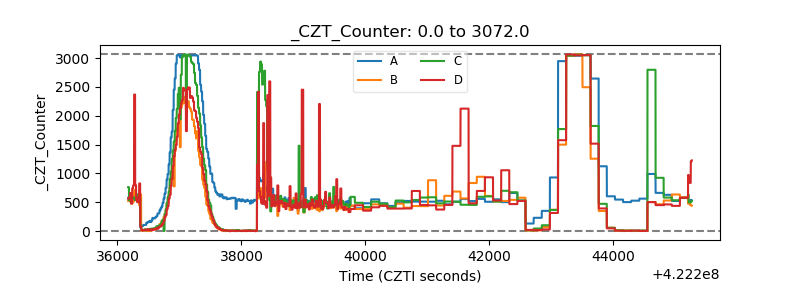 |
| +2.5 Volts monitor | 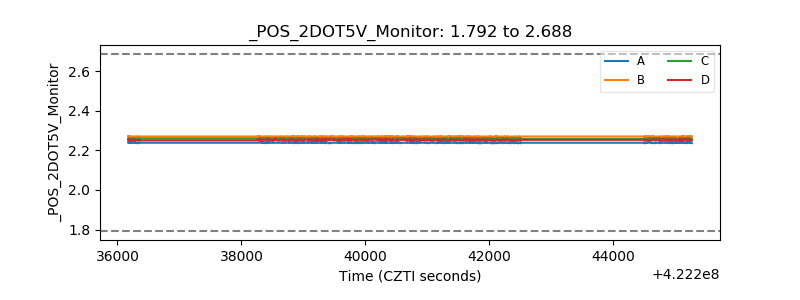 |
| +5 Volts monitor | 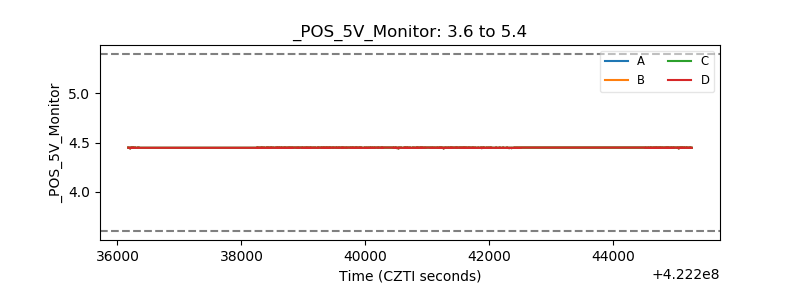 |
| _ROLL_ROT | 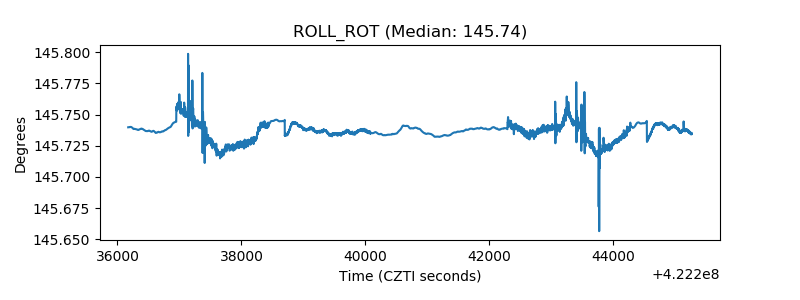 |
| _Roll_DEC | 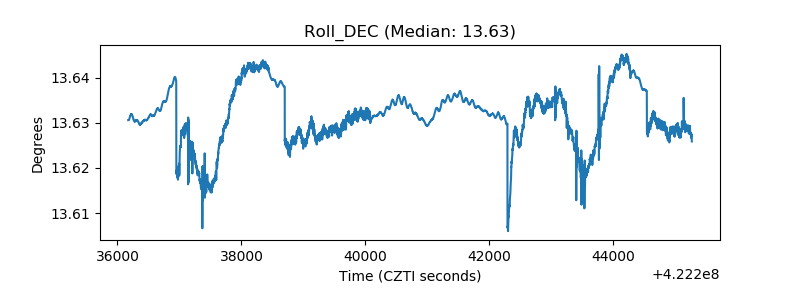 |
| _Roll_RA | 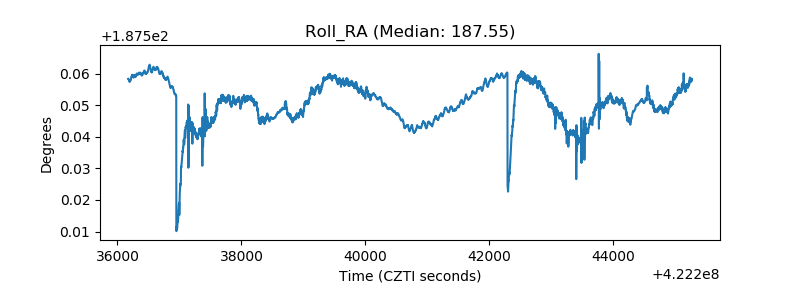 |
| Veto Counter | 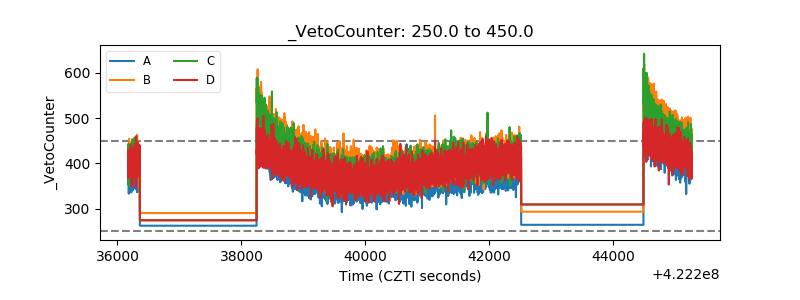 |