| Param | Original file | Final file |
|---|---|---|
| Filename | modeM0/AS1A12_025T14_9000005646_41315cztM0_level2.fits | modeM0/AS1A12_025T14_9000005646_41315cztM0_level2_quad_clean.evt |
| Size (bytes) | 330,223,680 | 87,488,640 |
| Size | 314.9 MB | 83.4 MB |
| Events in quadrant A | 2,808,116 | 601,826 |
| Events in quadrant B | 2,792,946 | 625,328 |
| Events in quadrant C | 3,299,561 | 546,734 |
| Events in quadrant D | 2,936,787 | 527,000 |
| Mode SS | |||
|---|---|---|---|
| Quadrant | BADHDUFLAG | Total packets | Discarded packets |
| A | 0 | 106 | 0 |
| B | 0 | 106 | 0 |
| C | 0 | 106 | 0 |
| D | 0 | 106 | 0 |
| Mode M0 | |||
|---|---|---|---|
| Quadrant | BADHDUFLAG | Total packets | Discarded packets |
| A | 0 | 11282 | 3 |
| B | 0 | 11288 | 2 |
| C | 0 | 12526 | 2 |
| D | 0 | 12161 | 2 |
| Mode M9 | |||
|---|---|---|---|
| Quadrant | BADHDUFLAG | Total packets | Discarded packets |
| A | 0 | 40 | 0 |
| B | 0 | 40 | 0 |
| C | 0 | 40 | 0 |
| D | 0 | 40 | 0 |
| Quadrant | Total seconds | Saturated seconds | Saturation percentage |
|---|---|---|---|
| A | 4960 | 7 | 0.141129% |
| B | 4960 | 16 | 0.322581% |
| C | 4960 | 305 | 6.149194% |
| D | 4960 | 90 | 1.814516% |
Noise dominated data is calculated using 1-second bins in cleaned event files. If a bin has >2000 counts, and if more than 50% of those come from <1% of pixels, then it is considered to be noise-dominated and hence unusable.
| Quadrant | # 1 sec bins | Bins with >0 counts | Bins with >2000 counts | High rate bins dominated by noise | Noise dominated (total time) | Noise dominated (detector-on time) | Marked lightcurve |
|---|---|---|---|---|---|---|---|
| A | 9025 | 4962 | 4 | 4 | 0.04% | 0.08% | 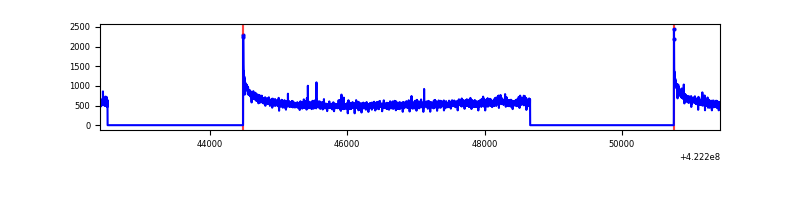 |
| B | 9025 | 4962 | 6 | 6 | 0.07% | 0.12% |  |
| C | 9025 | 4962 | 306 | 306 | 3.39% | 6.17% | 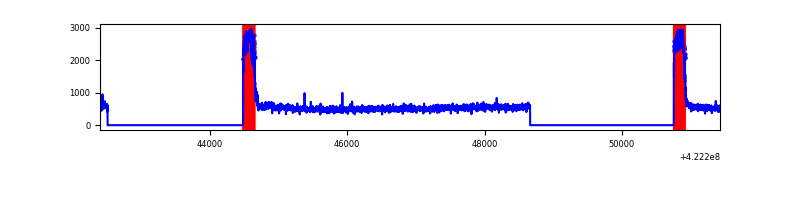 |
| D | 9025 | 4962 | 84 | 84 | 0.93% | 1.69% | 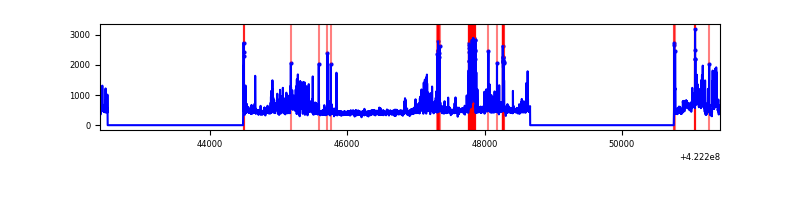 |
Top three noisy pixels from each quadrant. If the there are fewer than three noisy pixels in the level2.evt file, extra rows are filled as -1
| Pixel properties | Quadrant properties | ||||||
|---|---|---|---|---|---|---|---|
| Quadrant | DetID | PixID | Counts | Sigma | Mean | Median | Sigma |
| A | 10 | 83 | 481126 | 3988.84 | 589 | 578 | 120.5 |
| A | 12 | 189 | 25575 | 207.49 | 589 | 578 | 120.5 |
| A | 13 | 6 | 15103 | 120.57 | 589 | 578 | 120.5 |
| B | 5 | 255 | 421924 | 3695.51 | 589 | 575 | 114.0 |
| B | 0 | 229 | 42194 | 365.03 | 589 | 575 | 114.0 |
| B | 12 | 111 | 14365 | 120.95 | 589 | 575 | 114.0 |
| C | 0 | 10 | 961178 | 7486.39 | 545 | 550 | 128.3 |
| C | 15 | 214 | 206801 | 1607.36 | 545 | 550 | 128.3 |
| C | 15 | 159 | 5221 | 36.4 | 545 | 550 | 128.3 |
| D | 2 | 249 | 267135 | 1925.77 | 562 | 548 | 138.4 |
| D | 5 | 222 | 260740 | 1879.57 | 562 | 548 | 138.4 |
| D | 2 | 120 | 138801 | 998.71 | 562 | 548 | 138.4 |
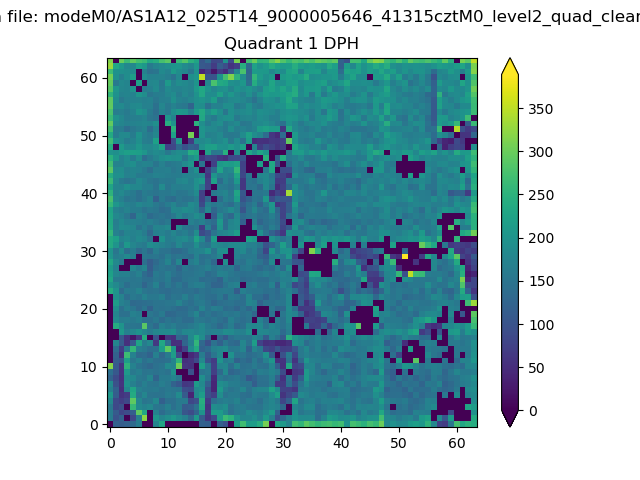
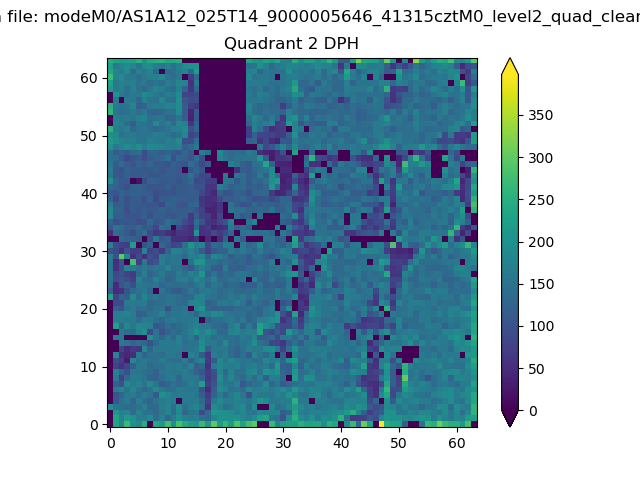
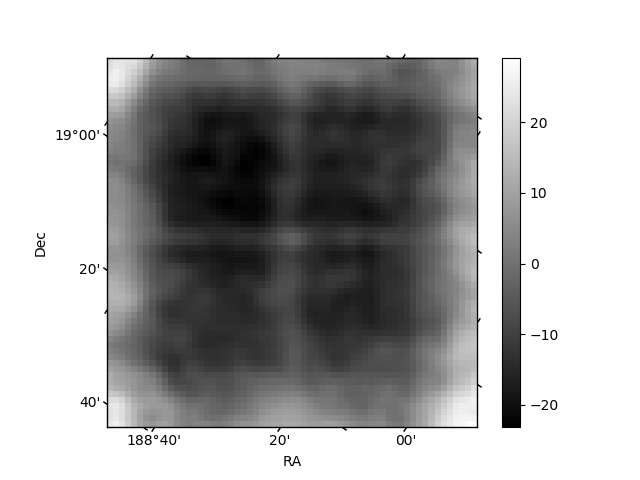
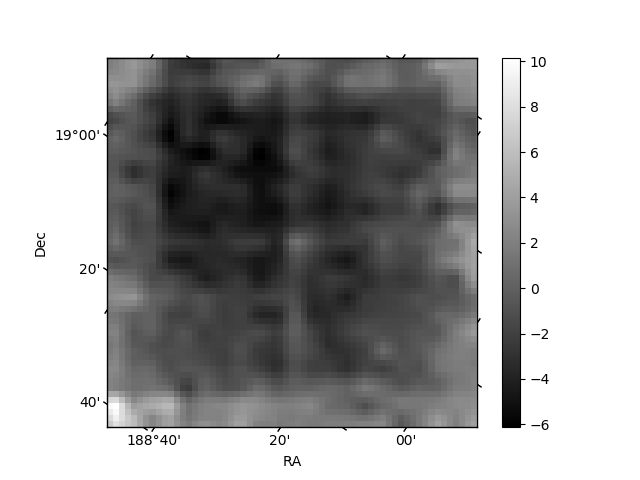
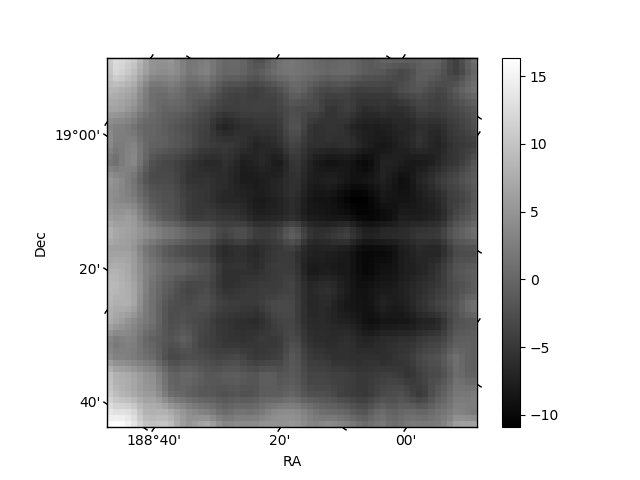
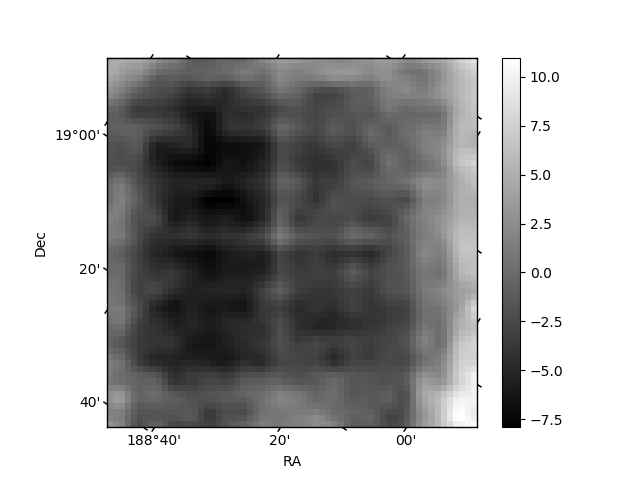
Histogram calculated using DETX and DETY for each event in the final _common_clean file
| Quadrant A | 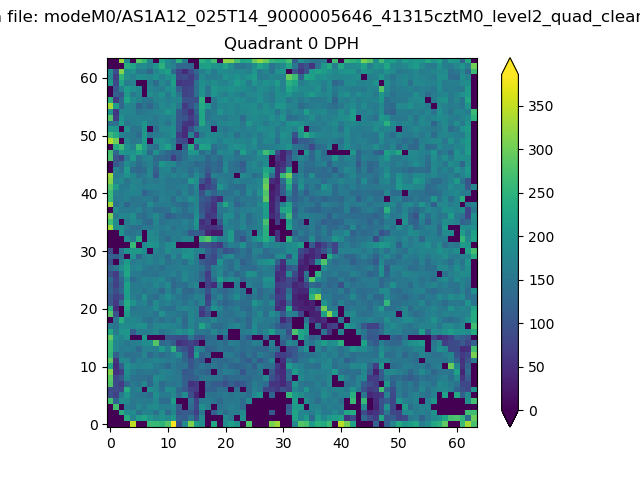 |
 |
Quadrant B |
|---|---|---|---|
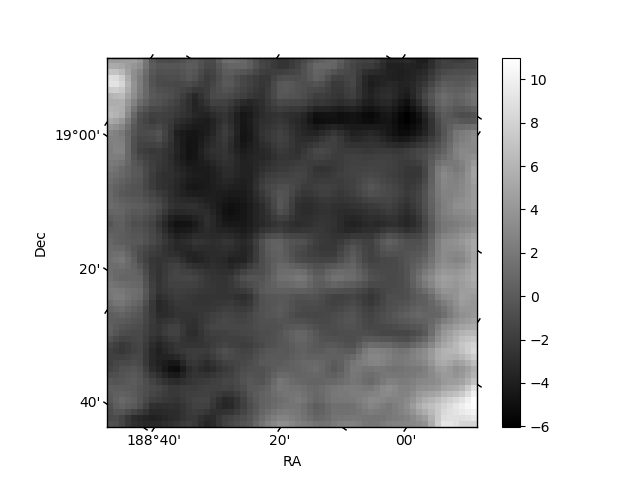
| Quadrant D | 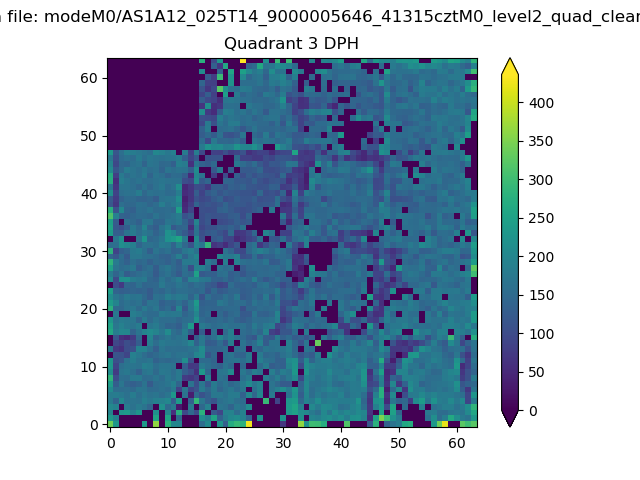 |
 |
Quadrant C |
| Plot type | Count rate plots | Images |
|---|---|---|
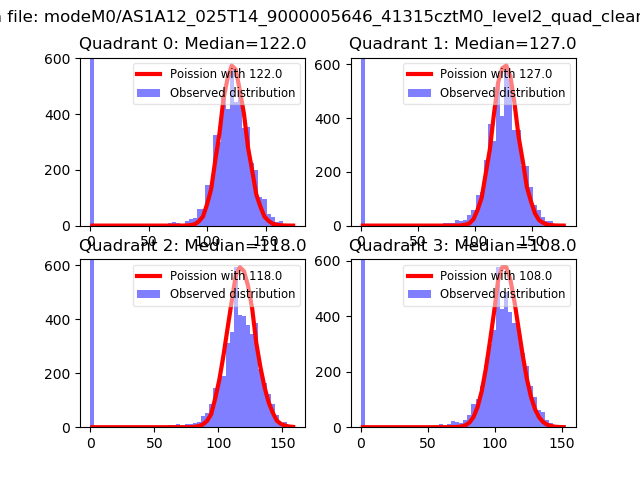
| Comparison with Poisson distribution Blue bars denote a histogram of data divided into 1 sec bins. Red curve is a Poisson curve with rate = median count rate of data. |
 |
 |
| Quadrant-wise count rates Data is divided into 100 sec bins |
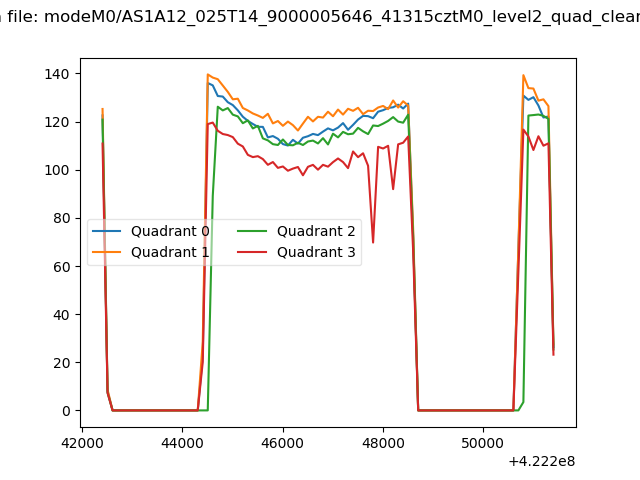 |
|
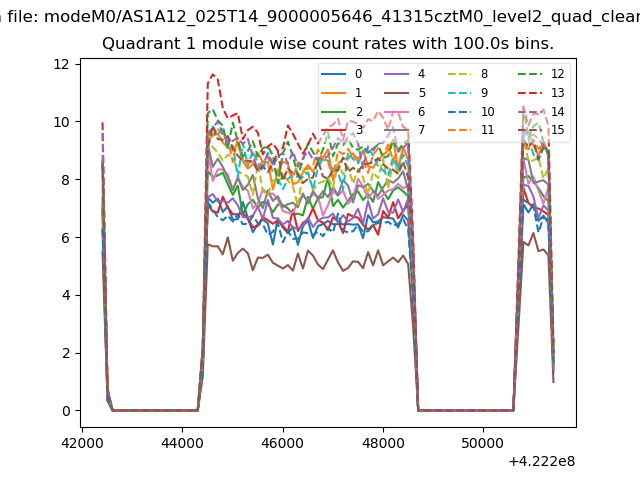
| Module-wise count rates for Quadrant A Data is divided into 100 sec bins |
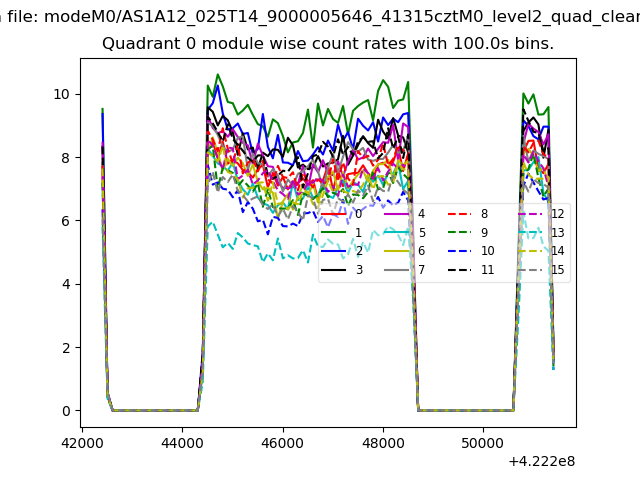 |
 |
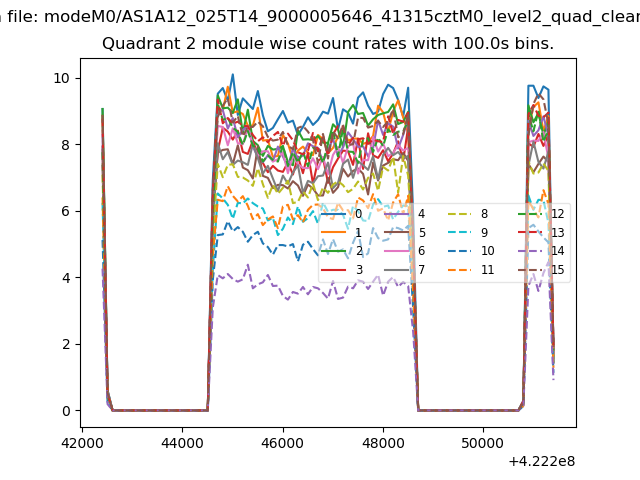
| Module-wise count rates for Quadrant B Data is divided into 100 sec bins |
 |
 |
| Module-wise count rates for Quadrant C Data is divided into 100 sec bins |
 |
 |
| Module-wise count rates for Quadrant D Data is divided into 100 sec bins |
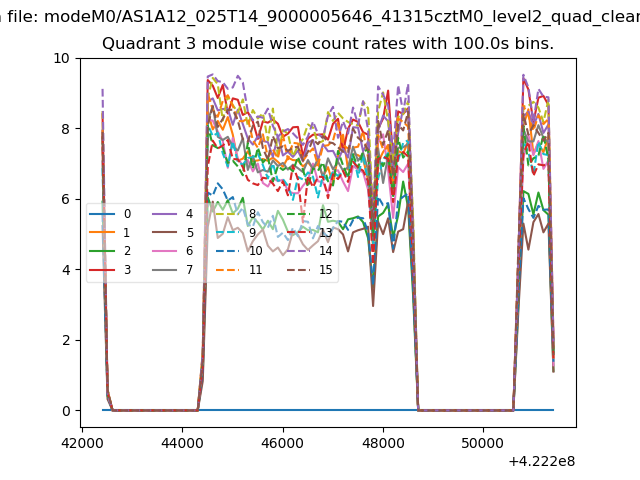 |
 |
| Parameter | Plot |
|---|---|
| CZT HV Monitor | 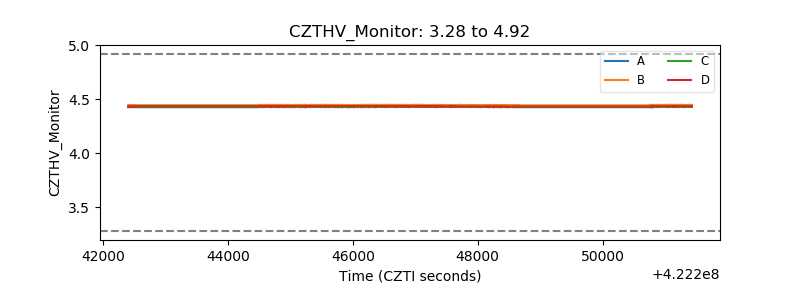 |
| D_VDD | 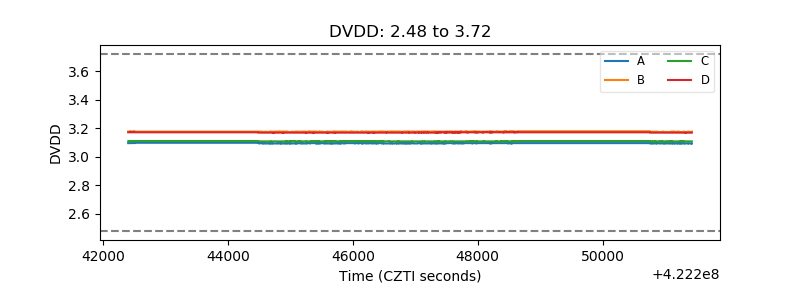 |
| Temperature 1 | 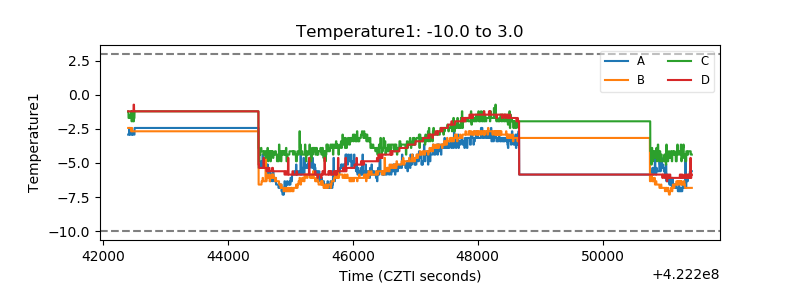 |
| Veto HV Monitor | 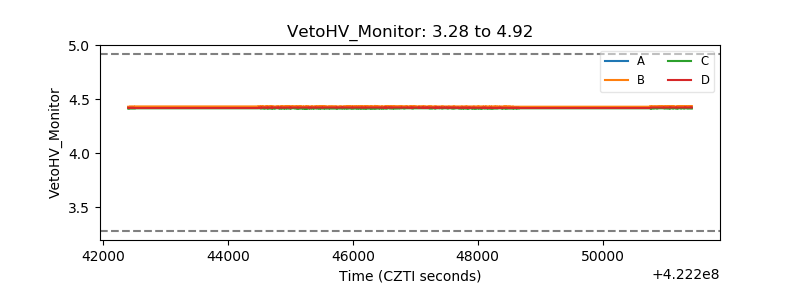 |
| Veto LLD | 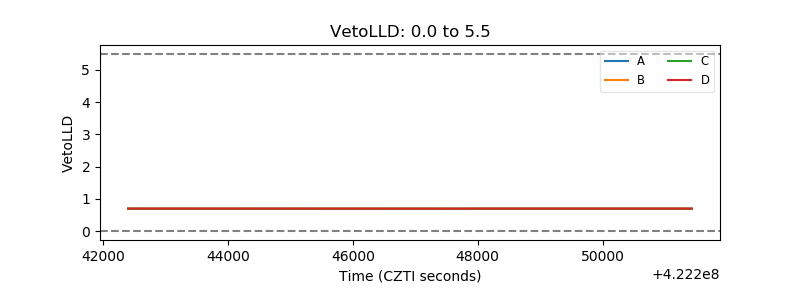 |
| Alpha Counter | 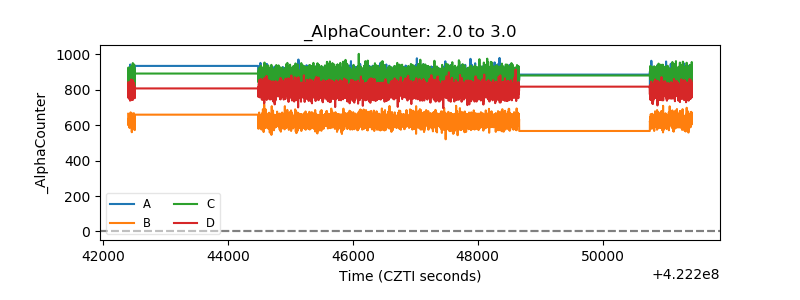 |
| _CPM_Rate | 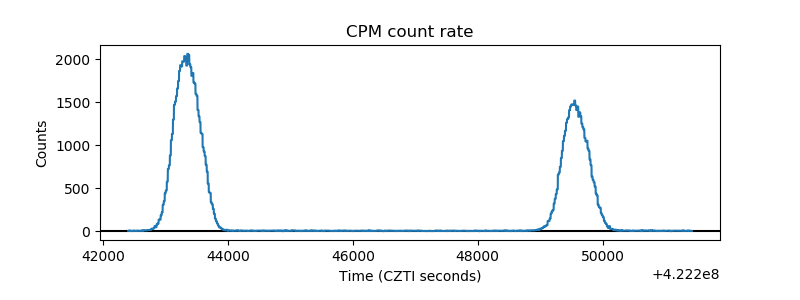 |
| CZT Counter | 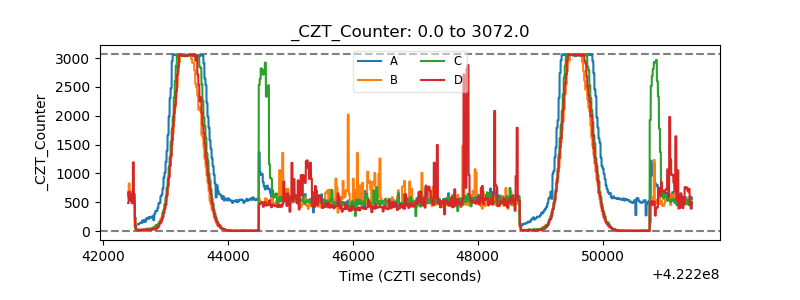 |
| +2.5 Volts monitor | 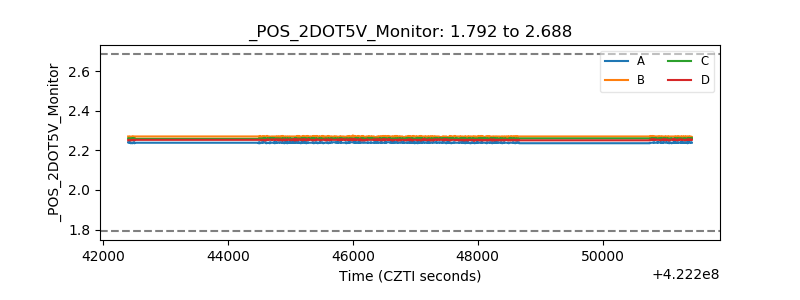 |
| +5 Volts monitor | 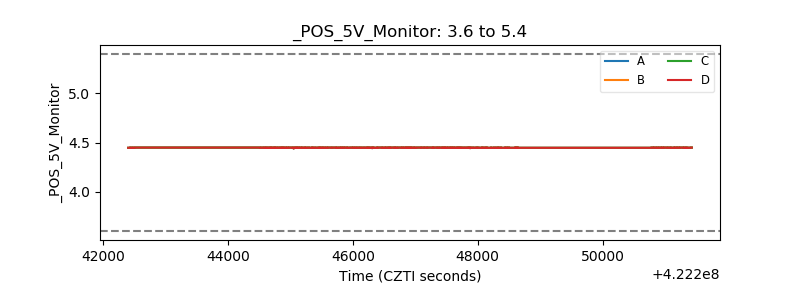 |
| _ROLL_ROT | 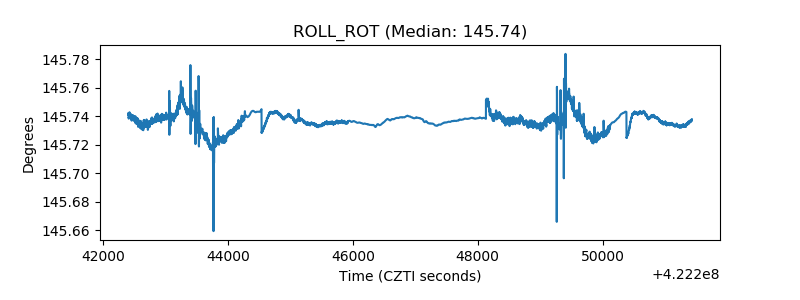 |
| _Roll_DEC | 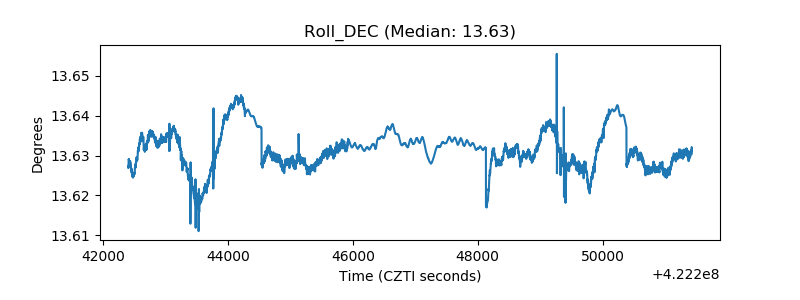 |
| _Roll_RA | 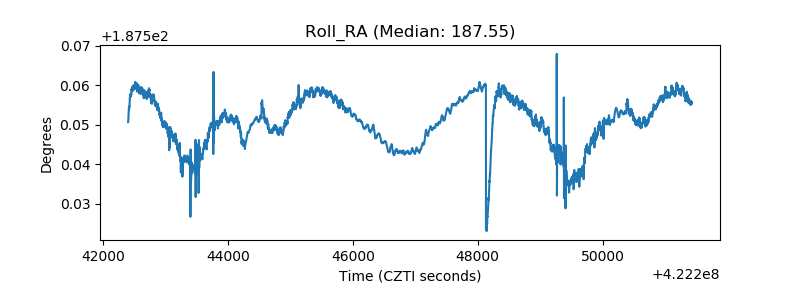 |
| Veto Counter | 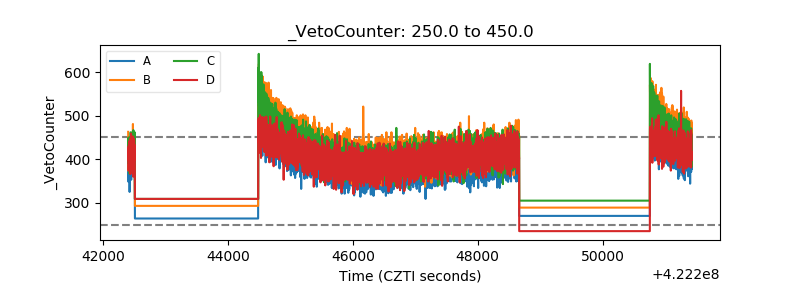 |