| Param | Original file | Final file |
|---|---|---|
| Filename | modeM0/AS1A12_025T14_9000005646_41316cztM0_level2.fits | modeM0/AS1A12_025T14_9000005646_41316cztM0_level2_quad_clean.evt |
| Size (bytes) | 344,027,520 | 89,248,320 |
| Size | 328.1 MB | 85.1 MB |
| Events in quadrant A | 2,855,140 | 614,082 |
| Events in quadrant B | 2,967,856 | 638,763 |
| Events in quadrant C | 3,288,742 | 560,024 |
| Events in quadrant D | 3,221,560 | 528,702 |
| Mode SS | |||
|---|---|---|---|
| Quadrant | BADHDUFLAG | Total packets | Discarded packets |
| A | 0 | 104 | 0 |
| B | 0 | 104 | 0 |
| C | 0 | 104 | 0 |
| D | 0 | 104 | 0 |
| Mode M0 | |||
|---|---|---|---|
| Quadrant | BADHDUFLAG | Total packets | Discarded packets |
| A | 0 | 11343 | 3 |
| B | 0 | 12373 | 2 |
| C | 0 | 12573 | 2 |
| D | 0 | 12990 | 2 |
| Mode M9 | |||
|---|---|---|---|
| Quadrant | BADHDUFLAG | Total packets | Discarded packets |
| A | 0 | 36 | 0 |
| B | 0 | 36 | 0 |
| C | 0 | 36 | 0 |
| D | 0 | 37 | 0 |
| Quadrant | Total seconds | Saturated seconds | Saturation percentage |
|---|---|---|---|
| A | 5157 | 9 | 0.174520% |
| B | 5157 | 10 | 0.193911% |
| C | 5157 | 289 | 5.604033% |
| D | 5157 | 178 | 3.451619% |
Noise dominated data is calculated using 1-second bins in cleaned event files. If a bin has >2000 counts, and if more than 50% of those come from <1% of pixels, then it is considered to be noise-dominated and hence unusable.
| Quadrant | # 1 sec bins | Bins with >0 counts | Bins with >2000 counts | High rate bins dominated by noise | Noise dominated (total time) | Noise dominated (detector-on time) | Marked lightcurve |
|---|---|---|---|---|---|---|---|
| A | 7280 | 5158 | 4 | 4 | 0.05% | 0.08% | 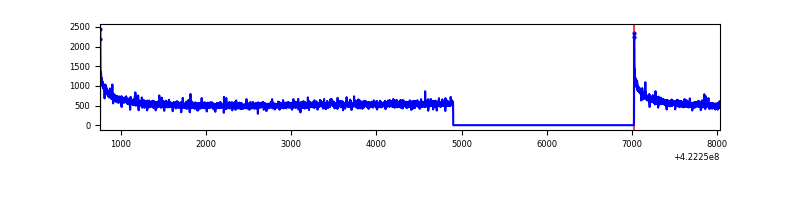 |
| B | 7280 | 5158 | 0 | 0 | 0.00% | 0.00% | 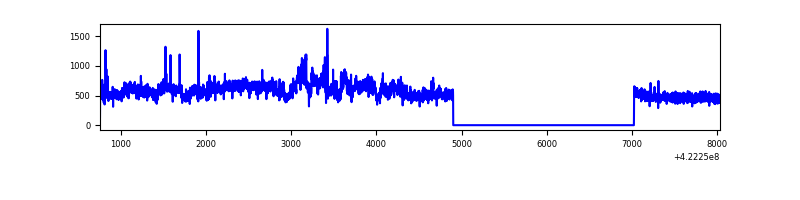 |
| C | 7280 | 5158 | 282 | 282 | 3.87% | 5.47% | 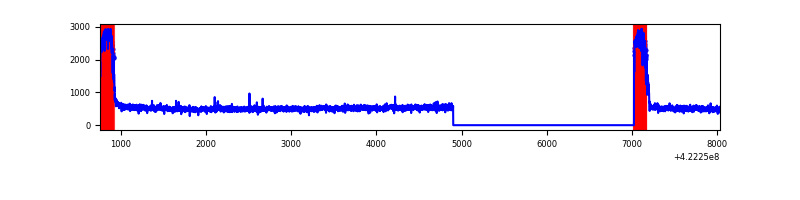 |
| D | 7280 | 5158 | 171 | 171 | 2.35% | 3.32% | 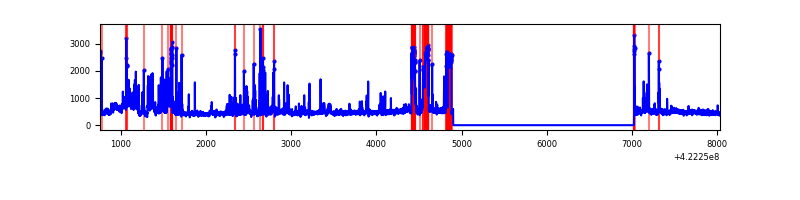 |
Top three noisy pixels from each quadrant. If the there are fewer than three noisy pixels in the level2.evt file, extra rows are filled as -1
| Pixel properties | Quadrant properties | ||||||
|---|---|---|---|---|---|---|---|
| Quadrant | DetID | PixID | Counts | Sigma | Mean | Median | Sigma |
| A | 10 | 83 | 495024 | 3981.57 | 606 | 593 | 124.2 |
| A | 13 | 6 | 9703 | 73.36 | 606 | 593 | 124.2 |
| A | 12 | 189 | 9215 | 69.43 | 606 | 593 | 124.2 |
| B | 0 | 229 | 532031 | 4520.03 | 603 | 586 | 117.6 |
| B | 5 | 255 | 37313 | 312.37 | 603 | 586 | 117.6 |
| B | 7 | 202 | 15088 | 123.34 | 603 | 586 | 117.6 |
| C | 0 | 10 | 880028 | 6608.3 | 562 | 565 | 133.1 |
| C | 15 | 214 | 213597 | 1600.73 | 562 | 565 | 133.1 |
| C | 15 | 143 | 4175 | 27.13 | 562 | 565 | 133.1 |
| D | 13 | 249 | 412423 | 2919.82 | 572 | 556 | 141.1 |
| D | 2 | 120 | 261202 | 1847.78 | 572 | 556 | 141.1 |
| D | 1 | 47 | 136121 | 961.05 | 572 | 556 | 141.1 |
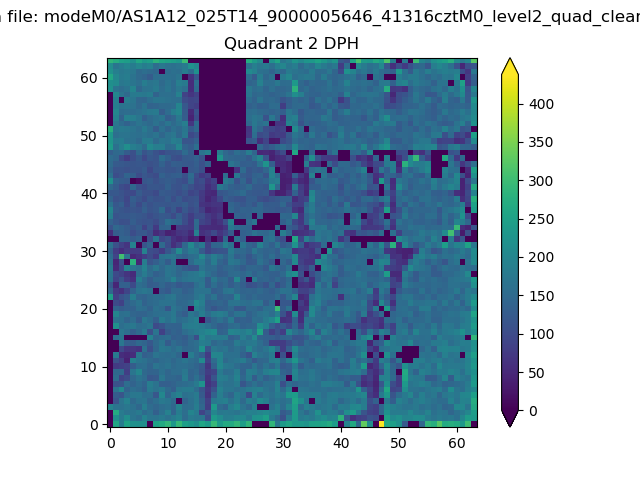
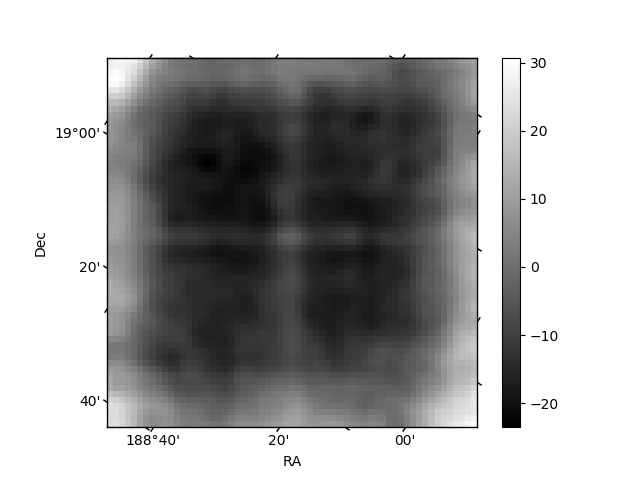
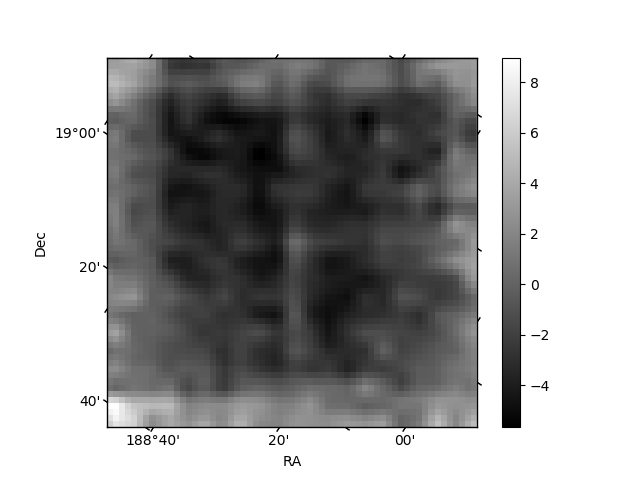
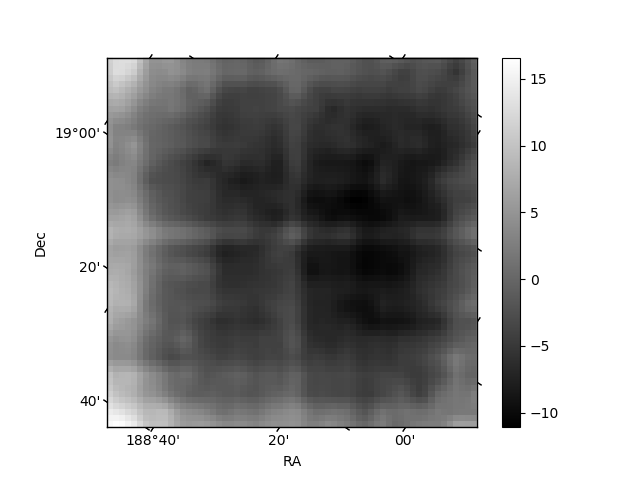
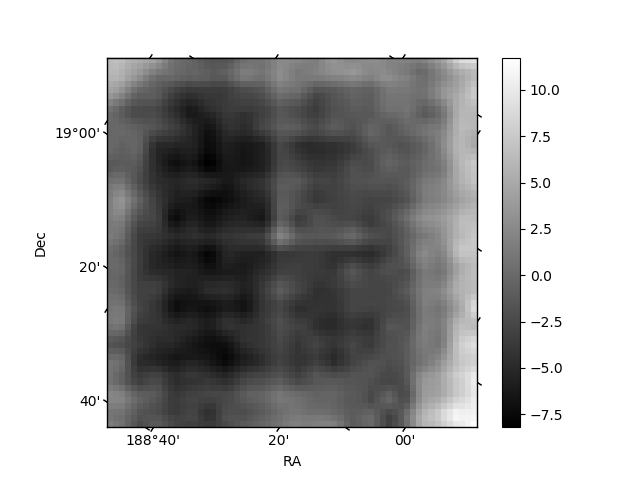
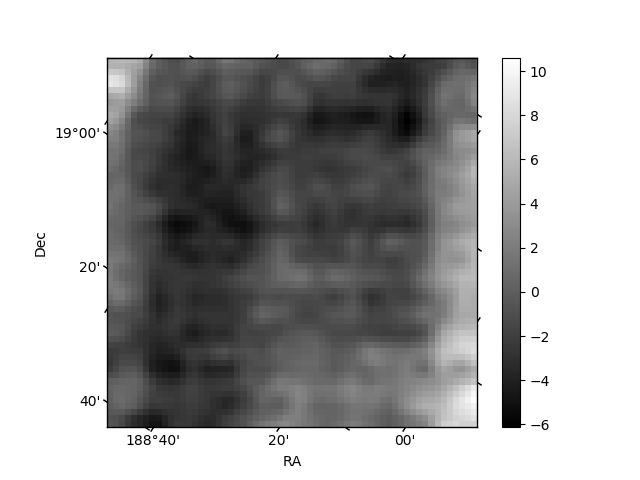
Histogram calculated using DETX and DETY for each event in the final _common_clean file
| Quadrant A | 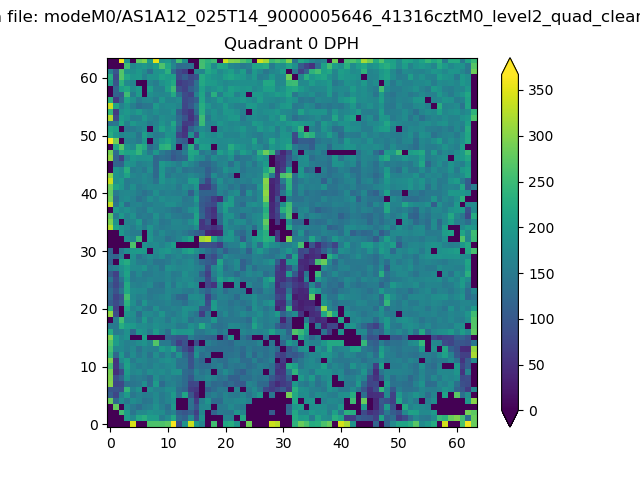 |
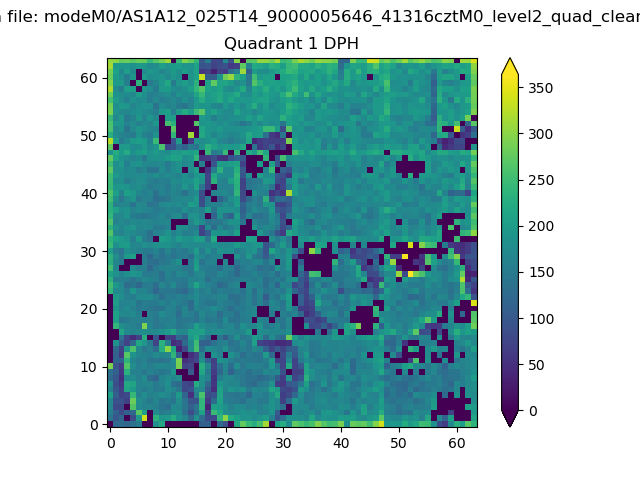 |
Quadrant B |
|---|---|---|---|
| Quadrant D | 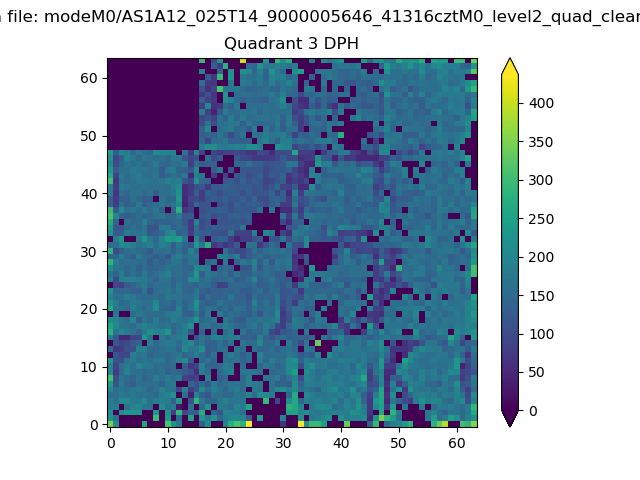 |
 |
Quadrant C |
| Plot type | Count rate plots | Images |
|---|---|---|
| Comparison with Poisson distribution Blue bars denote a histogram of data divided into 1 sec bins. Red curve is a Poisson curve with rate = median count rate of data. |
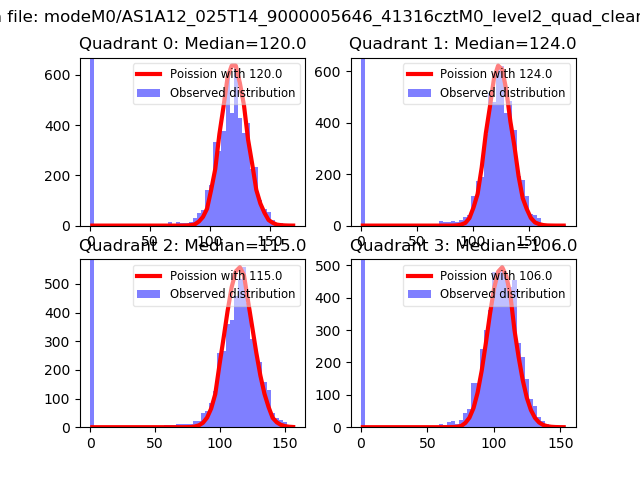 |
 |
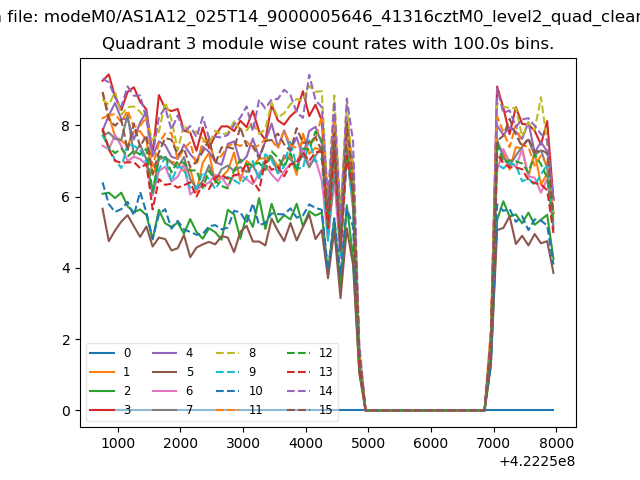
| Quadrant-wise count rates Data is divided into 100 sec bins |
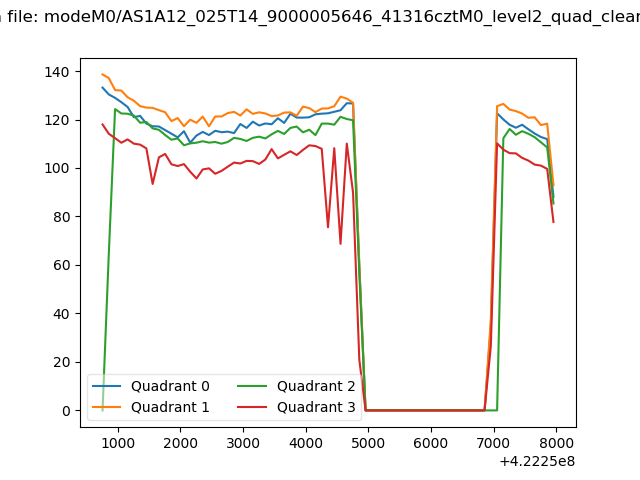 |
|
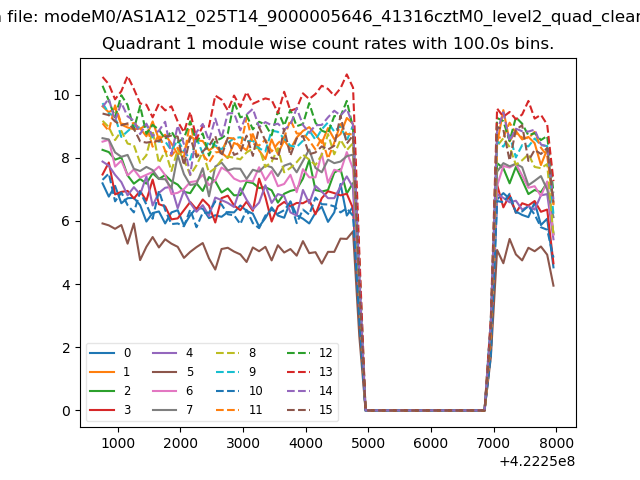
| Module-wise count rates for Quadrant A Data is divided into 100 sec bins |
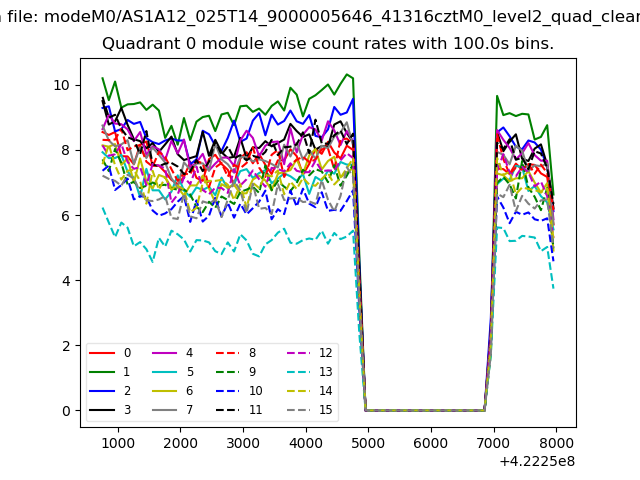 |
 |
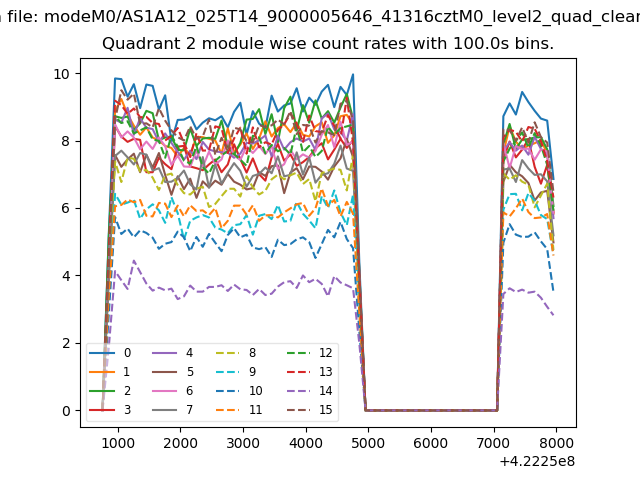
| Module-wise count rates for Quadrant B Data is divided into 100 sec bins |
 |
 |
| Module-wise count rates for Quadrant C Data is divided into 100 sec bins |
 |
 |
| Module-wise count rates for Quadrant D Data is divided into 100 sec bins |
 |
 |
| Parameter | Plot |
|---|---|
| CZT HV Monitor | 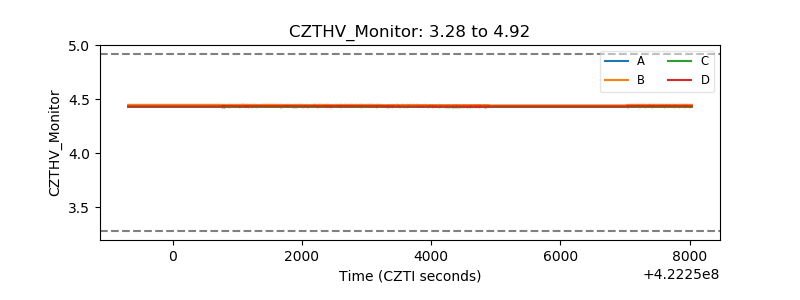 |
| D_VDD | 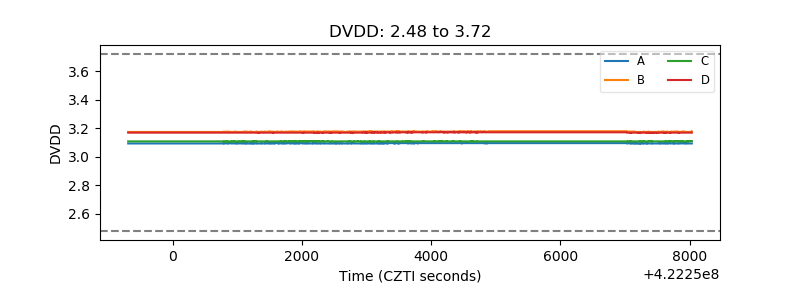 |
| Temperature 1 |  |
| Veto HV Monitor | 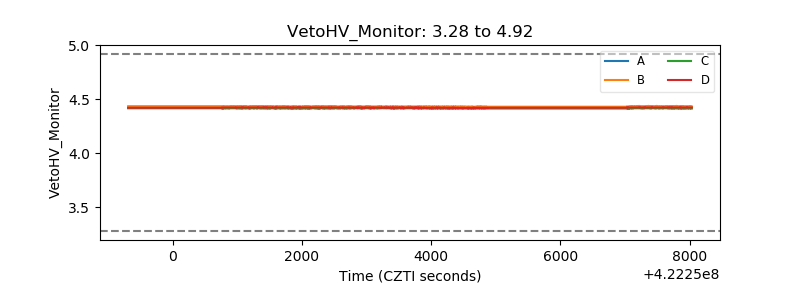 |
| Veto LLD | 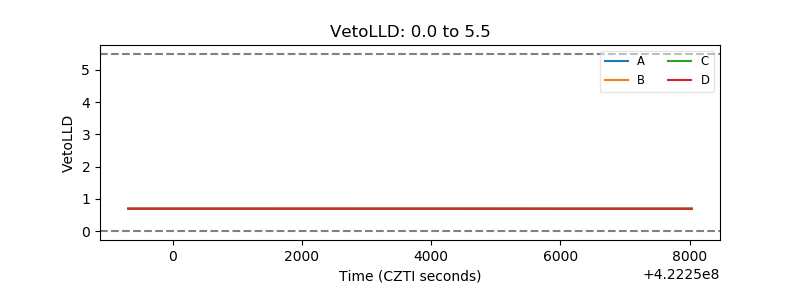 |
| Alpha Counter | 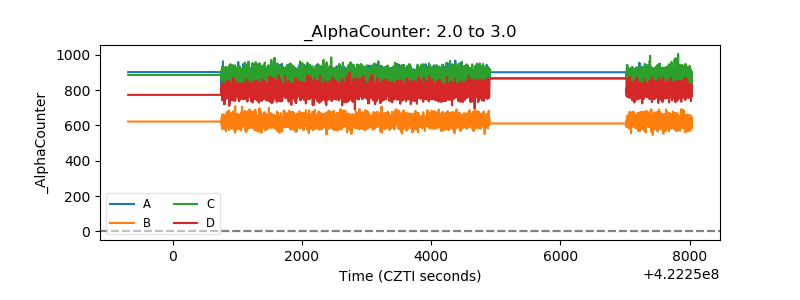 |
| _CPM_Rate | 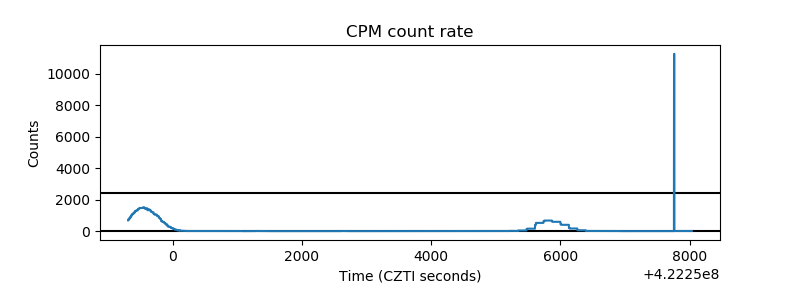 |
| CZT Counter | 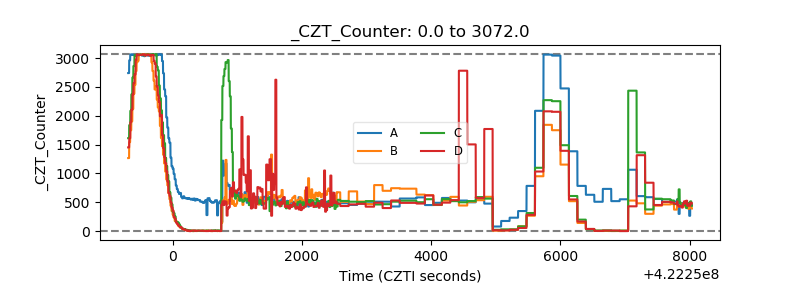 |
| +2.5 Volts monitor | 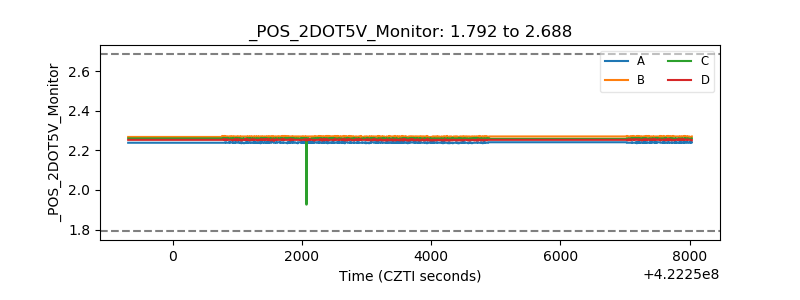 |
| +5 Volts monitor | 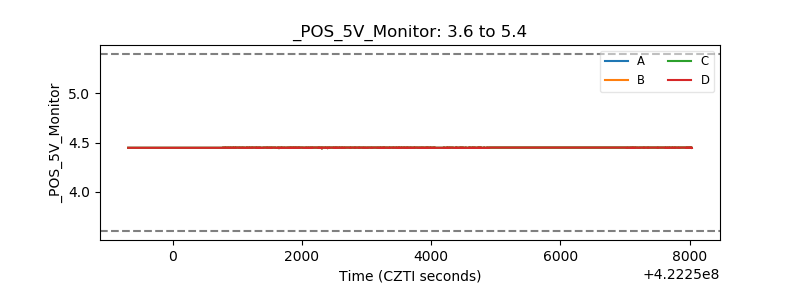 |
| _ROLL_ROT | 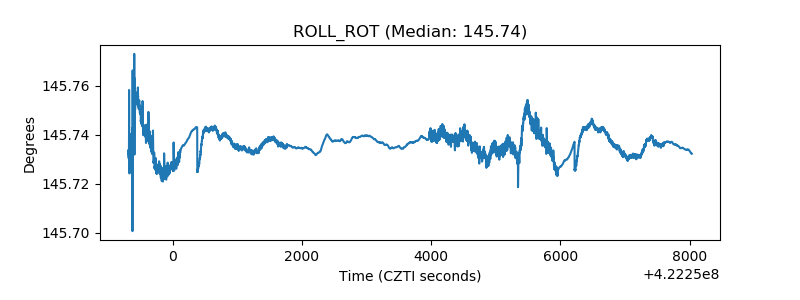 |
| _Roll_DEC | 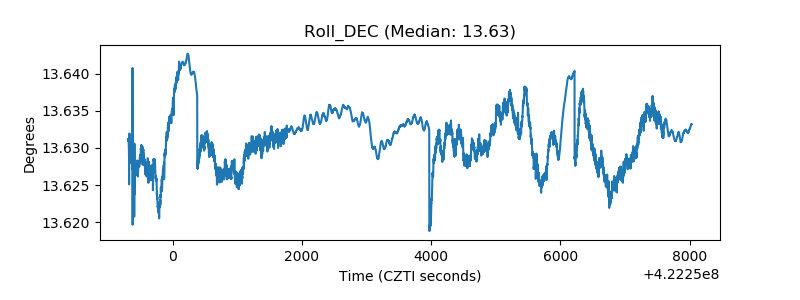 |
| _Roll_RA | 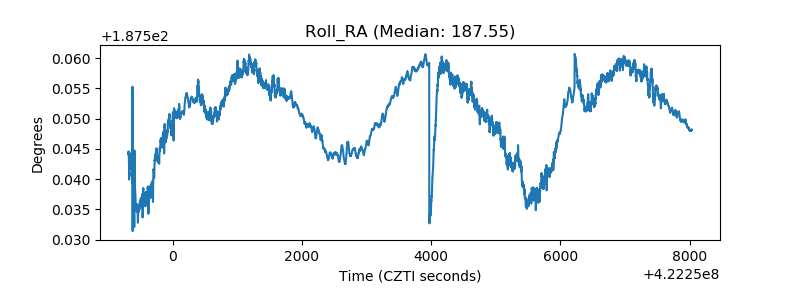 |
| Veto Counter | 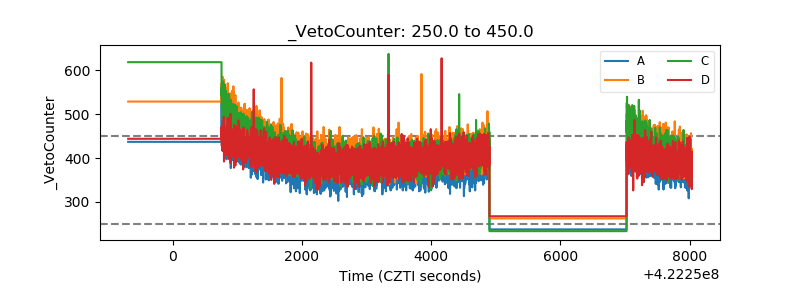 |