| Param | Original file | Final file |
|---|---|---|
| Filename | modeM0/AS1A12_025T14_9000005646_41317cztM0_level2.fits | modeM0/AS1A12_025T14_9000005646_41317cztM0_level2_quad_clean.evt |
| Size (bytes) | 223,286,400 | 62,447,040 |
| Size | 212.9 MB | 59.6 MB |
| Events in quadrant A | 1,960,328 | 424,668 |
| Events in quadrant B | 1,698,616 | 441,233 |
| Events in quadrant C | 2,108,356 | 393,966 |
| Events in quadrant D | 2,210,467 | 371,613 |
| Mode SS | |||
|---|---|---|---|
| Quadrant | BADHDUFLAG | Total packets | Discarded packets |
| A | 0 | 72 | 0 |
| B | 0 | 72 | 0 |
| C | 0 | 72 | 0 |
| D | 0 | 72 | 0 |
| Mode M0 | |||
|---|---|---|---|
| Quadrant | BADHDUFLAG | Total packets | Discarded packets |
| A | 0 | 7830 | 1 |
| B | 0 | 7423 | 1 |
| C | 0 | 8367 | 1 |
| D | 0 | 9033 | 1 |
| Mode M9 | |||
|---|---|---|---|
| Quadrant | BADHDUFLAG | Total packets | Discarded packets |
| A | 0 | 9 | 0 |
| B | 0 | 9 | 0 |
| C | 0 | 9 | 0 |
| D | 0 | 10 | 0 |
| Quadrant | Total seconds | Saturated seconds | Saturation percentage |
|---|---|---|---|
| A | 3674 | 6 | 0.163310% |
| B | 3674 | 5 | 0.136091% |
| C | 3674 | 138 | 3.756124% |
| D | 3674 | 79 | 2.150245% |
Noise dominated data is calculated using 1-second bins in cleaned event files. If a bin has >2000 counts, and if more than 50% of those come from <1% of pixels, then it is considered to be noise-dominated and hence unusable.
| Quadrant | # 1 sec bins | Bins with >0 counts | Bins with >2000 counts | High rate bins dominated by noise | Noise dominated (total time) | Noise dominated (detector-on time) | Marked lightcurve |
|---|---|---|---|---|---|---|---|
| A | 3674 | 3674 | 2 | 2 | 0.05% | 0.05% | 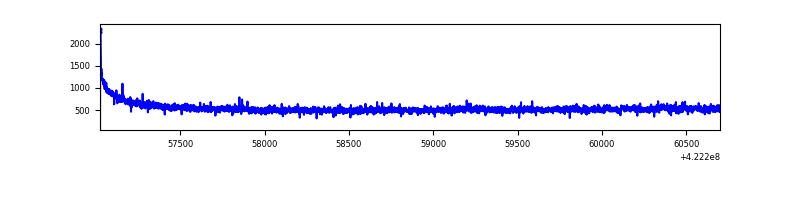 |
| B | 3674 | 3674 | 2 | 2 | 0.05% | 0.05% | 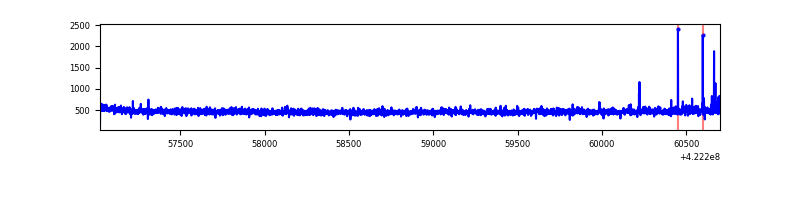 |
| C | 3674 | 3674 | 134 | 134 | 3.65% | 3.65% | 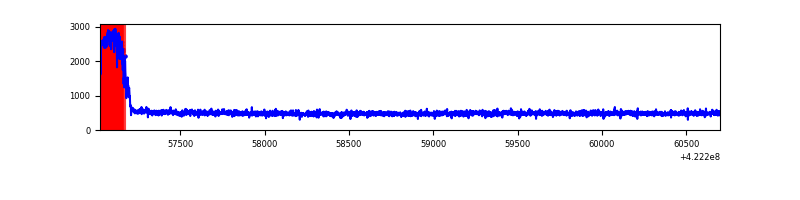 |
| D | 3674 | 3674 | 74 | 74 | 2.01% | 2.01% | 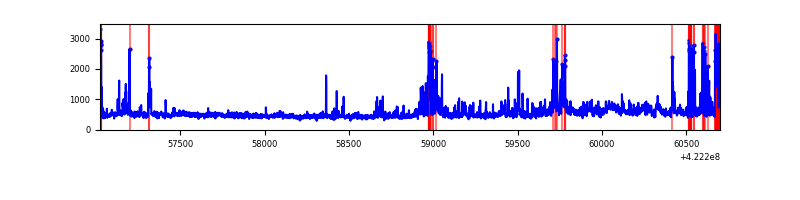 |
Top three noisy pixels from each quadrant. If the there are fewer than three noisy pixels in the level2.evt file, extra rows are filled as -1
| Pixel properties | Quadrant properties | ||||||
|---|---|---|---|---|---|---|---|
| Quadrant | DetID | PixID | Counts | Sigma | Mean | Median | Sigma |
| A | 10 | 83 | 309479 | 3529.98 | 422 | 413 | 87.6 |
| A | 12 | 189 | 17505 | 195.22 | 422 | 413 | 87.6 |
| A | 3 | 137 | 4791 | 50.0 | 422 | 413 | 87.6 |
| B | 0 | 245 | 23829 | 284.45 | 417 | 406 | 82.3 |
| B | 7 | 202 | 18364 | 218.08 | 417 | 406 | 82.3 |
| B | 12 | 111 | 10301 | 120.17 | 417 | 406 | 82.3 |
| C | 0 | 10 | 403395 | 4298.38 | 398 | 400 | 93.8 |
| C | 15 | 214 | 152288 | 1620.05 | 398 | 400 | 93.8 |
| C | 13 | 61 | 2599 | 23.45 | 398 | 400 | 93.8 |
| D | 2 | 120 | 211167 | 2107.84 | 403 | 390 | 100.0 |
| D | 13 | 249 | 207234 | 2068.51 | 403 | 390 | 100.0 |
| D | 5 | 222 | 107501 | 1071.15 | 403 | 390 | 100.0 |
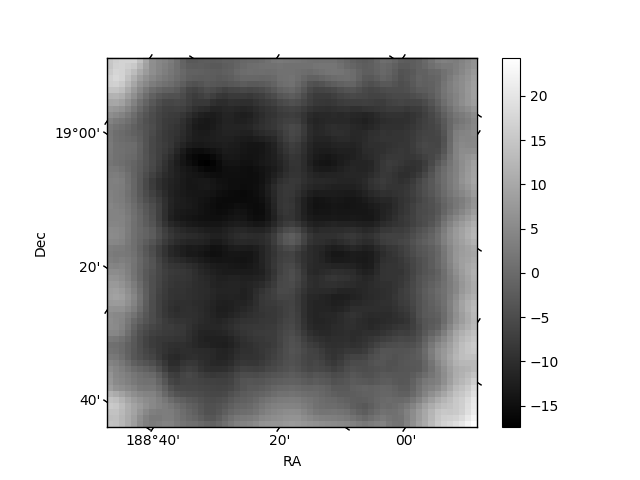
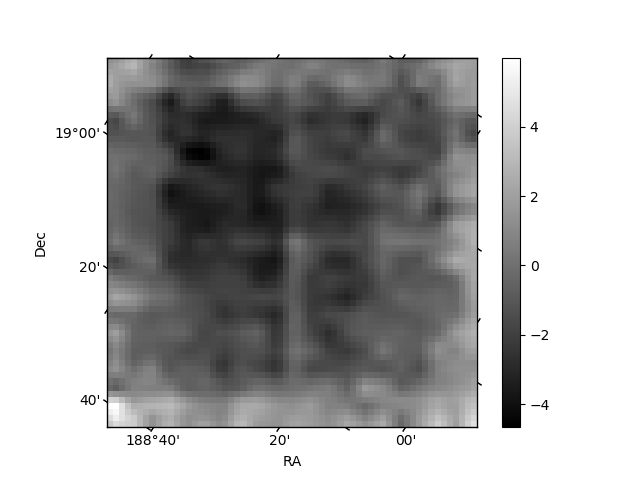
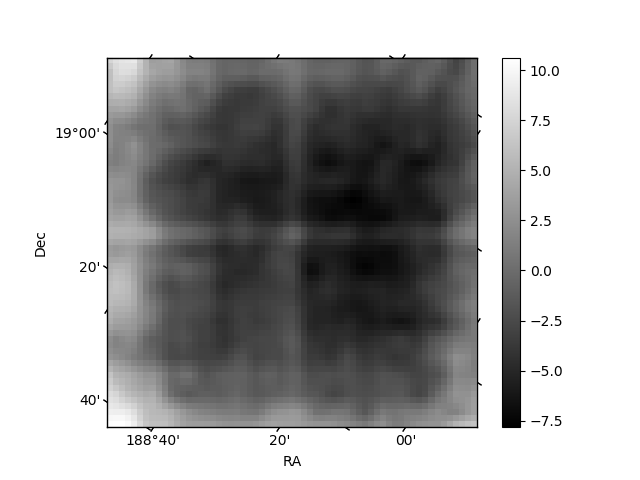
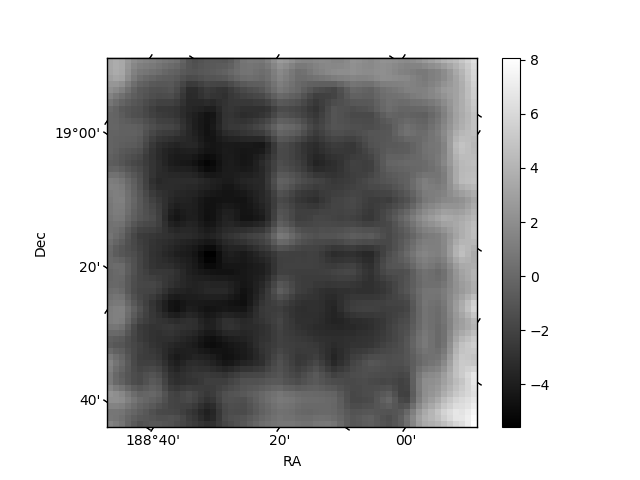
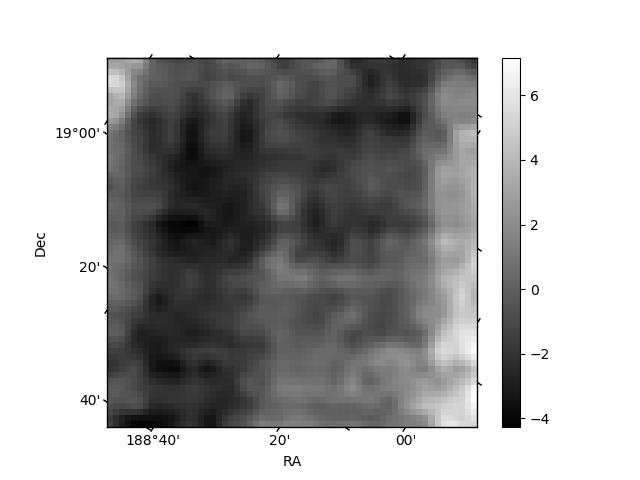
Histogram calculated using DETX and DETY for each event in the final _common_clean file
| Quadrant A | 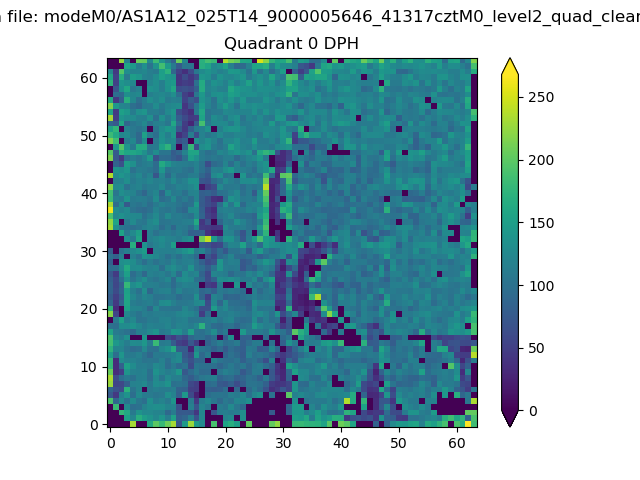 |
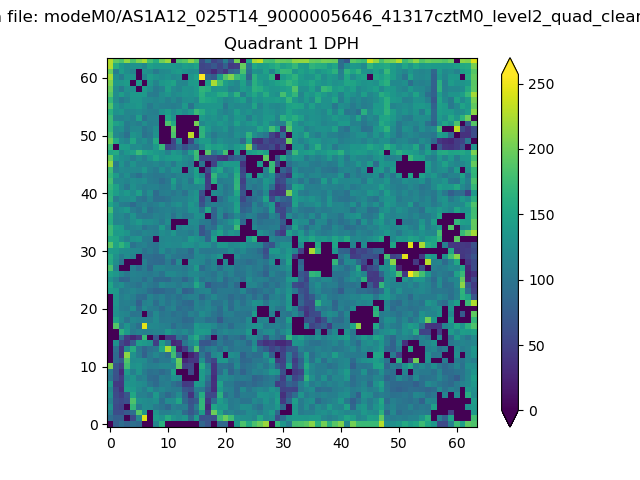 |
Quadrant B |
|---|---|---|---|
| Quadrant D | 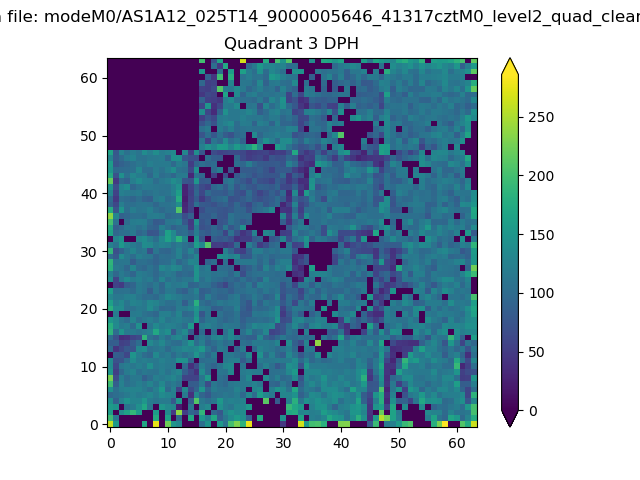 |
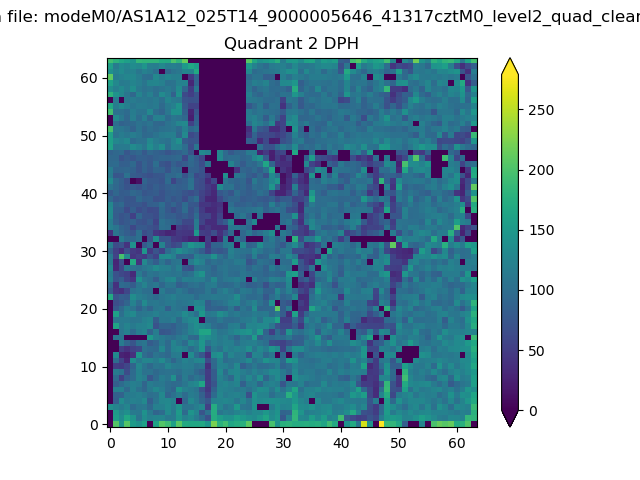 |
Quadrant C |
| Plot type | Count rate plots | Images |
|---|---|---|
| Comparison with Poisson distribution Blue bars denote a histogram of data divided into 1 sec bins. Red curve is a Poisson curve with rate = median count rate of data. |
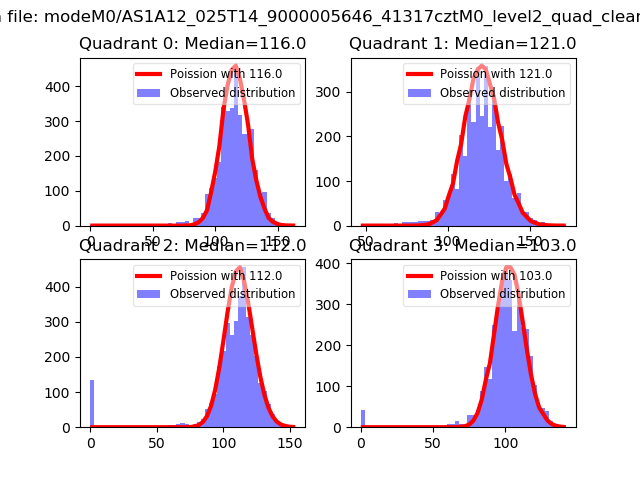 |
 |
| Quadrant-wise count rates Data is divided into 100 sec bins |
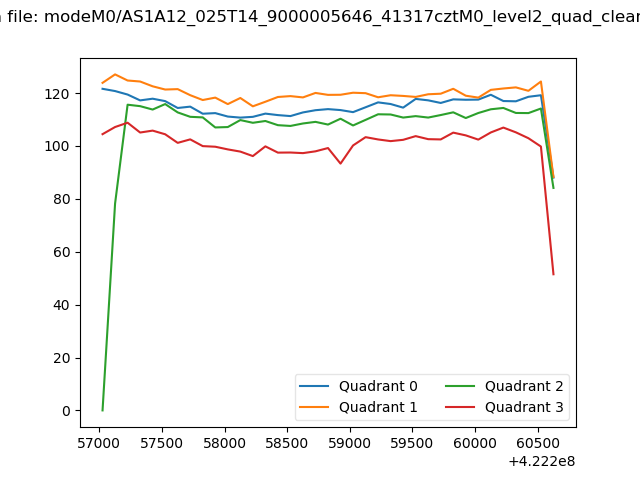 |
|
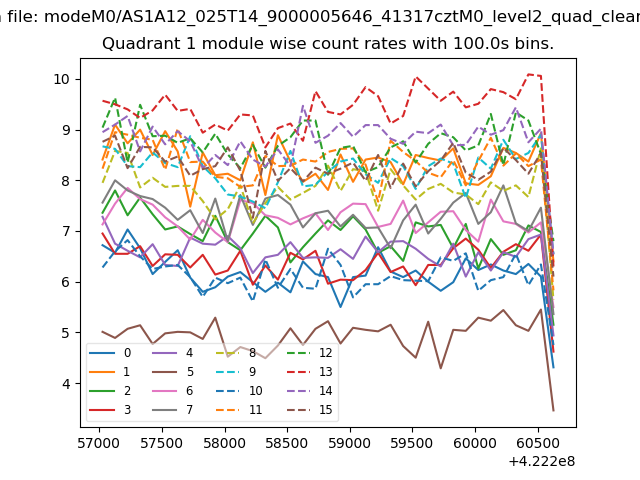
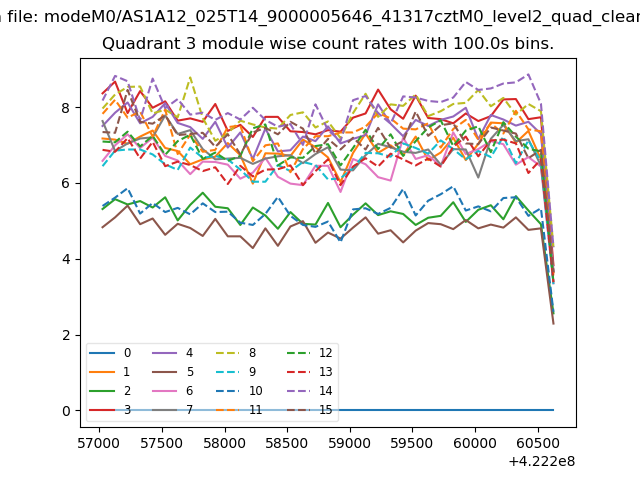
| Module-wise count rates for Quadrant A Data is divided into 100 sec bins |
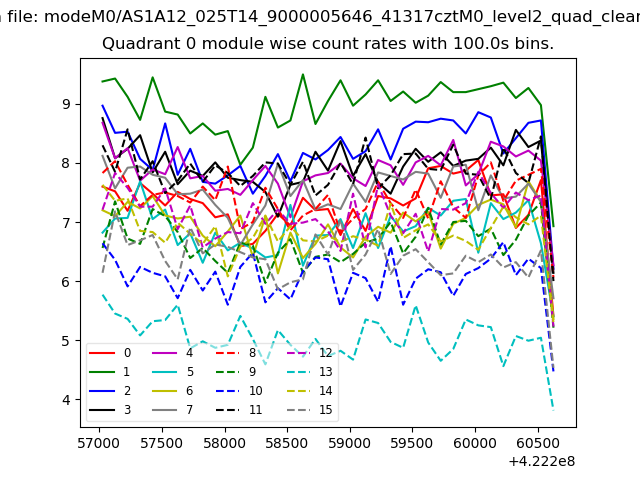 |
 |
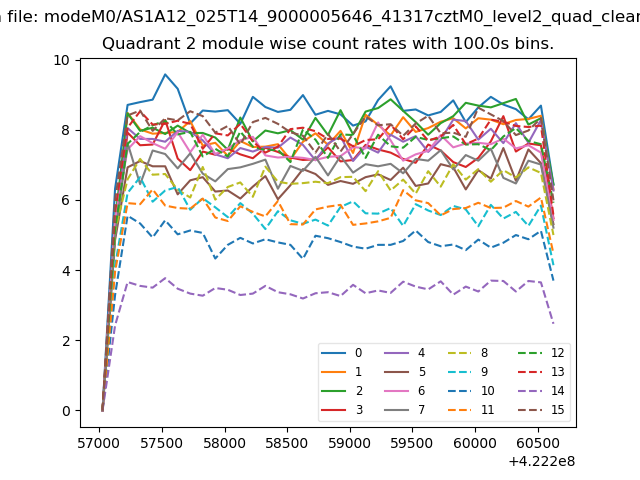
| Module-wise count rates for Quadrant B Data is divided into 100 sec bins |
 |
 |
| Module-wise count rates for Quadrant C Data is divided into 100 sec bins |
 |
 |
| Module-wise count rates for Quadrant D Data is divided into 100 sec bins |
 |
 |
| Parameter | Plot |
|---|---|
| CZT HV Monitor | 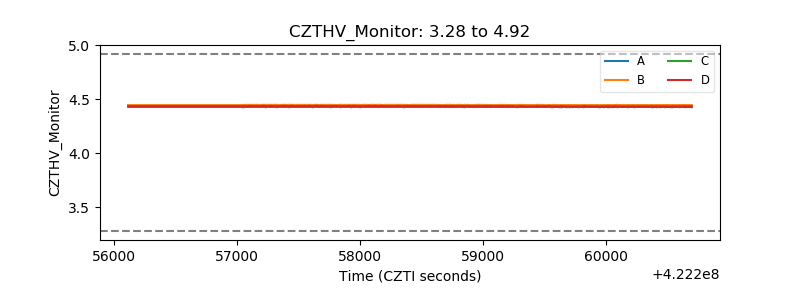 |
| D_VDD | 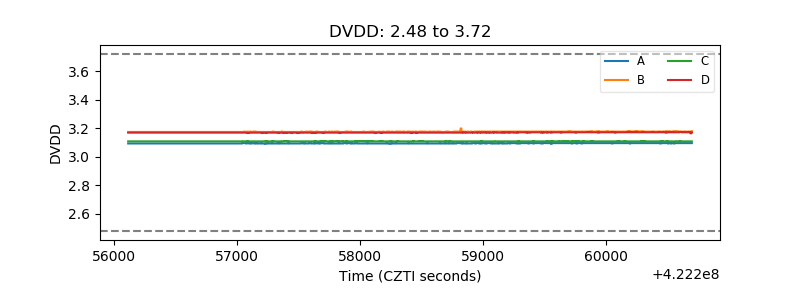 |
| Temperature 1 | 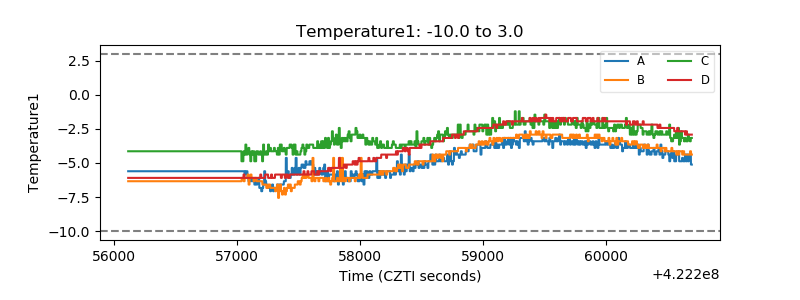 |
| Veto HV Monitor | 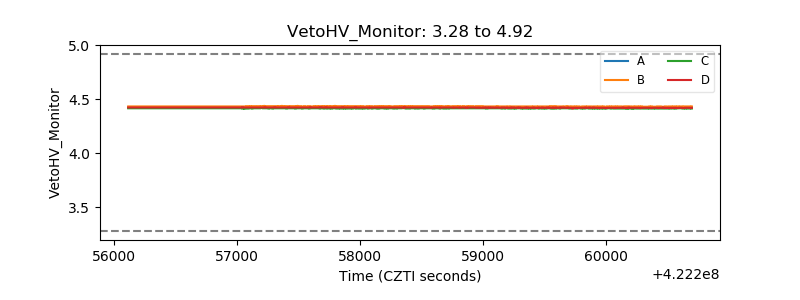 |
| Veto LLD | 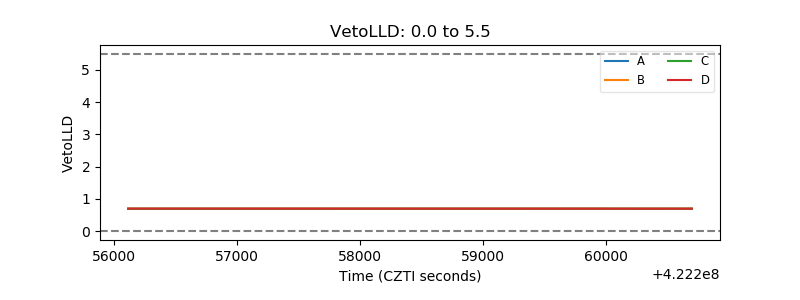 |
| Alpha Counter | 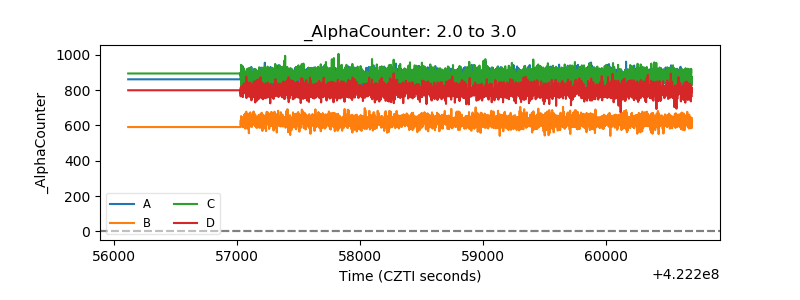 |
| _CPM_Rate | 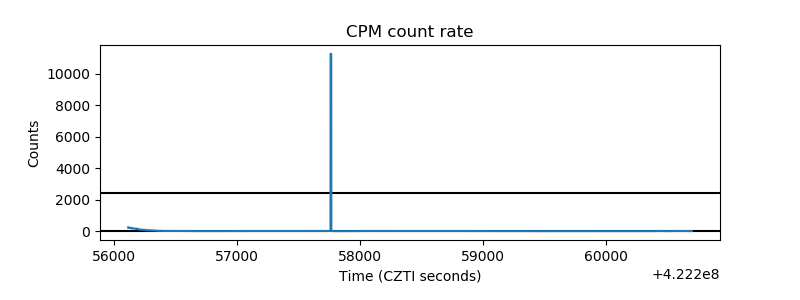 |
| CZT Counter | 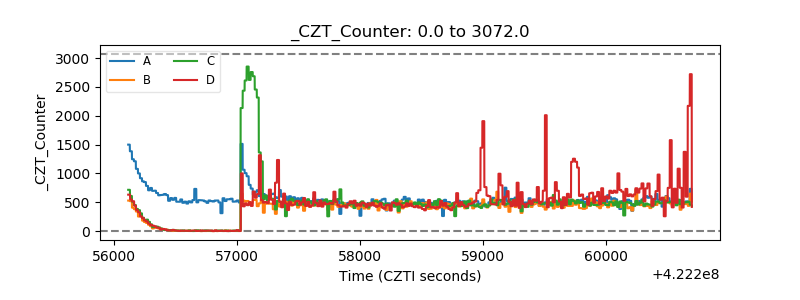 |
| +2.5 Volts monitor |  |
| +5 Volts monitor | 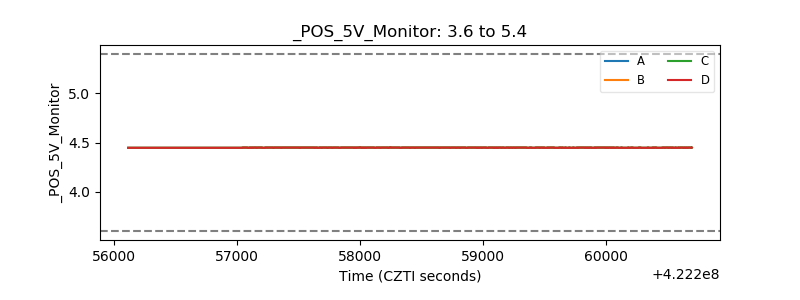 |
| _ROLL_ROT | 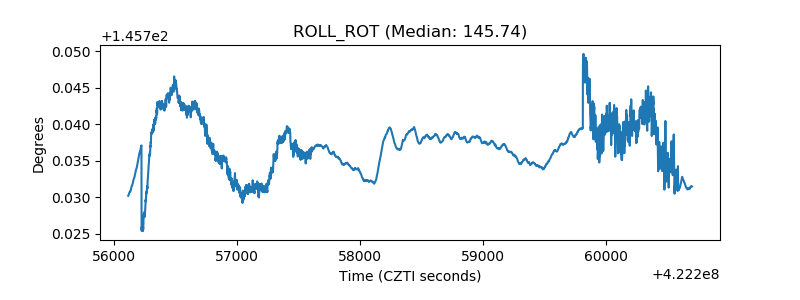 |
| _Roll_DEC | 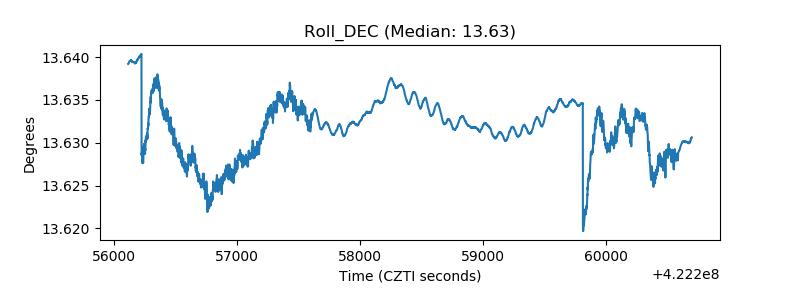 |
| _Roll_RA | 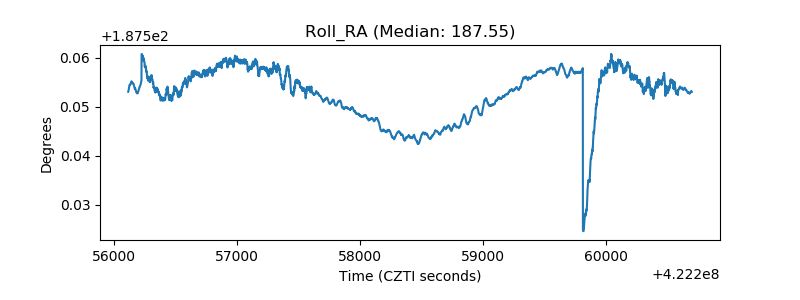 |
| Veto Counter | 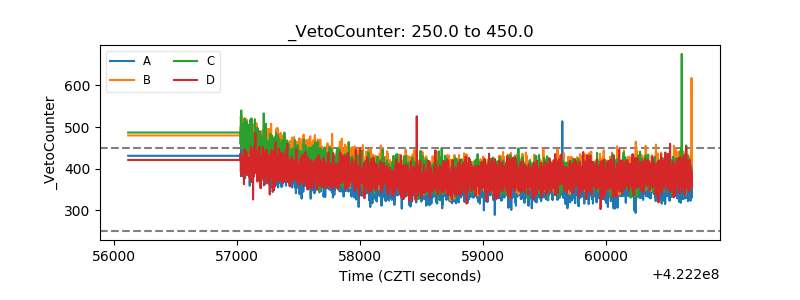 |