| Param | Original file | Final file |
|---|---|---|
| Filename | modeM0/AS1A12_025T15_9000005648_41317cztM0_level2.fits | modeM0/AS1A12_025T15_9000005648_41317cztM0_level2_quad_clean.evt |
| Size (bytes) | 77,270,400 | 19,209,600 |
| Size | 73.7 MB | 18.3 MB |
| Events in quadrant A | 705,064 | 130,168 |
| Events in quadrant B | 552,607 | 135,984 |
| Events in quadrant C | 898,026 | 111,704 |
| Events in quadrant D | 611,194 | 115,948 |
| Mode M0 | |||
|---|---|---|---|
| Quadrant | BADHDUFLAG | Total packets | Discarded packets |
| A | 0 | 2797 | 2 |
| B | 0 | 2376 | 1 |
| C | 0 | 3326 | 1 |
| D | 0 | 2597 | 1 |
| Mode M9 | |||
|---|---|---|---|
| Quadrant | BADHDUFLAG | Total packets | Discarded packets |
| A | 0 | 21 | 0 |
| B | 0 | 21 | 0 |
| C | 0 | 21 | 0 |
| D | 0 | 21 | 0 |
| Mode SS | |||
|---|---|---|---|
| Quadrant | BADHDUFLAG | Total packets | Discarded packets |
| A | 0 | 26 | 0 |
| B | 0 | 26 | 0 |
| C | 0 | 26 | 0 |
| D | 0 | 26 | 0 |
| Quadrant | Total seconds | Saturated seconds | Saturation percentage |
|---|---|---|---|
| A | 1163 | 5 | 0.429923% |
| B | 1163 | 3 | 0.257954% |
| C | 1163 | 143 | 12.295787% |
| D | 1163 | 15 | 1.289768% |
Noise dominated data is calculated using 1-second bins in cleaned event files. If a bin has >2000 counts, and if more than 50% of those come from <1% of pixels, then it is considered to be noise-dominated and hence unusable.
| Quadrant | # 1 sec bins | Bins with >0 counts | Bins with >2000 counts | High rate bins dominated by noise | Noise dominated (total time) | Noise dominated (detector-on time) | Marked lightcurve |
|---|---|---|---|---|---|---|---|
| A | 3256 | 1164 | 2 | 2 | 0.06% | 0.17% | 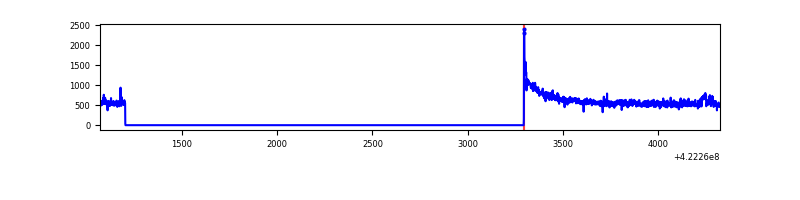 |
| B | 3256 | 1164 | 0 | 0 | 0.00% | 0.00% | 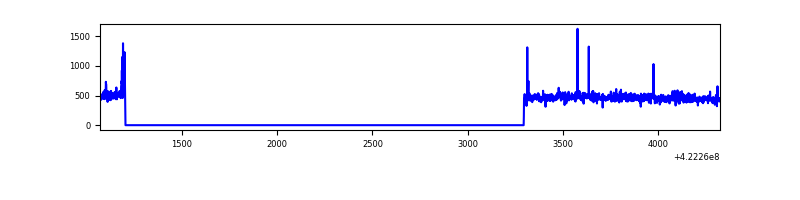 |
| C | 3256 | 1164 | 144 | 144 | 4.42% | 12.37% | 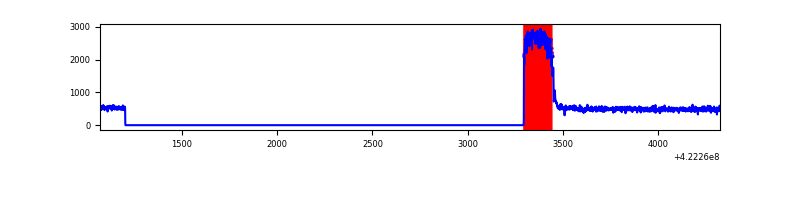 |
| D | 3256 | 1164 | 14 | 14 | 0.43% | 1.20% | 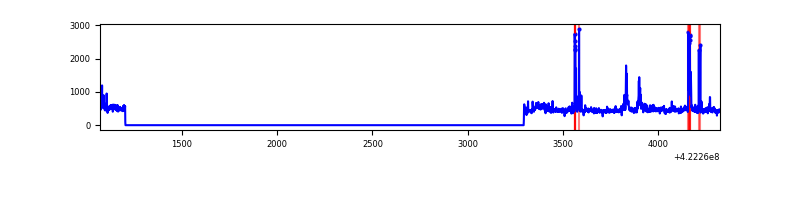 |
Top three noisy pixels from each quadrant. If the there are fewer than three noisy pixels in the level2.evt file, extra rows are filled as -1
| Pixel properties | Quadrant properties | ||||||
|---|---|---|---|---|---|---|---|
| Quadrant | DetID | PixID | Counts | Sigma | Mean | Median | Sigma |
| A | 10 | 83 | 164246 | 5550.57 | 134 | 131 | 29.6 |
| A | 12 | 189 | 14674 | 491.86 | 134 | 131 | 29.6 |
| A | 13 | 6 | 4408 | 144.65 | 134 | 131 | 29.6 |
| B | 0 | 229 | 6817 | 237.46 | 134 | 130 | 28.2 |
| B | 5 | 252 | 6675 | 232.42 | 134 | 130 | 28.2 |
| B | 5 | 255 | 3936 | 135.15 | 134 | 130 | 28.2 |
| C | 0 | 10 | 380491 | 12871.04 | 119 | 120 | 29.6 |
| C | 15 | 214 | 50285 | 1697.49 | 119 | 120 | 29.6 |
| C | 12 | 249 | 939 | 27.71 | 119 | 120 | 29.6 |
| D | 2 | 249 | 37525 | 1121.17 | 128 | 123 | 33.4 |
| D | 5 | 222 | 28307 | 844.85 | 128 | 123 | 33.4 |
| D | 2 | 120 | 24581 | 733.16 | 128 | 123 | 33.4 |
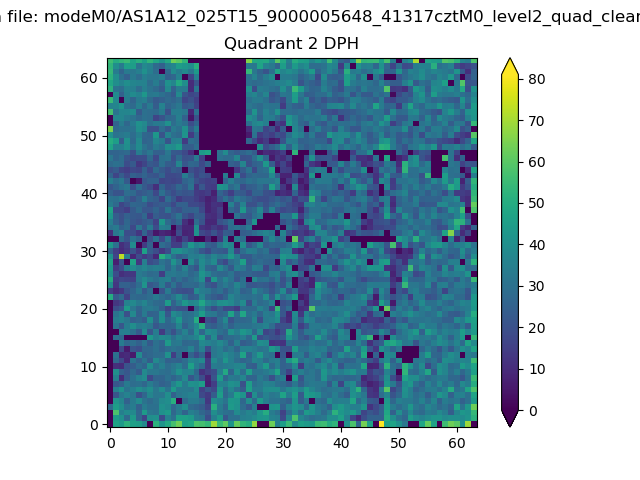
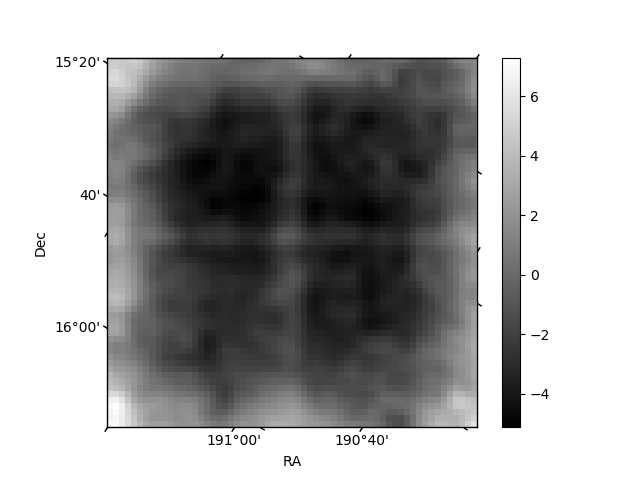
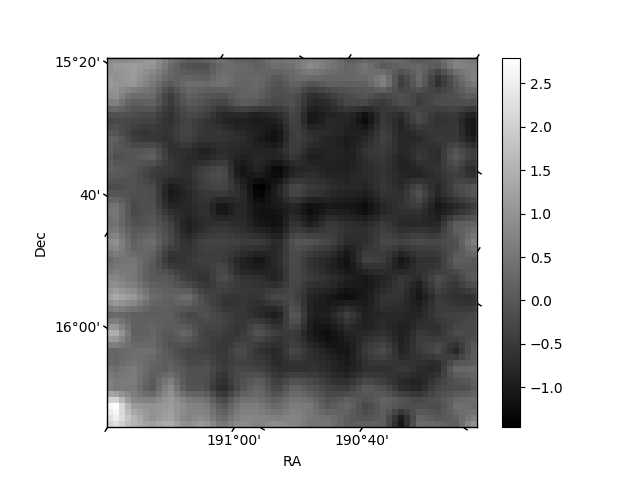
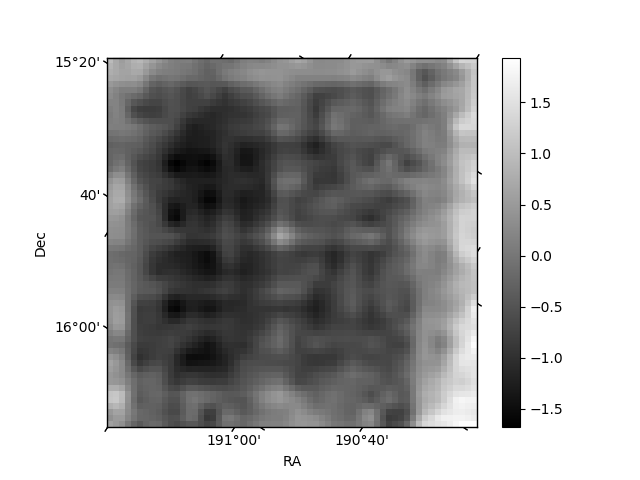
Histogram calculated using DETX and DETY for each event in the final _common_clean file
| Quadrant A | 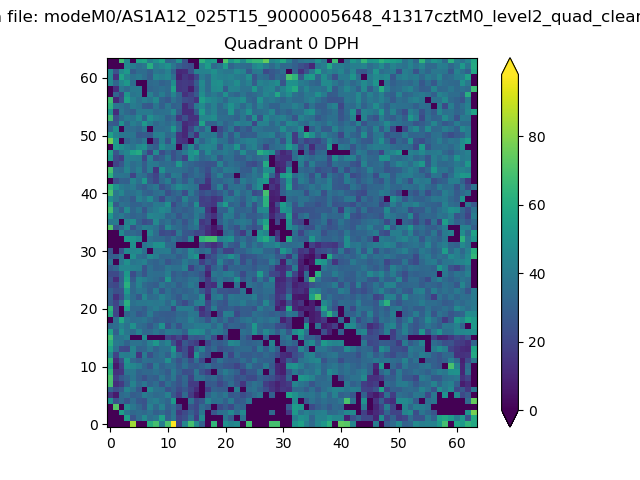 |
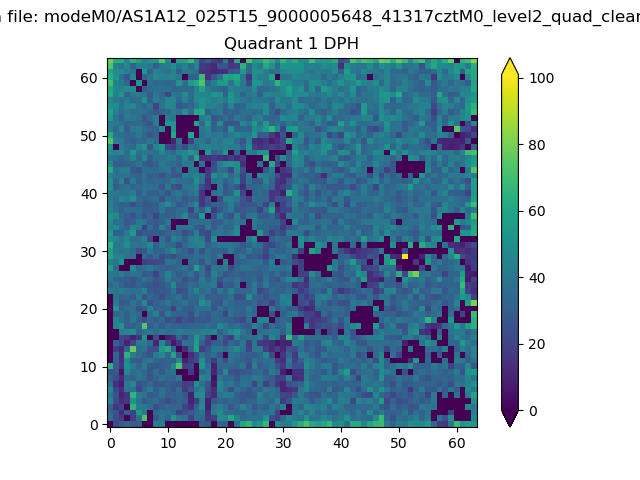 |
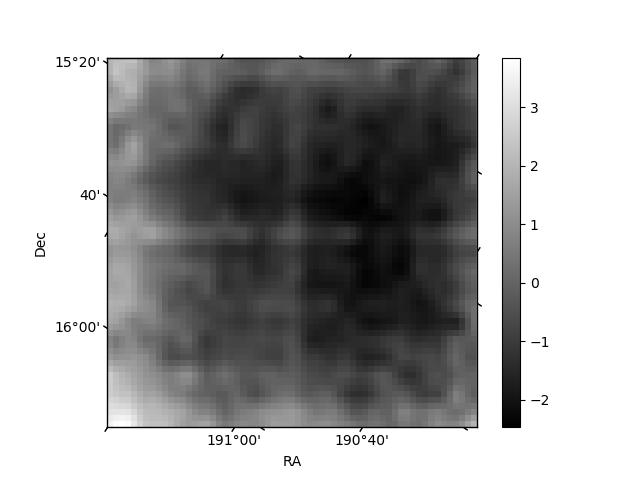
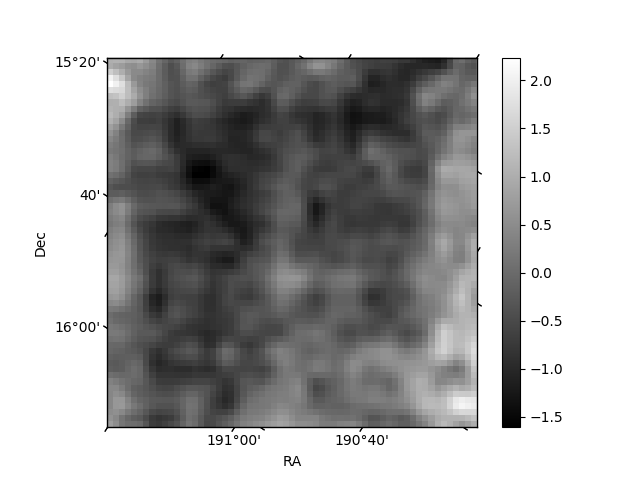
Quadrant B |
|---|---|---|---|
| Quadrant D | 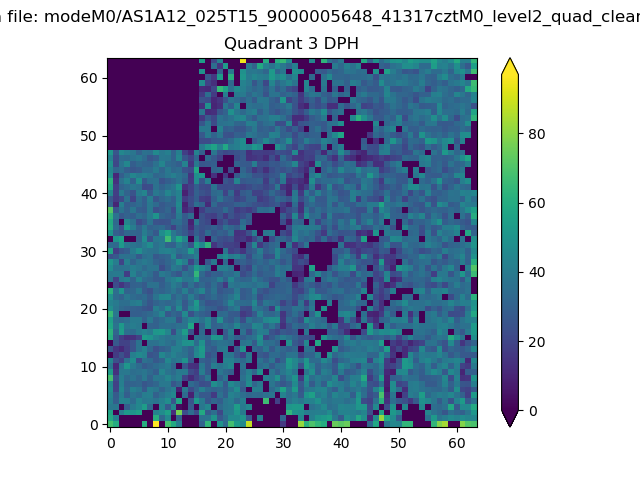 |
 |
Quadrant C |
| Plot type | Count rate plots | Images |
|---|---|---|
| Comparison with Poisson distribution Blue bars denote a histogram of data divided into 1 sec bins. Red curve is a Poisson curve with rate = median count rate of data. |
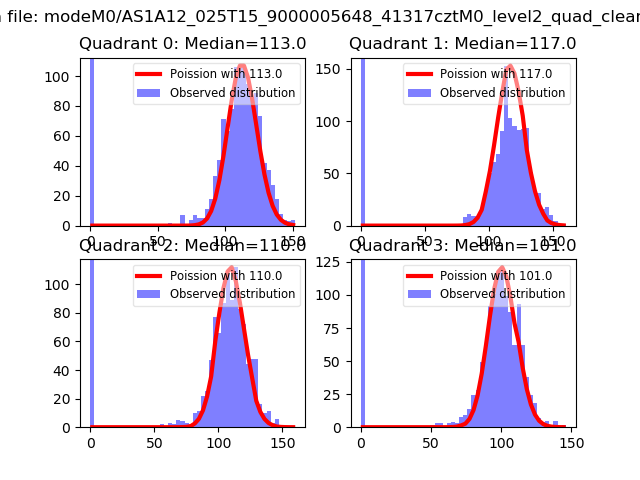 |
 |
| Quadrant-wise count rates Data is divided into 100 sec bins |
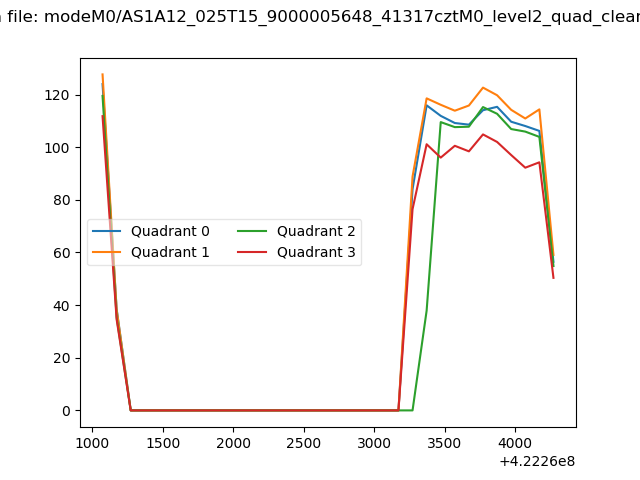 |
|
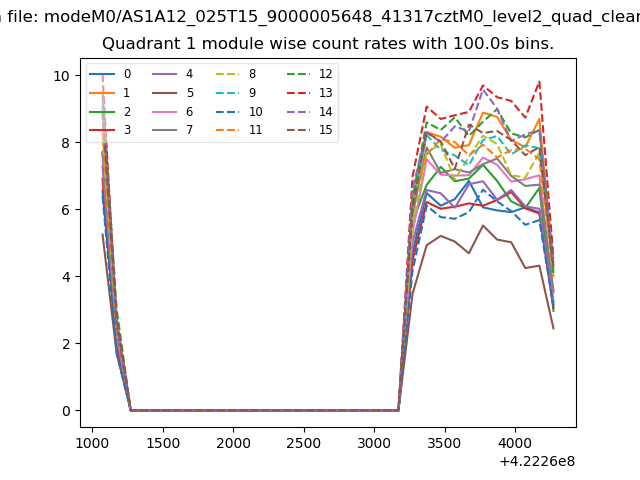
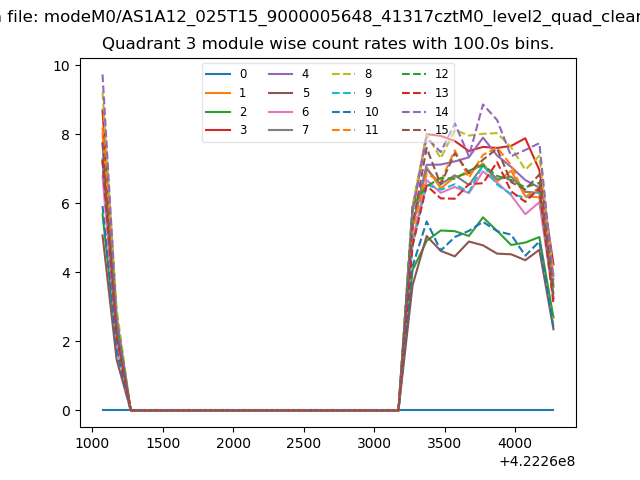
| Module-wise count rates for Quadrant A Data is divided into 100 sec bins |
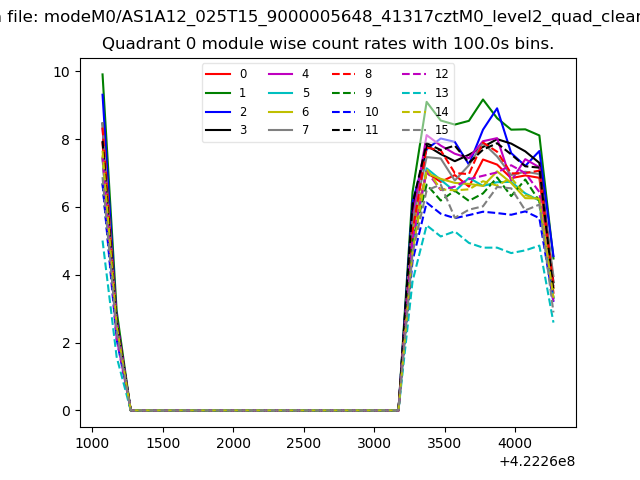 |
 |
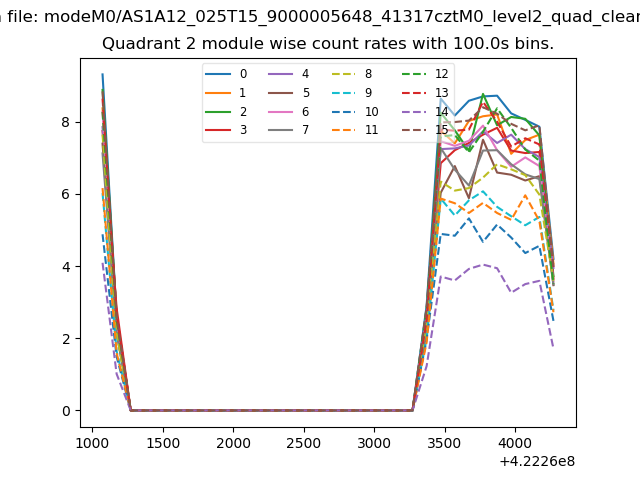
| Module-wise count rates for Quadrant B Data is divided into 100 sec bins |
 |
 |
| Module-wise count rates for Quadrant C Data is divided into 100 sec bins |
 |
 |
| Module-wise count rates for Quadrant D Data is divided into 100 sec bins |
 |
 |
| Parameter | Plot |
|---|---|
| CZT HV Monitor | 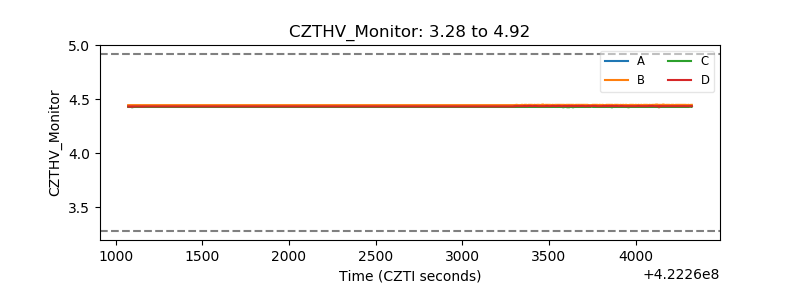 |
| D_VDD | 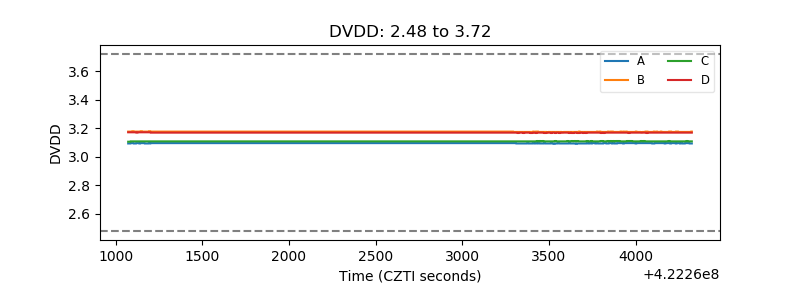 |
| Temperature 1 | 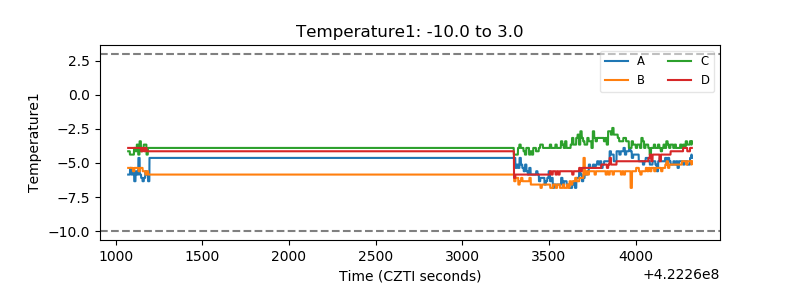 |
| Veto HV Monitor | 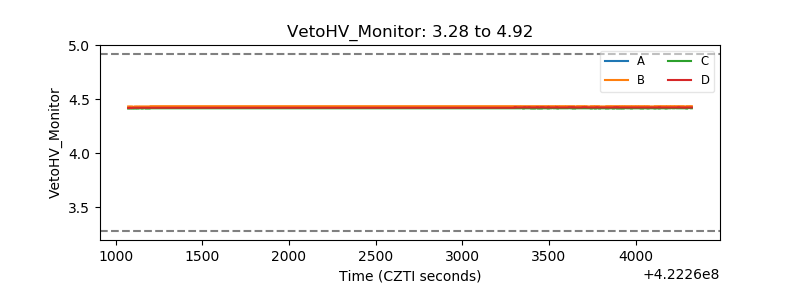 |
| Veto LLD | 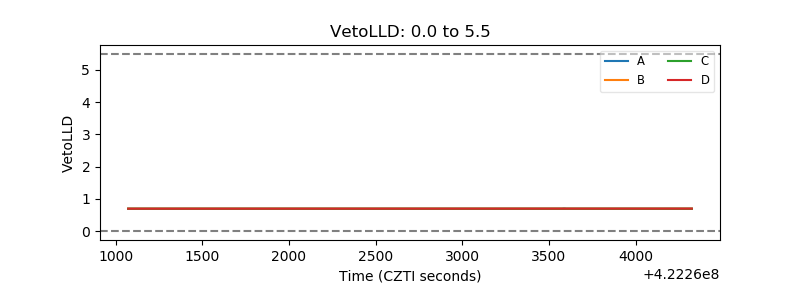 |
| Alpha Counter | 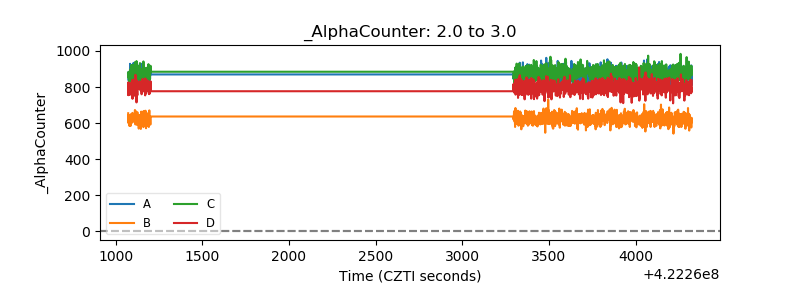 |
| _CPM_Rate | 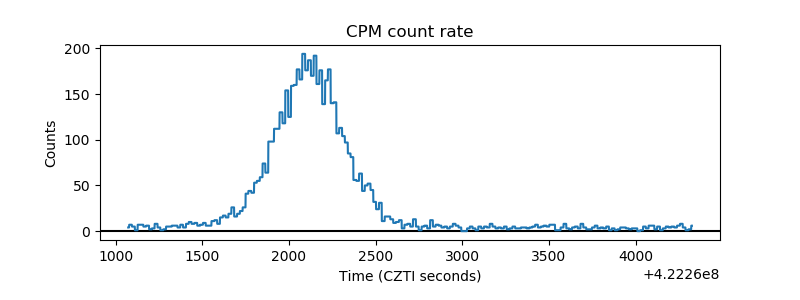 |
| CZT Counter | 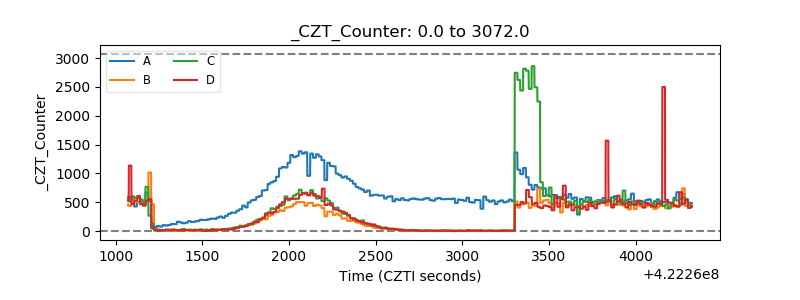 |
| +2.5 Volts monitor | 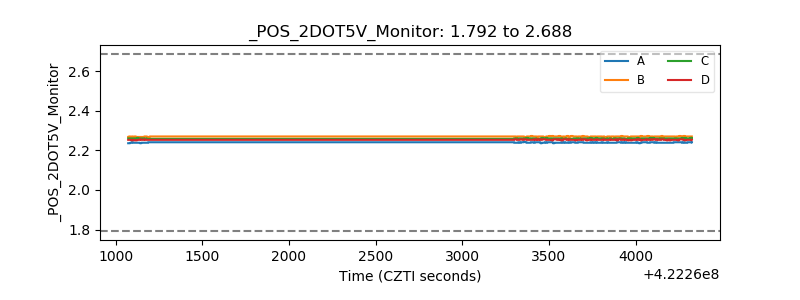 |
| +5 Volts monitor | 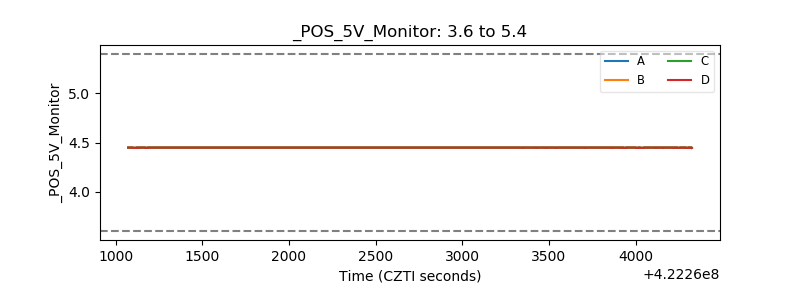 |
| _ROLL_ROT | 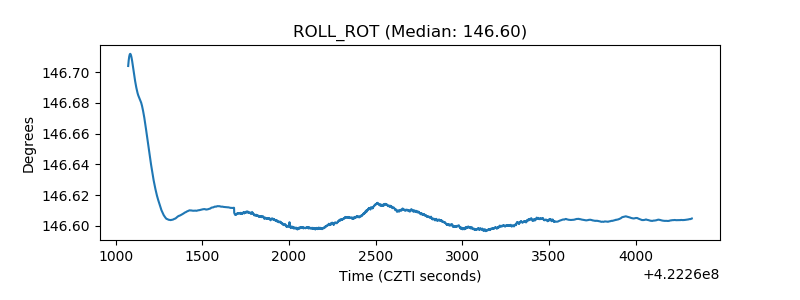 |
| _Roll_DEC | 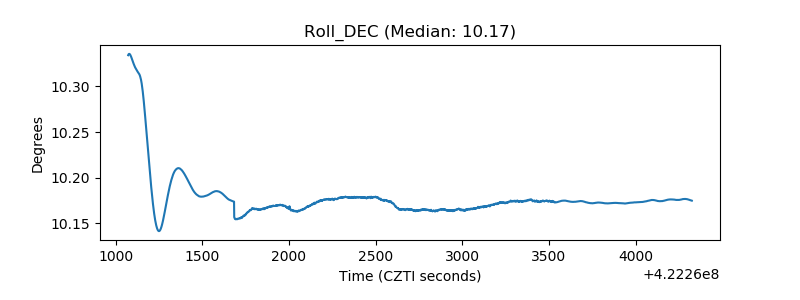 |
| _Roll_RA | 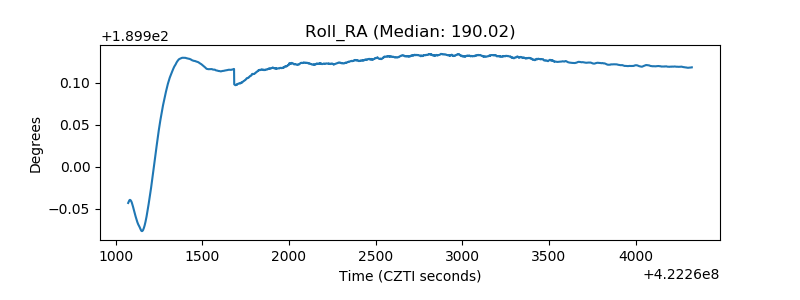 |
| Veto Counter | 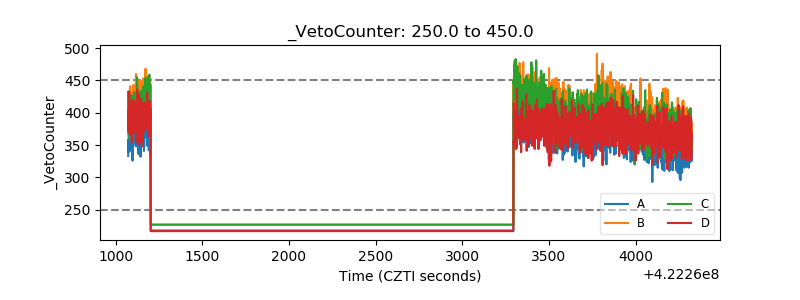 |