| Param | Original file | Final file |
|---|---|---|
| Filename | modeM0/AS1A12_025T15_9000005648_41318cztM0_level2.fits | modeM0/AS1A12_025T15_9000005648_41318cztM0_level2_quad_clean.evt |
| Size (bytes) | 330,465,600 | 85,475,520 |
| Size | 315.2 MB | 81.5 MB |
| Events in quadrant A | 2,825,525 | 578,515 |
| Events in quadrant B | 2,555,704 | 599,422 |
| Events in quadrant C | 3,107,245 | 535,500 |
| Events in quadrant D | 3,338,973 | 510,501 |
| Mode M0 | |||
|---|---|---|---|
| Quadrant | BADHDUFLAG | Total packets | Discarded packets |
| A | 0 | 11362 | 3 |
| B | 0 | 10998 | 2 |
| C | 0 | 12310 | 2 |
| D | 0 | 13454 | 2 |
| Mode M9 | |||
|---|---|---|---|
| Quadrant | BADHDUFLAG | Total packets | Discarded packets |
| A | 0 | 35 | 0 |
| B | 0 | 35 | 0 |
| C | 0 | 35 | 0 |
| D | 0 | 36 | 0 |
| Mode SS | |||
|---|---|---|---|
| Quadrant | BADHDUFLAG | Total packets | Discarded packets |
| A | 0 | 106 | 0 |
| B | 0 | 106 | 0 |
| C | 0 | 106 | 0 |
| D | 0 | 106 | 0 |
| Quadrant | Total seconds | Saturated seconds | Saturation percentage |
|---|---|---|---|
| A | 5202 | 14 | 0.269127% |
| B | 5202 | 11 | 0.211457% |
| C | 5202 | 271 | 5.209535% |
| D | 5202 | 115 | 2.210688% |
Noise dominated data is calculated using 1-second bins in cleaned event files. If a bin has >2000 counts, and if more than 50% of those come from <1% of pixels, then it is considered to be noise-dominated and hence unusable.
| Quadrant | # 1 sec bins | Bins with >0 counts | Bins with >2000 counts | High rate bins dominated by noise | Noise dominated (total time) | Noise dominated (detector-on time) | Marked lightcurve |
|---|---|---|---|---|---|---|---|
| A | 7114 | 5203 | 4 | 4 | 0.06% | 0.08% | 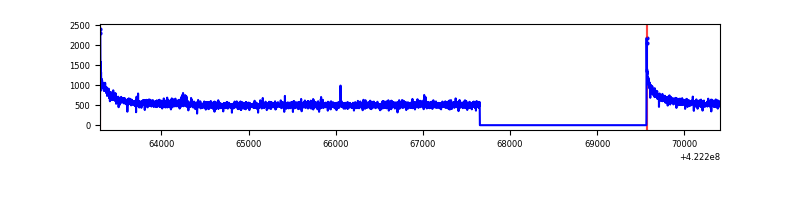 |
| B | 7114 | 5203 | 1 | 1 | 0.01% | 0.02% | 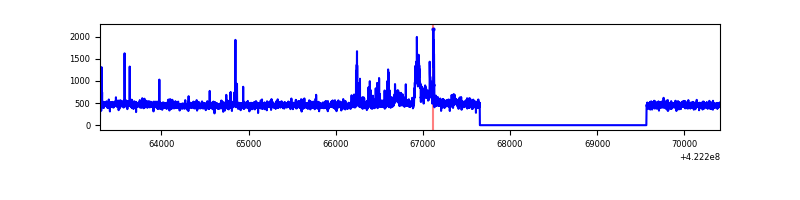 |
| C | 7114 | 5203 | 267 | 267 | 3.75% | 5.13% | 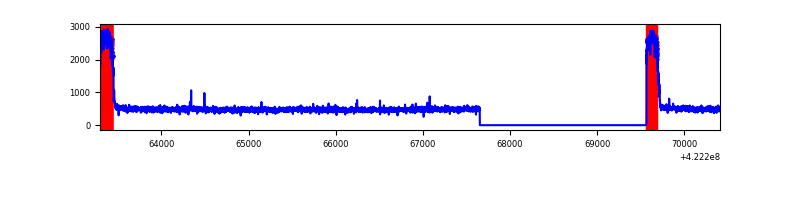 |
| D | 7114 | 5203 | 116 | 116 | 1.63% | 2.23% | 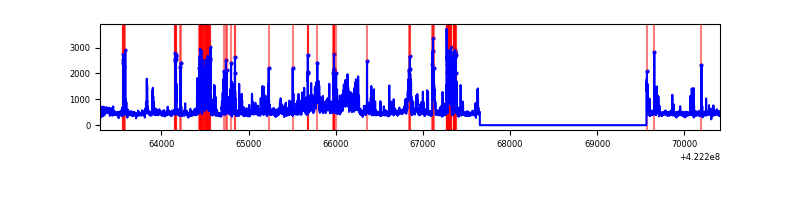 |
Top three noisy pixels from each quadrant. If the there are fewer than three noisy pixels in the level2.evt file, extra rows are filled as -1
| Pixel properties | Quadrant properties | ||||||
|---|---|---|---|---|---|---|---|
| Quadrant | DetID | PixID | Counts | Sigma | Mean | Median | Sigma |
| A | 10 | 83 | 505794 | 4148.29 | 587 | 575 | 121.8 |
| A | 12 | 189 | 32253 | 260.1 | 587 | 575 | 121.8 |
| A | 13 | 6 | 15983 | 126.51 | 587 | 575 | 121.8 |
| B | 0 | 229 | 190899 | 1686.94 | 579 | 564 | 112.8 |
| B | 7 | 202 | 33533 | 292.2 | 579 | 564 | 112.8 |
| B | 0 | 245 | 26765 | 232.22 | 579 | 564 | 112.8 |
| C | 0 | 10 | 743935 | 5800.26 | 548 | 551 | 128.2 |
| C | 15 | 214 | 218136 | 1697.71 | 548 | 551 | 128.2 |
| C | 12 | 249 | 5630 | 39.63 | 548 | 551 | 128.2 |
| D | 5 | 222 | 433816 | 3104.28 | 565 | 548 | 139.6 |
| D | 2 | 249 | 290645 | 2078.49 | 565 | 548 | 139.6 |
| D | 13 | 249 | 288759 | 2064.98 | 565 | 548 | 139.6 |
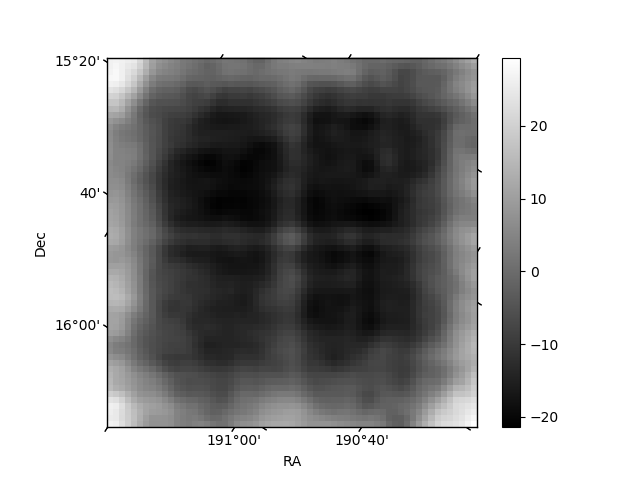
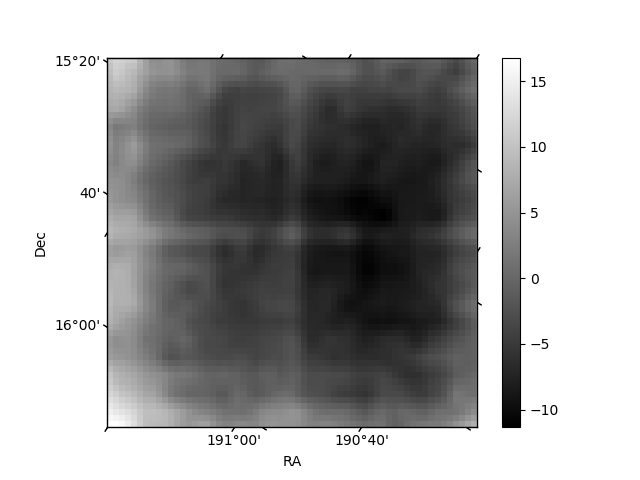
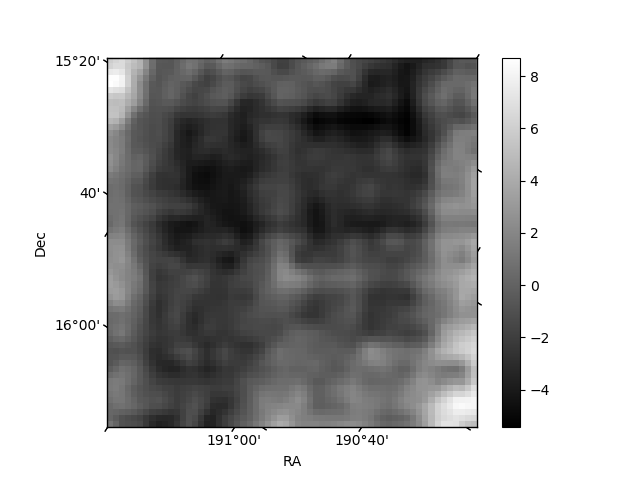
Histogram calculated using DETX and DETY for each event in the final _common_clean file
| Quadrant A | 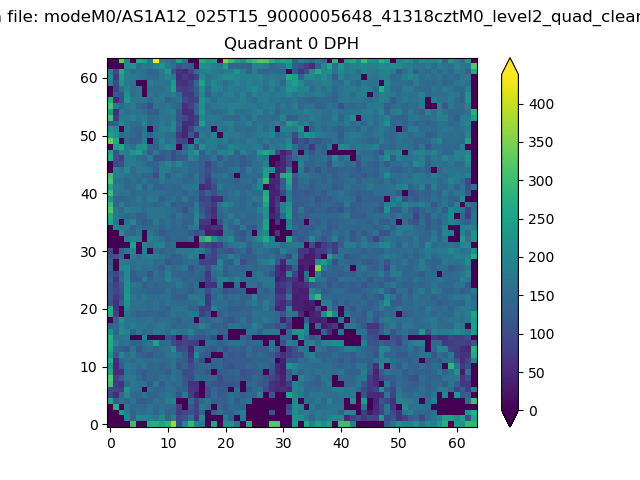 |
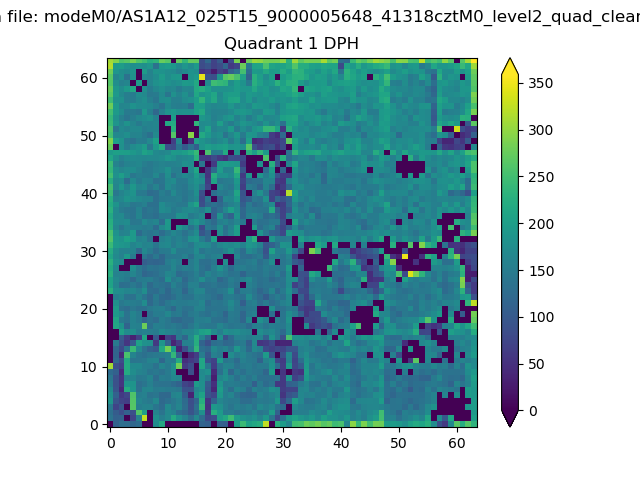 |
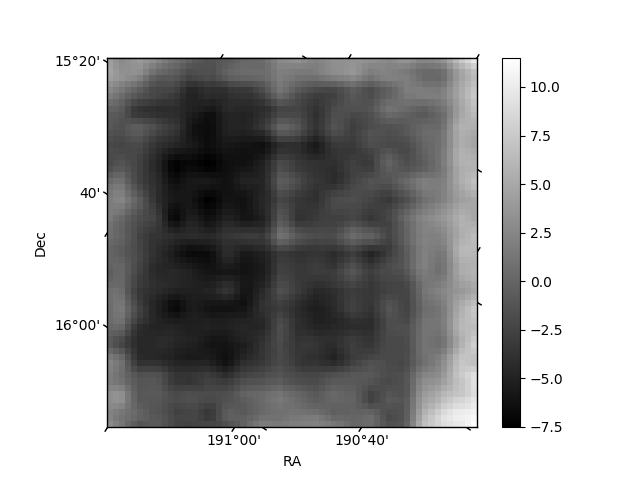
Quadrant B |
|---|---|---|---|
| Quadrant D | 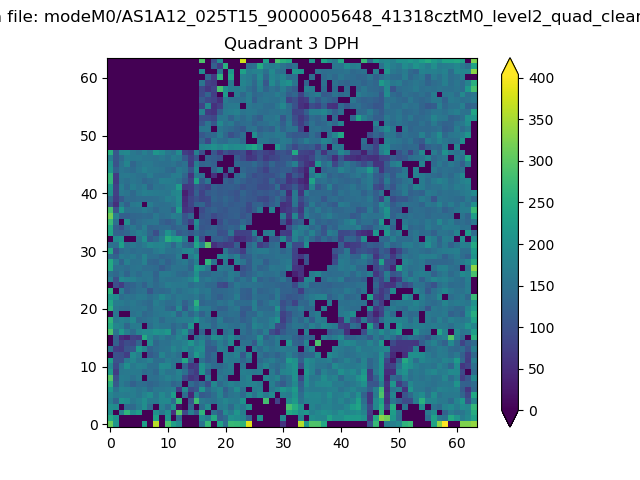 |
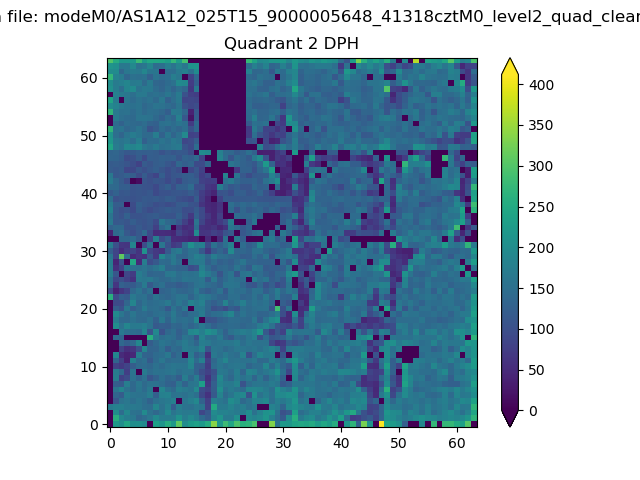 |
Quadrant C |
| Plot type | Count rate plots | Images |
|---|---|---|
| Comparison with Poisson distribution Blue bars denote a histogram of data divided into 1 sec bins. Red curve is a Poisson curve with rate = median count rate of data. |
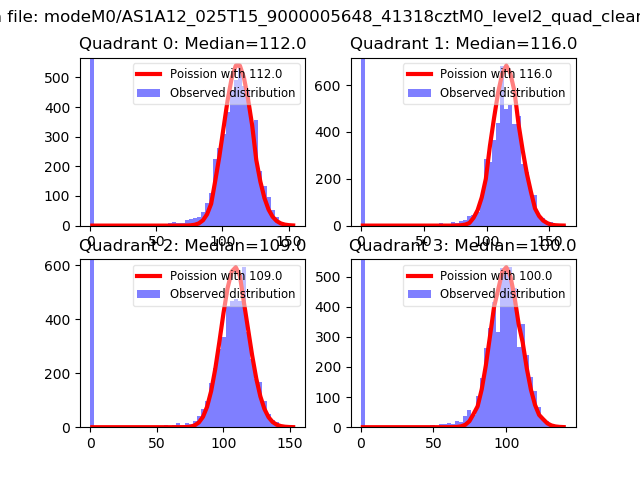 |
 |
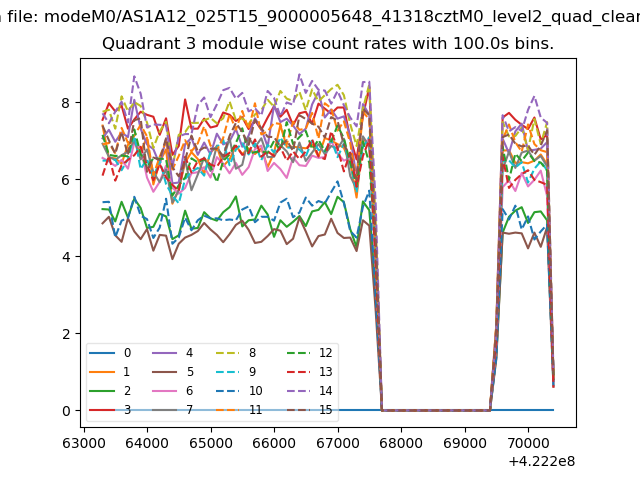
| Quadrant-wise count rates Data is divided into 100 sec bins |
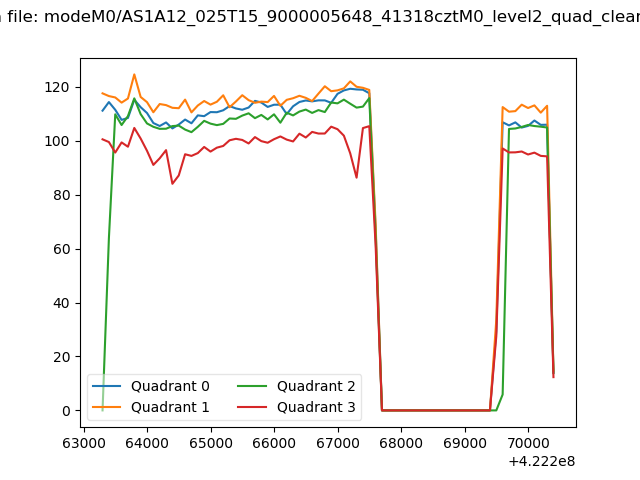 |
|
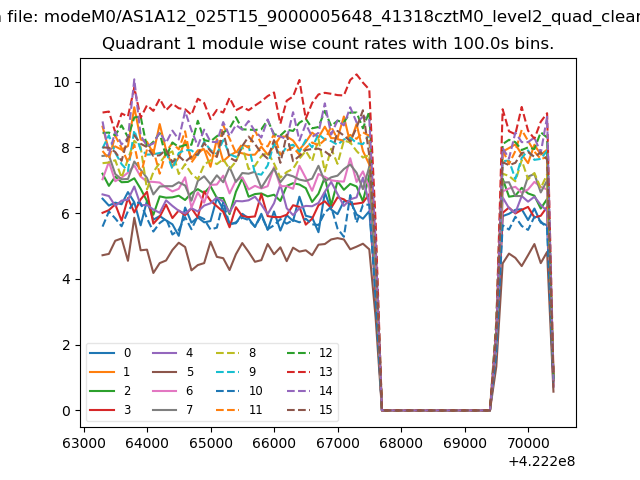
| Module-wise count rates for Quadrant A Data is divided into 100 sec bins |
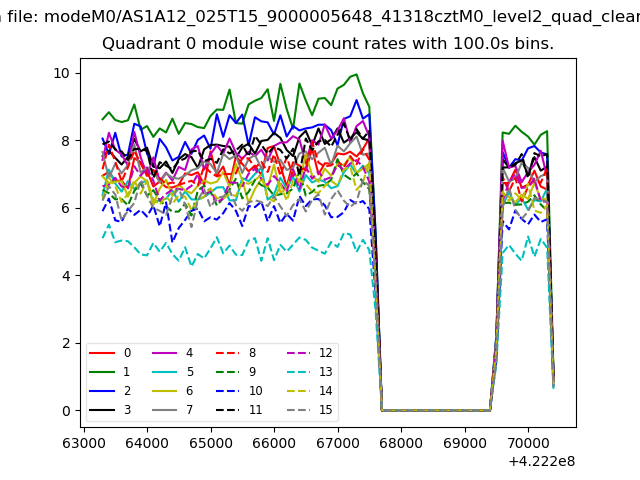 |
 |
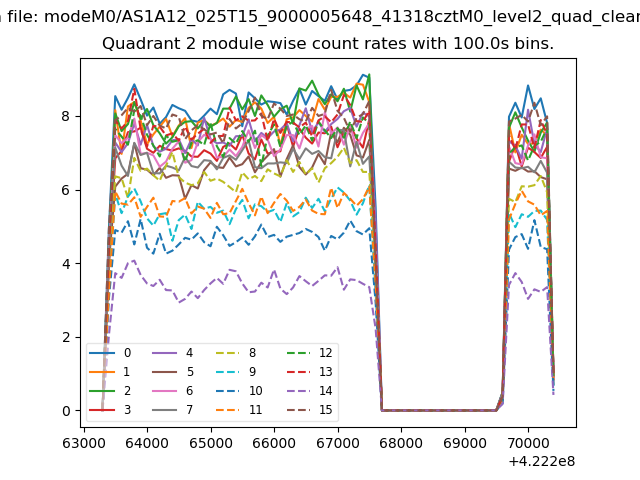
| Module-wise count rates for Quadrant B Data is divided into 100 sec bins |
 |
 |
| Module-wise count rates for Quadrant C Data is divided into 100 sec bins |
 |
 |
| Module-wise count rates for Quadrant D Data is divided into 100 sec bins |
 |
 |
| Parameter | Plot |
|---|---|
| CZT HV Monitor | 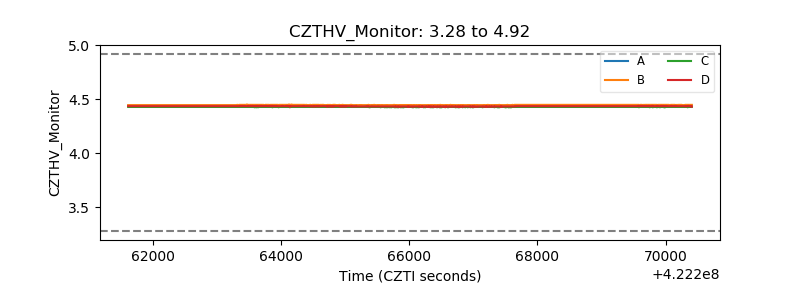 |
| D_VDD | 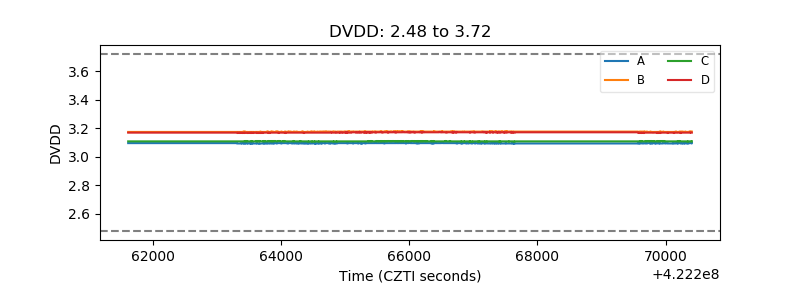 |
| Temperature 1 | 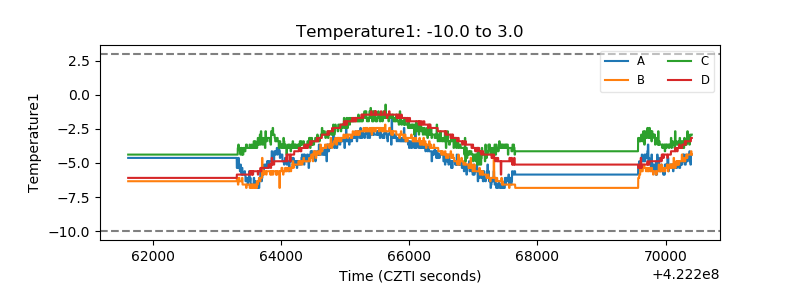 |
| Veto HV Monitor |  |
| Veto LLD | 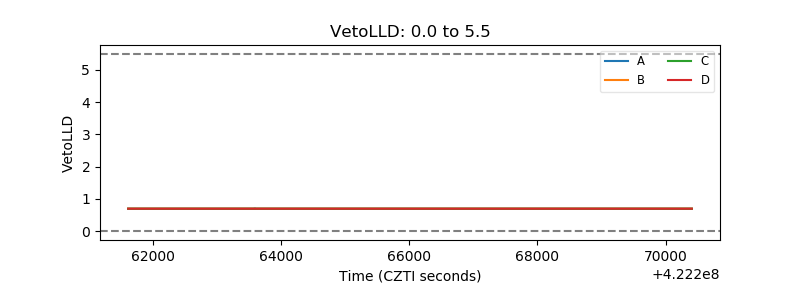 |
| Alpha Counter | 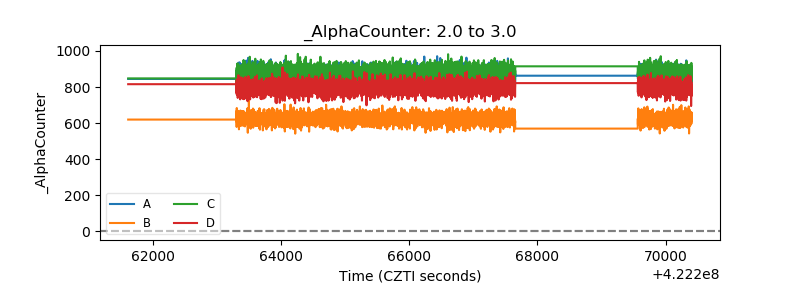 |
| _CPM_Rate | 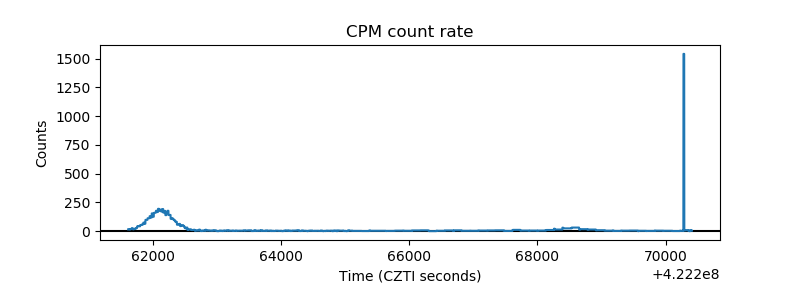 |
| CZT Counter | 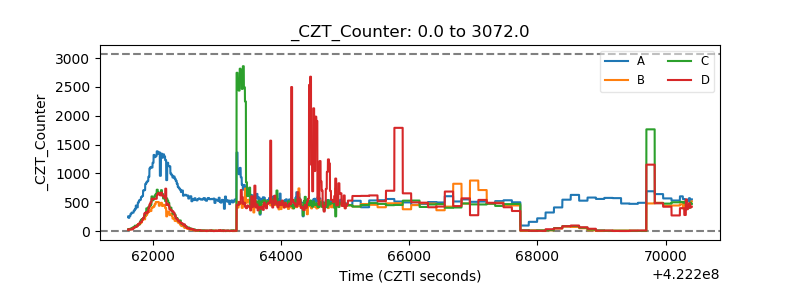 |
| +2.5 Volts monitor | 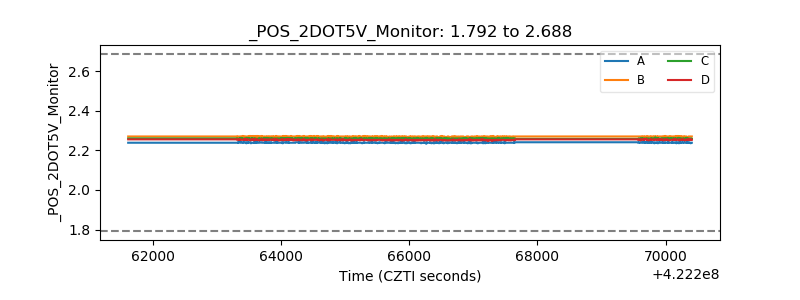 |
| +5 Volts monitor | 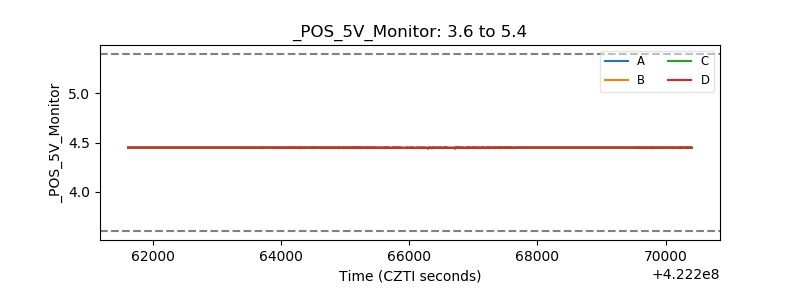 |
| _ROLL_ROT | 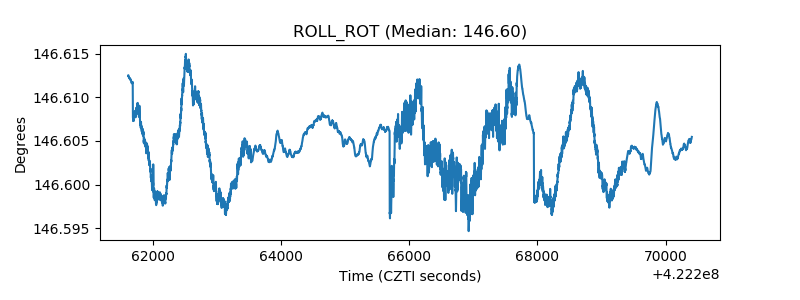 |
| _Roll_DEC |  |
| _Roll_RA | 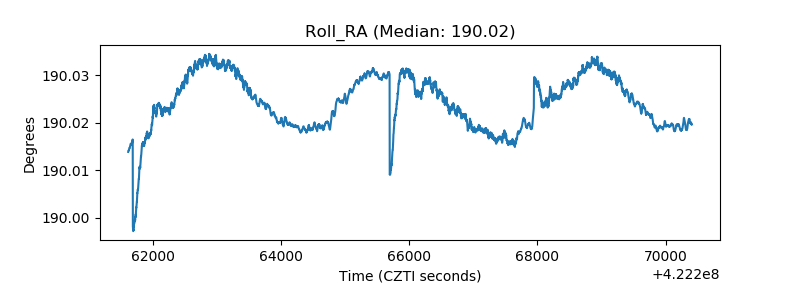 |
| Veto Counter | 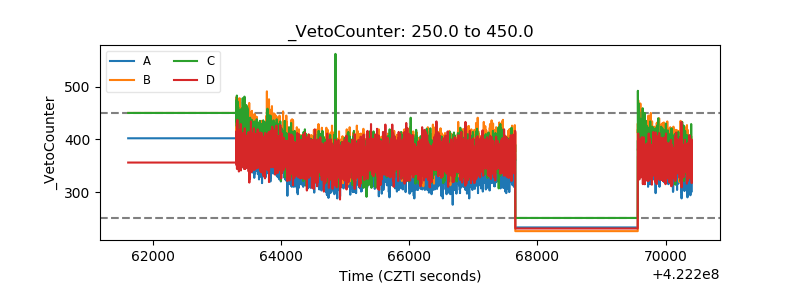 |