| Param | Original file | Final file |
|---|---|---|
| Filename | modeM0/AS1A12_025T15_9000005648_41319cztM0_level2.fits | modeM0/AS1A12_025T15_9000005648_41319cztM0_level2_quad_clean.evt |
| Size (bytes) | 386,850,240 | 104,578,560 |
| Size | 368.9 MB | 99.7 MB |
| Events in quadrant A | 3,427,481 | 707,995 |
| Events in quadrant B | 3,107,731 | 728,260 |
| Events in quadrant C | 3,666,588 | 664,223 |
| Events in quadrant D | 3,621,804 | 621,207 |
| Mode M0 | |||
|---|---|---|---|
| Quadrant | BADHDUFLAG | Total packets | Discarded packets |
| A | 0 | 13772 | 3 |
| B | 0 | 13559 | 2 |
| C | 0 | 14606 | 2 |
| D | 0 | 15160 | 2 |
| Mode M9 | |||
|---|---|---|---|
| Quadrant | BADHDUFLAG | Total packets | Discarded packets |
| A | 0 | 35 | 0 |
| B | 0 | 35 | 0 |
| C | 0 | 35 | 0 |
| D | 0 | 35 | 0 |
| Mode SS | |||
|---|---|---|---|
| Quadrant | BADHDUFLAG | Total packets | Discarded packets |
| A | 0 | 132 | 0 |
| B | 0 | 132 | 0 |
| C | 0 | 132 | 0 |
| D | 0 | 132 | 0 |
| Quadrant | Total seconds | Saturated seconds | Saturation percentage |
|---|---|---|---|
| A | 6377 | 15 | 0.235220% |
| B | 6377 | 12 | 0.188176% |
| C | 6377 | 256 | 4.014427% |
| D | 6377 | 174 | 2.728556% |
Noise dominated data is calculated using 1-second bins in cleaned event files. If a bin has >2000 counts, and if more than 50% of those come from <1% of pixels, then it is considered to be noise-dominated and hence unusable.
| Quadrant | # 1 sec bins | Bins with >0 counts | Bins with >2000 counts | High rate bins dominated by noise | Noise dominated (total time) | Noise dominated (detector-on time) | Marked lightcurve |
|---|---|---|---|---|---|---|---|
| A | 9873 | 6379 | 6 | 6 | 0.06% | 0.09% | 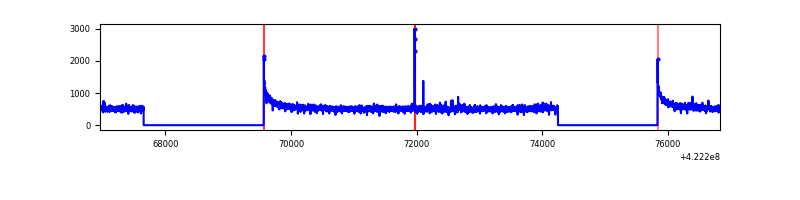 |
| B | 9873 | 6379 | 4 | 4 | 0.04% | 0.06% | 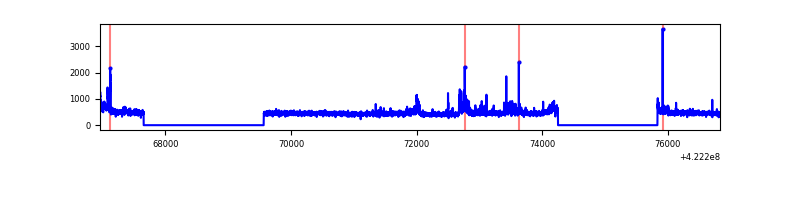 |
| C | 9873 | 6379 | 244 | 244 | 2.47% | 3.83% | 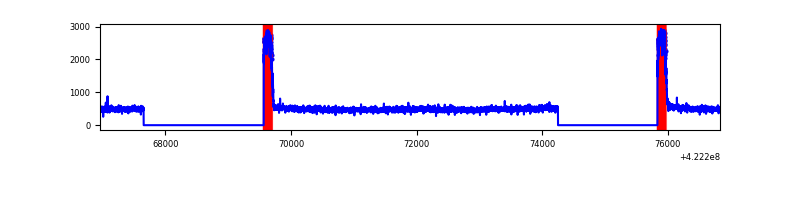 |
| D | 9873 | 6379 | 178 | 178 | 1.80% | 2.79% | 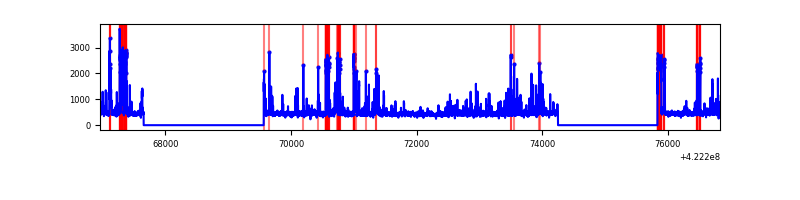 |
Top three noisy pixels from each quadrant. If the there are fewer than three noisy pixels in the level2.evt file, extra rows are filled as -1
| Pixel properties | Quadrant properties | ||||||
|---|---|---|---|---|---|---|---|
| Quadrant | DetID | PixID | Counts | Sigma | Mean | Median | Sigma |
| A | 10 | 83 | 569874 | 3834.49 | 715 | 701 | 148.4 |
| A | 12 | 189 | 57429 | 382.17 | 715 | 701 | 148.4 |
| A | 2 | 79 | 23011 | 150.3 | 715 | 701 | 148.4 |
| B | 0 | 190 | 151335 | 1094.01 | 707 | 688 | 137.7 |
| B | 0 | 229 | 109468 | 789.97 | 707 | 688 | 137.7 |
| B | 0 | 186 | 21316 | 149.8 | 707 | 688 | 137.7 |
| C | 0 | 10 | 766370 | 4823.19 | 674 | 679 | 158.8 |
| C | 15 | 214 | 267316 | 1679.58 | 674 | 679 | 158.8 |
| C | 14 | 67 | 4516 | 24.17 | 674 | 679 | 158.8 |
| D | 13 | 249 | 248494 | 1450.45 | 687 | 668 | 170.9 |
| D | 2 | 249 | 237043 | 1383.43 | 687 | 668 | 170.9 |
| D | 2 | 120 | 178642 | 1041.63 | 687 | 668 | 170.9 |
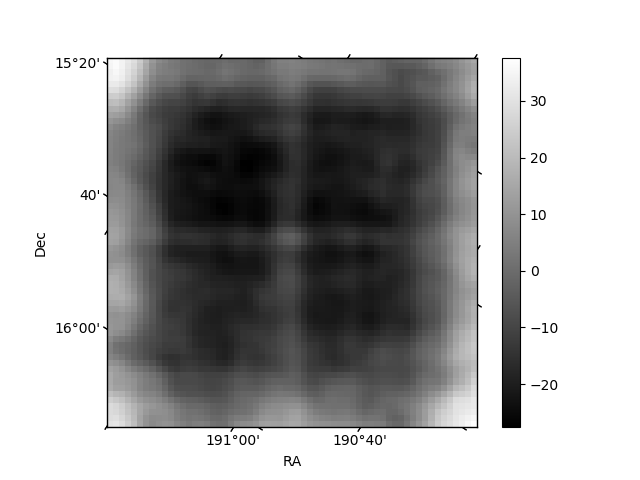
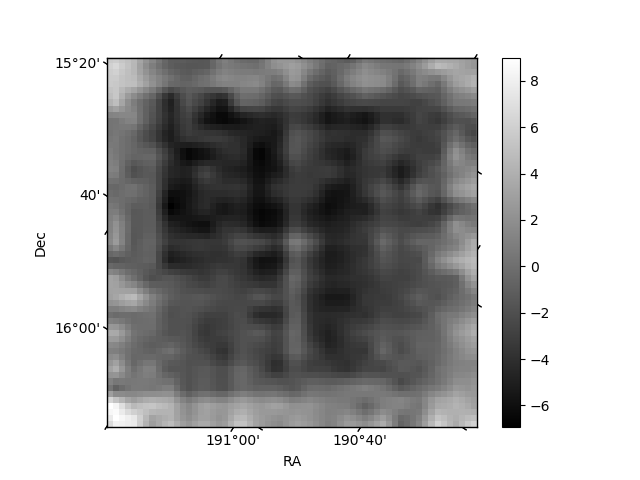
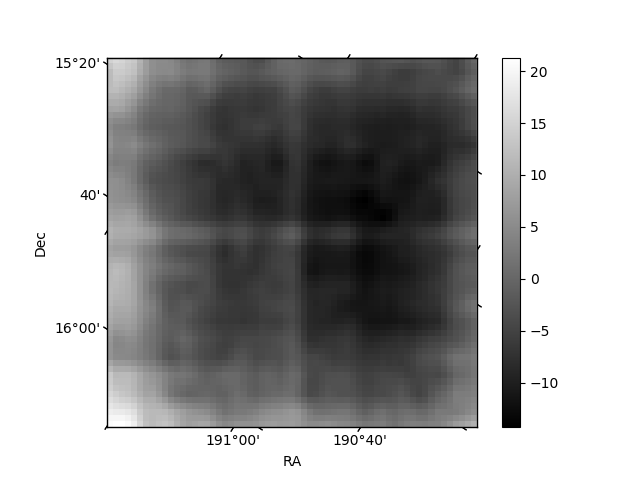
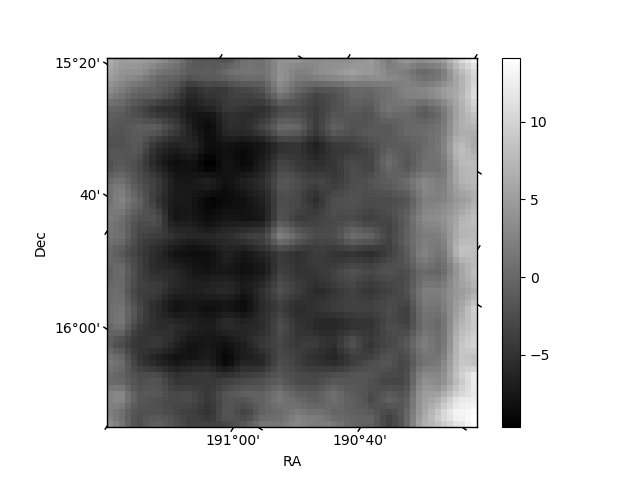
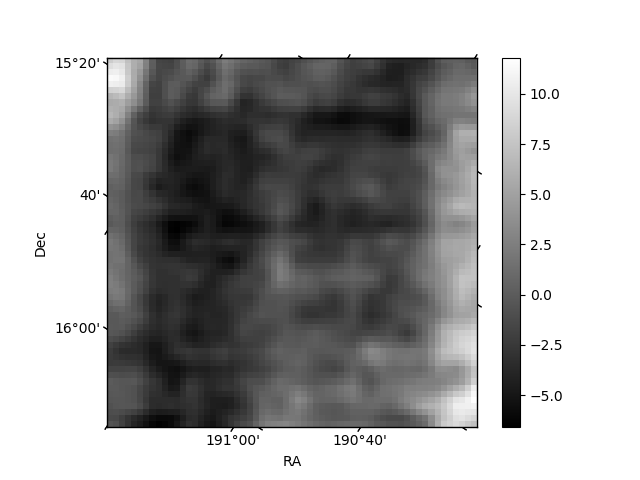
Histogram calculated using DETX and DETY for each event in the final _common_clean file
| Quadrant A | 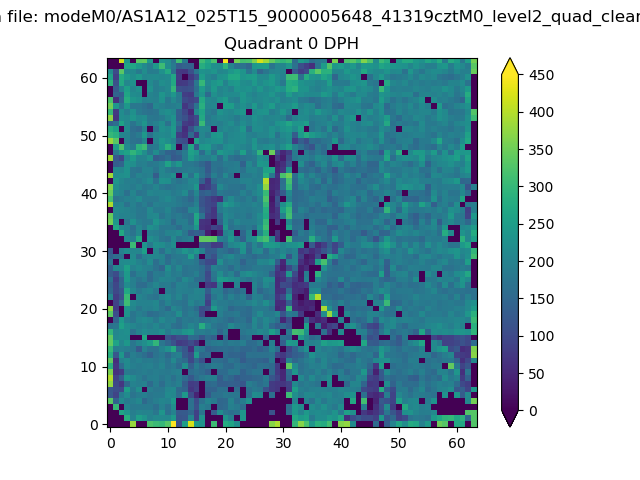 |
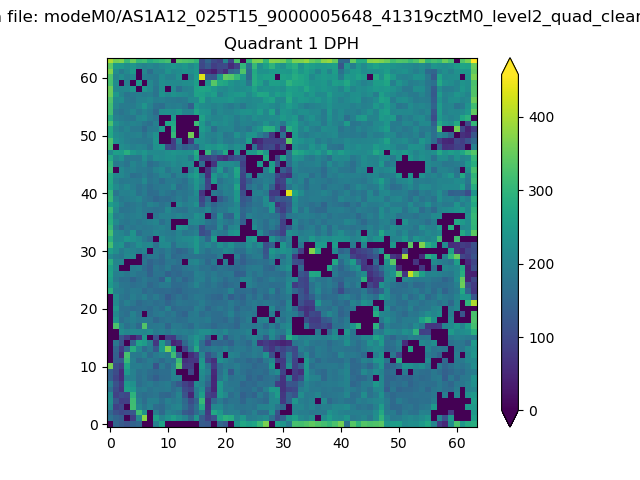 |
Quadrant B |
|---|---|---|---|
| Quadrant D |  |
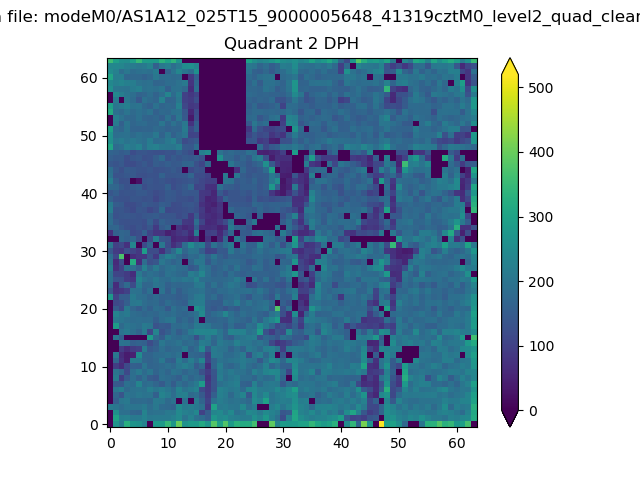 |
Quadrant C |
| Plot type | Count rate plots | Images |
|---|---|---|
| Comparison with Poisson distribution Blue bars denote a histogram of data divided into 1 sec bins. Red curve is a Poisson curve with rate = median count rate of data. |
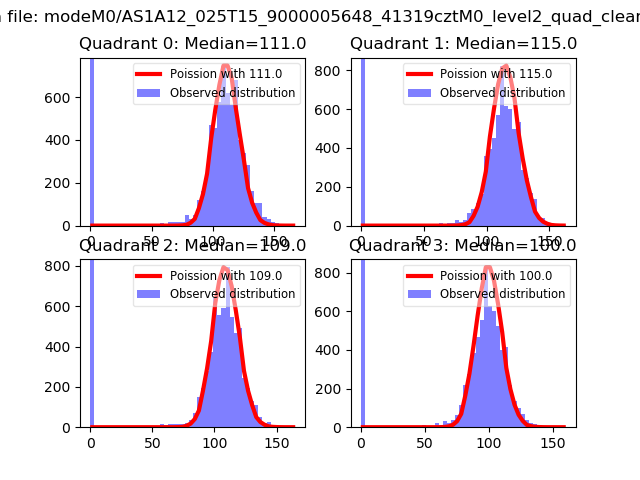 |
 |
| Quadrant-wise count rates Data is divided into 100 sec bins |
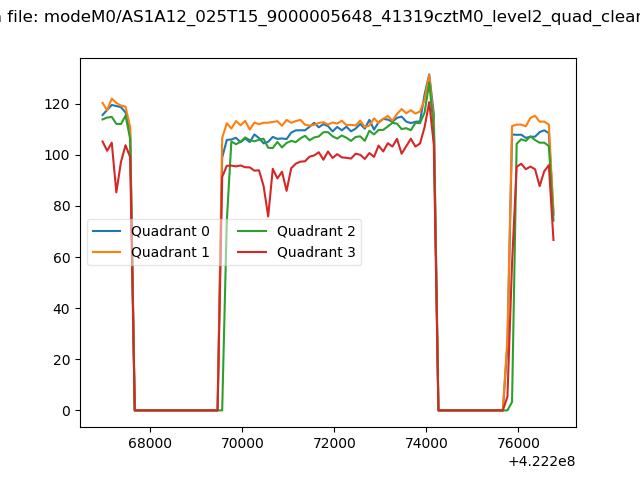 |
|
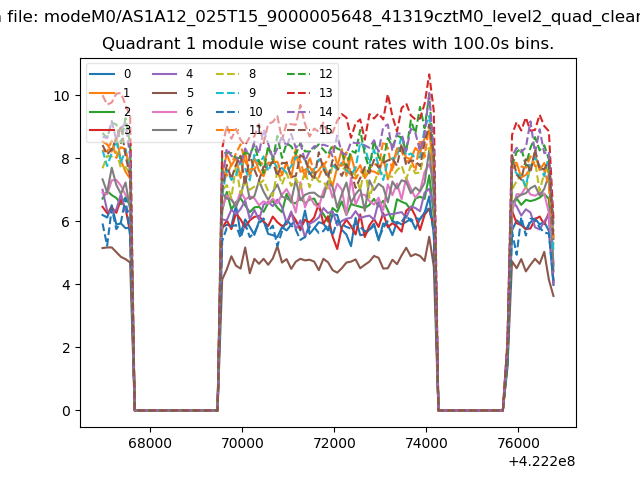
| Module-wise count rates for Quadrant A Data is divided into 100 sec bins |
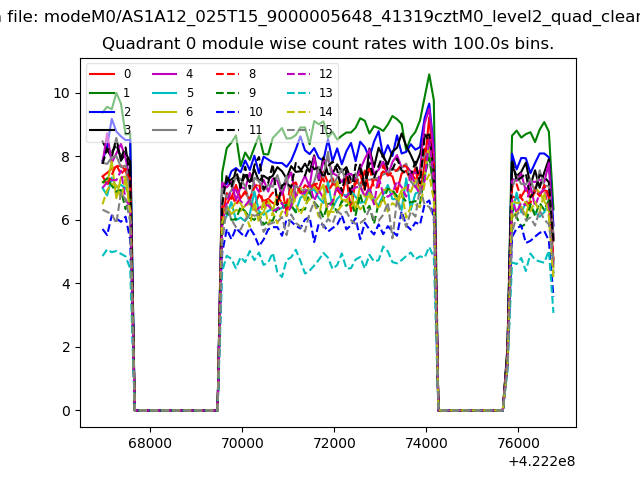 |
 |
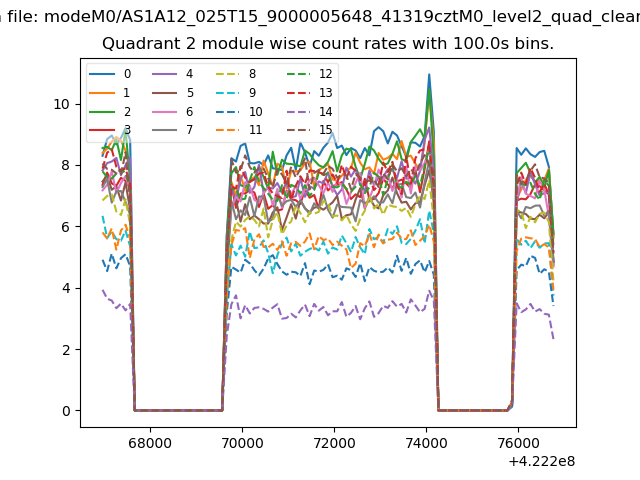
| Module-wise count rates for Quadrant B Data is divided into 100 sec bins |
 |
 |
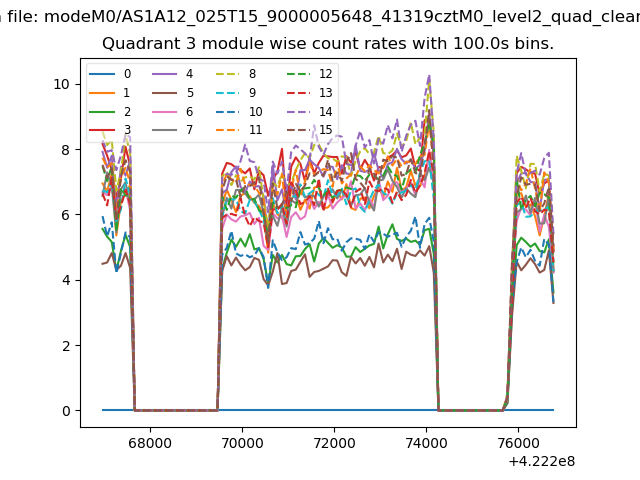
| Module-wise count rates for Quadrant C Data is divided into 100 sec bins |
 |
 |
| Module-wise count rates for Quadrant D Data is divided into 100 sec bins |
 |
 |
| Parameter | Plot |
|---|---|
| CZT HV Monitor | 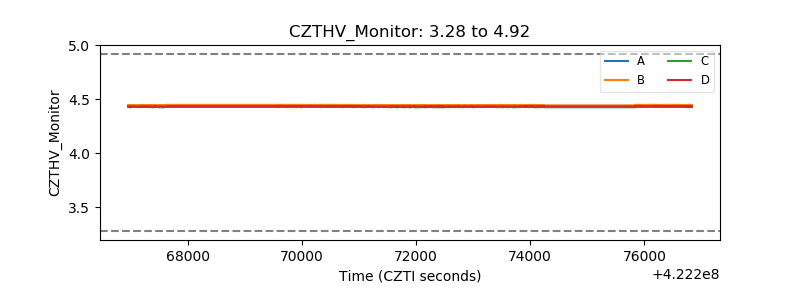 |
| D_VDD | 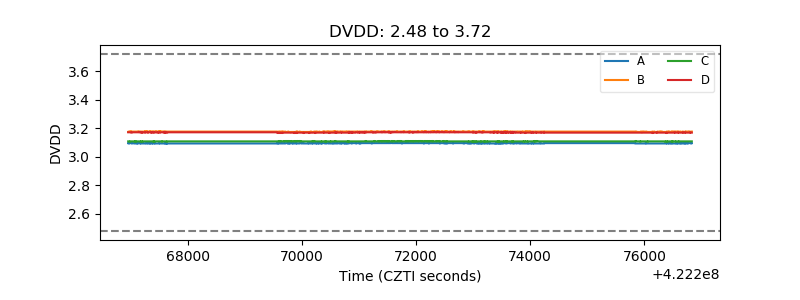 |
| Temperature 1 | 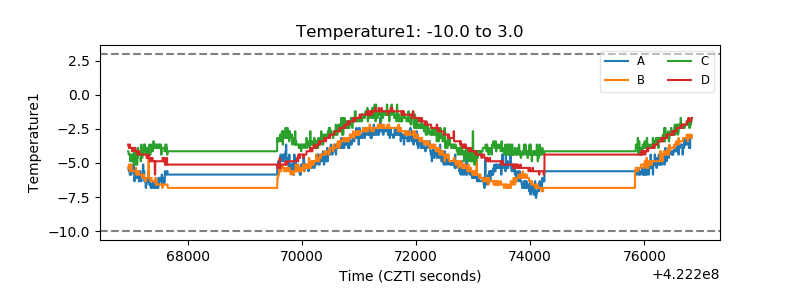 |
| Veto HV Monitor | 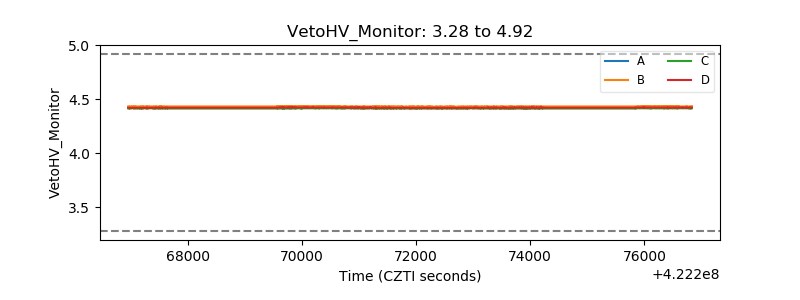 |
| Veto LLD | 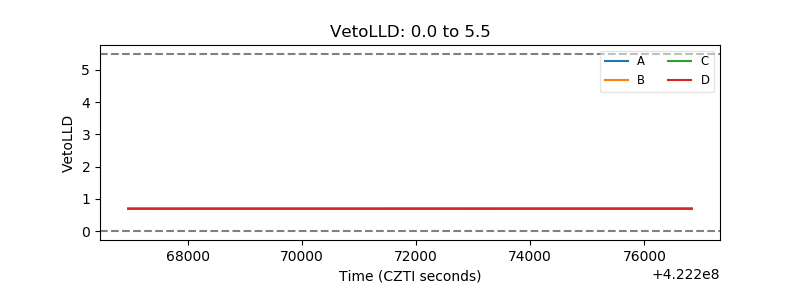 |
| Alpha Counter | 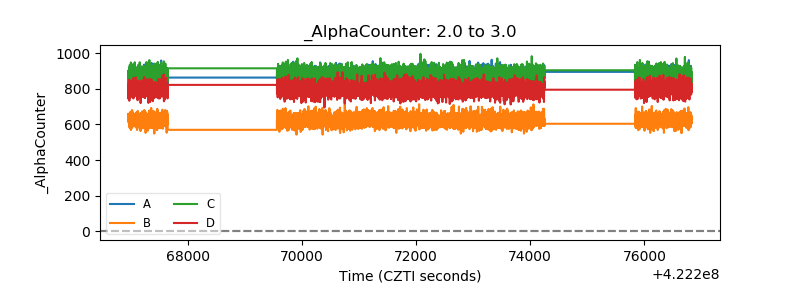 |
| _CPM_Rate | 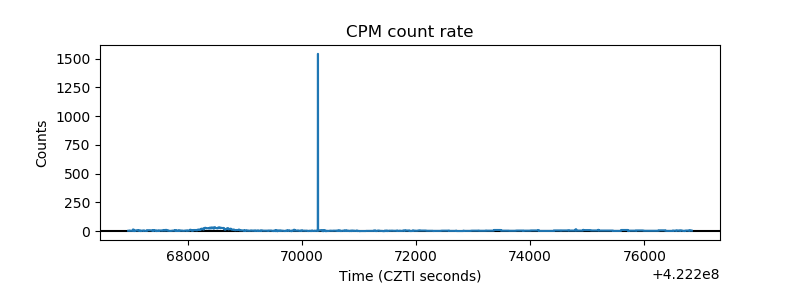 |
| CZT Counter | 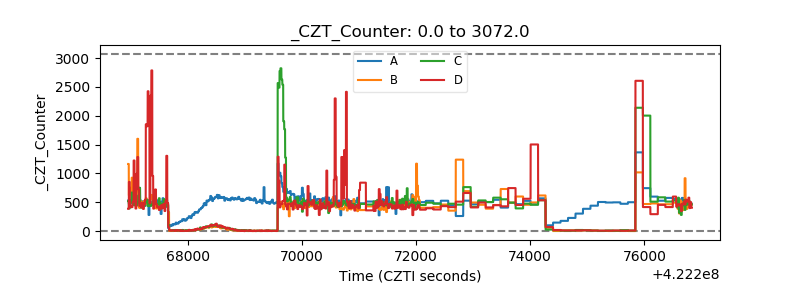 |
| +2.5 Volts monitor | 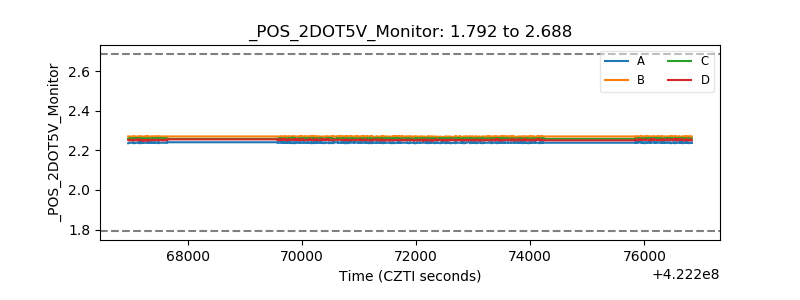 |
| +5 Volts monitor | 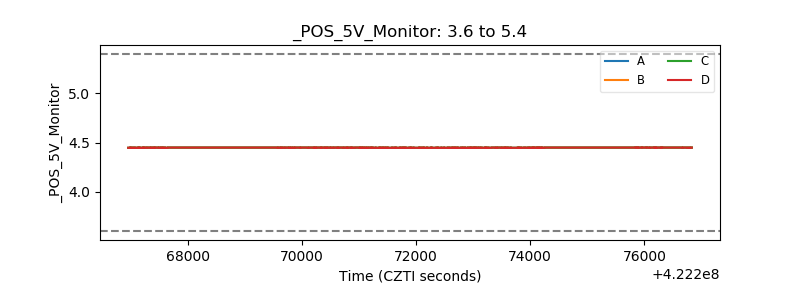 |
| _ROLL_ROT | 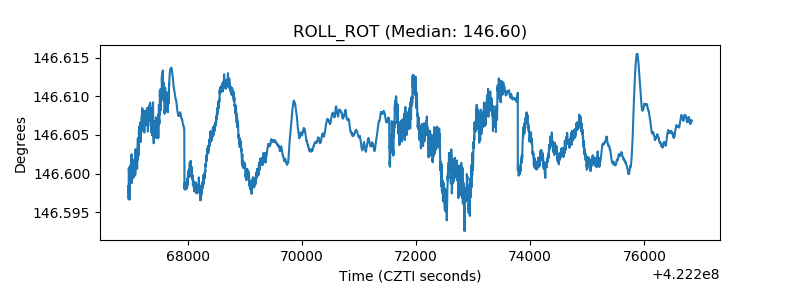 |
| _Roll_DEC | 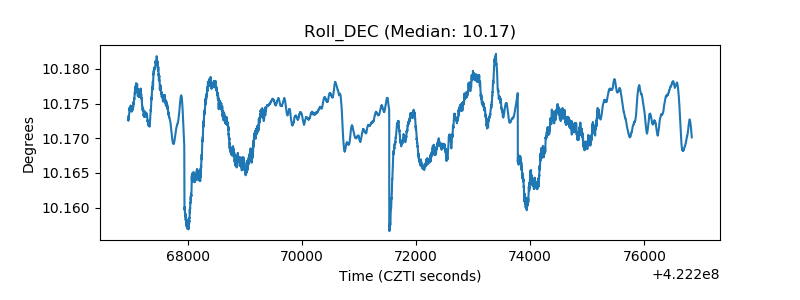 |
| _Roll_RA | 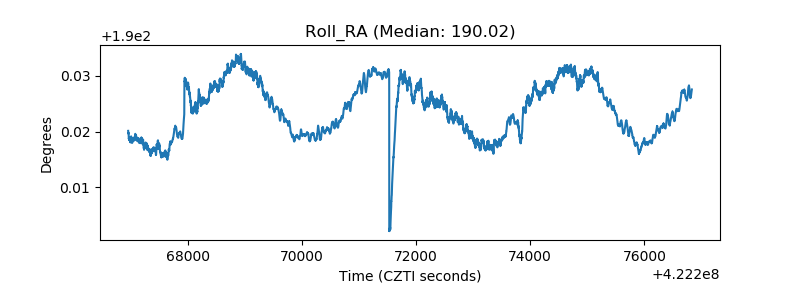 |
| Veto Counter | 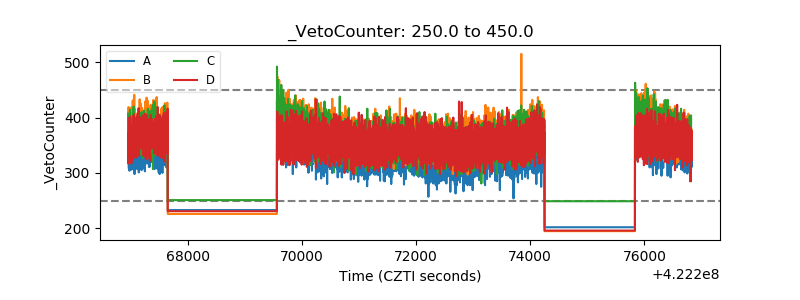 |