| Param | Original file | Final file |
|---|---|---|
| Filename | modeM0/AS1A12_025T15_9000005648_41324cztM0_level2.fits | modeM0/AS1A12_025T15_9000005648_41324cztM0_level2_quad_clean.evt |
| Size (bytes) | 122,178,240 | 33,635,520 |
| Size | 116.5 MB | 32.1 MB |
| Events in quadrant A | 1,018,673 | 224,184 |
| Events in quadrant B | 945,189 | 229,979 |
| Events in quadrant C | 963,412 | 216,815 |
| Events in quadrant D | 1,431,601 | 197,496 |
| Mode M0 | |||
|---|---|---|---|
| Quadrant | BADHDUFLAG | Total packets | Discarded packets |
| A | 0 | 4193 | 0 |
| B | 0 | 4265 | 0 |
| C | 0 | 4141 | 0 |
| D | 0 | 5685 | 0 |
| Mode SS | |||
|---|---|---|---|
| Quadrant | BADHDUFLAG | Total packets | Discarded packets |
| A | 0 | 42 | 0 |
| B | 0 | 42 | 0 |
| C | 0 | 42 | 0 |
| D | 0 | 42 | 0 |
| Quadrant | Total seconds | Saturated seconds | Saturation percentage |
|---|---|---|---|
| A | 2069 | 1 | 0.048333% |
| B | 2069 | 2 | 0.096665% |
| C | 2069 | 1 | 0.048333% |
| D | 2069 | 49 | 2.368294% |
Noise dominated data is calculated using 1-second bins in cleaned event files. If a bin has >2000 counts, and if more than 50% of those come from <1% of pixels, then it is considered to be noise-dominated and hence unusable.
| Quadrant | # 1 sec bins | Bins with >0 counts | Bins with >2000 counts | High rate bins dominated by noise | Noise dominated (total time) | Noise dominated (detector-on time) | Marked lightcurve |
|---|---|---|---|---|---|---|---|
| A | 2069 | 2069 | 0 | 0 | 0.00% | 0.00% | 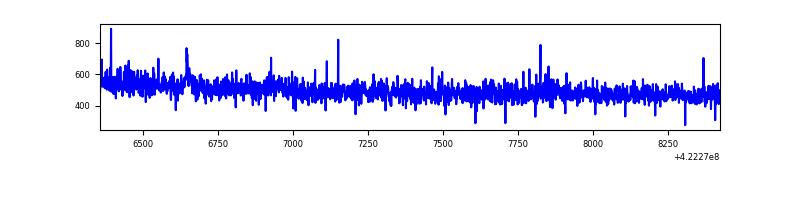 |
| B | 2069 | 2069 | 0 | 0 | 0.00% | 0.00% | 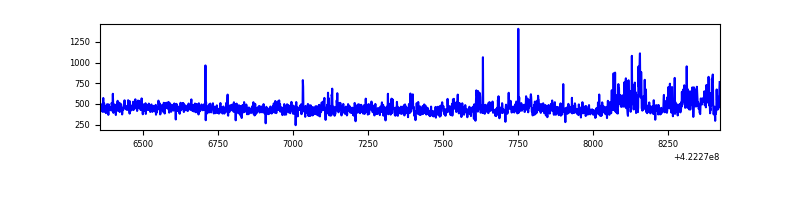 |
| C | 2069 | 2069 | 0 | 0 | 0.00% | 0.00% | 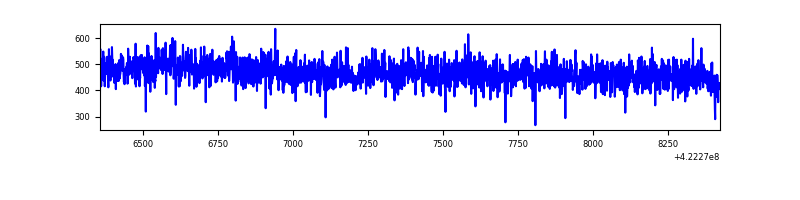 |
| D | 2069 | 2069 | 46 | 46 | 2.22% | 2.22% | 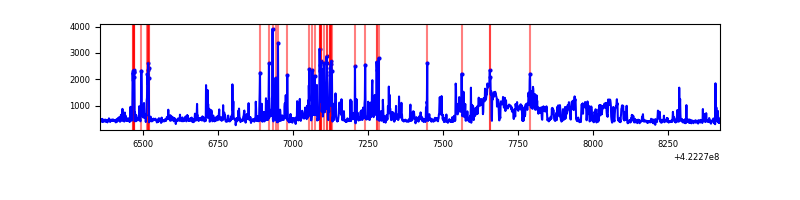 |
Top three noisy pixels from each quadrant. If the there are fewer than three noisy pixels in the level2.evt file, extra rows are filled as -1
| Pixel properties | Quadrant properties | ||||||
|---|---|---|---|---|---|---|---|
| Quadrant | DetID | PixID | Counts | Sigma | Mean | Median | Sigma |
| A | 10 | 83 | 134526 | 2802.9 | 225 | 220 | 47.9 |
| A | 13 | 6 | 5313 | 106.29 | 225 | 220 | 47.9 |
| A | 12 | 189 | 4622 | 91.87 | 225 | 220 | 47.9 |
| B | 0 | 190 | 49730 | 1089.57 | 221 | 215 | 45.4 |
| B | 5 | 255 | 16618 | 360.95 | 221 | 215 | 45.4 |
| B | 12 | 111 | 5330 | 112.56 | 221 | 215 | 45.4 |
| C | 15 | 214 | 84759 | 1597.82 | 218 | 219 | 52.9 |
| C | 0 | 10 | 27290 | 511.65 | 218 | 219 | 52.9 |
| C | 13 | 61 | 1420 | 22.7 | 218 | 219 | 52.9 |
| D | 2 | 120 | 229094 | 4131.04 | 221 | 214 | 55.4 |
| D | 1 | 47 | 128531 | 2315.98 | 221 | 214 | 55.4 |
| D | 13 | 249 | 91935 | 1655.46 | 221 | 214 | 55.4 |
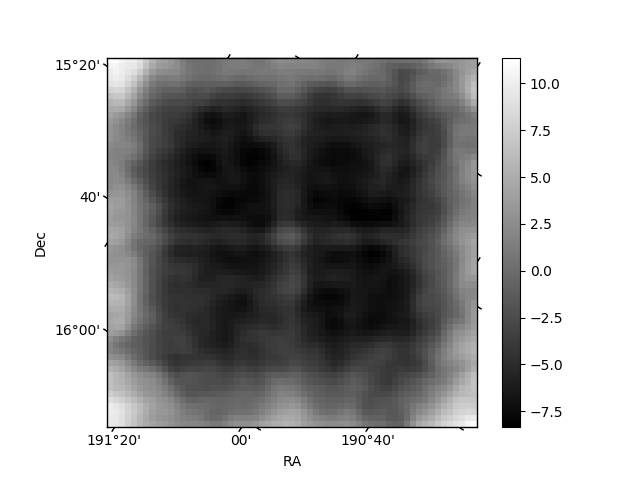
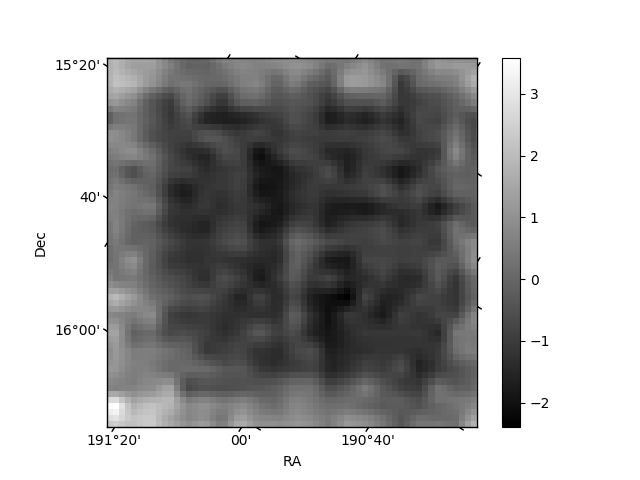
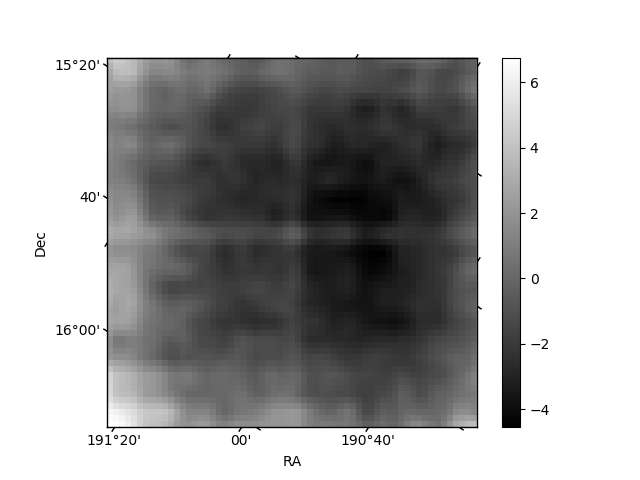
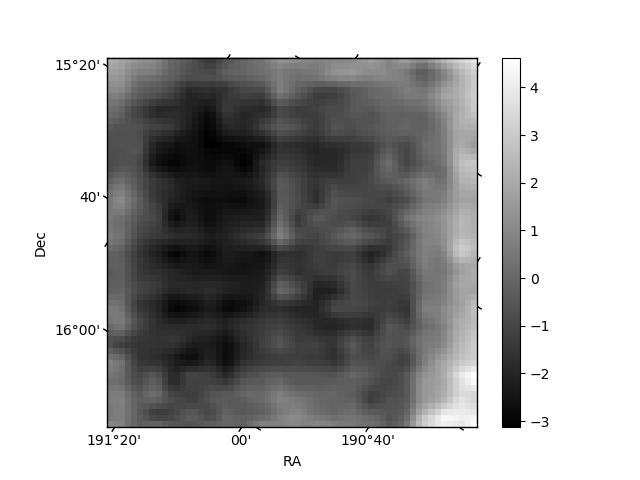
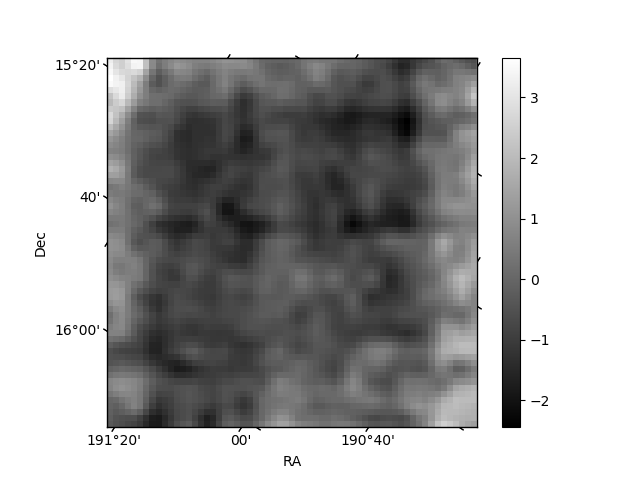
Histogram calculated using DETX and DETY for each event in the final _common_clean file
| Quadrant A | 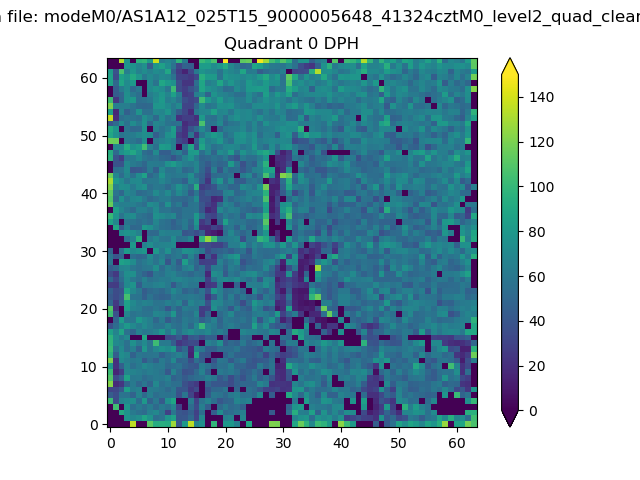 |
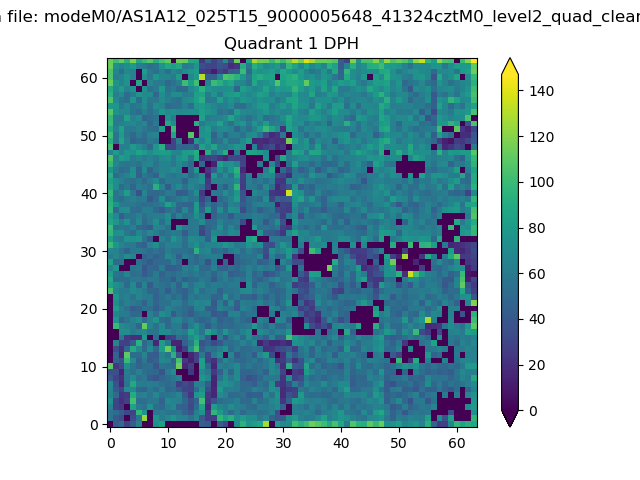 |
Quadrant B |
|---|---|---|---|
| Quadrant D | 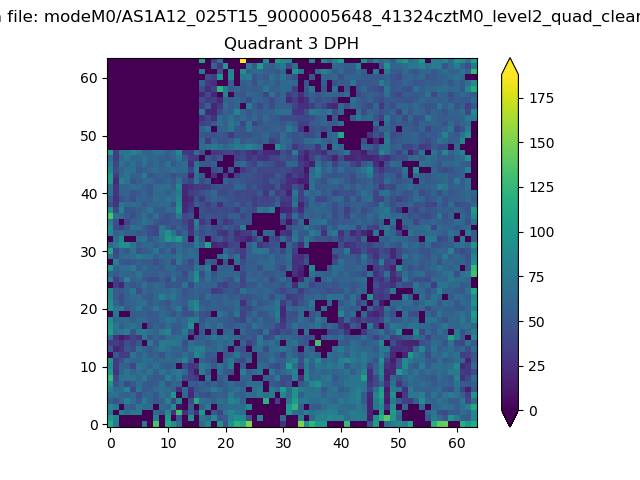 |
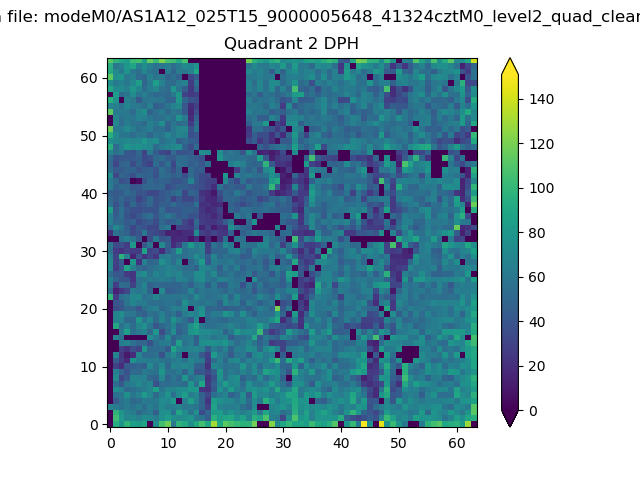 |
Quadrant C |
| Plot type | Count rate plots | Images |
|---|---|---|
| Comparison with Poisson distribution Blue bars denote a histogram of data divided into 1 sec bins. Red curve is a Poisson curve with rate = median count rate of data. |
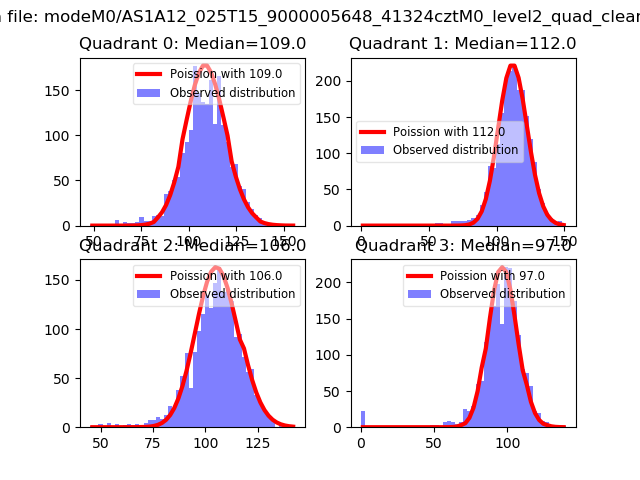 |
 |
| Quadrant-wise count rates Data is divided into 100 sec bins |
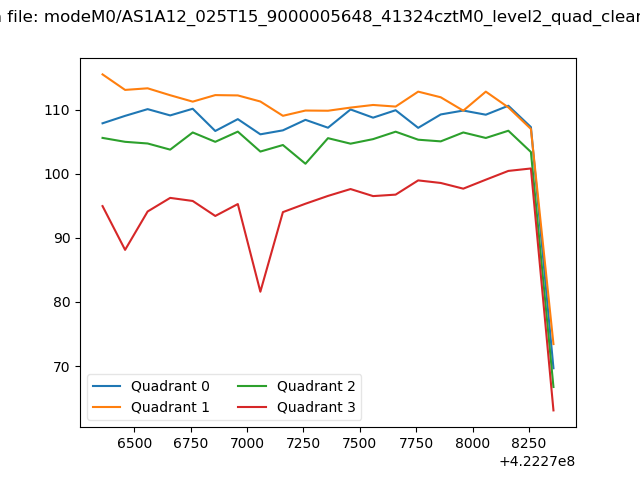 |
|
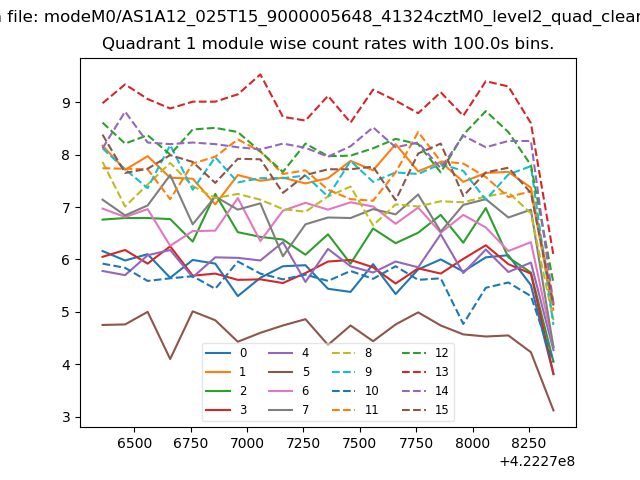
| Module-wise count rates for Quadrant A Data is divided into 100 sec bins |
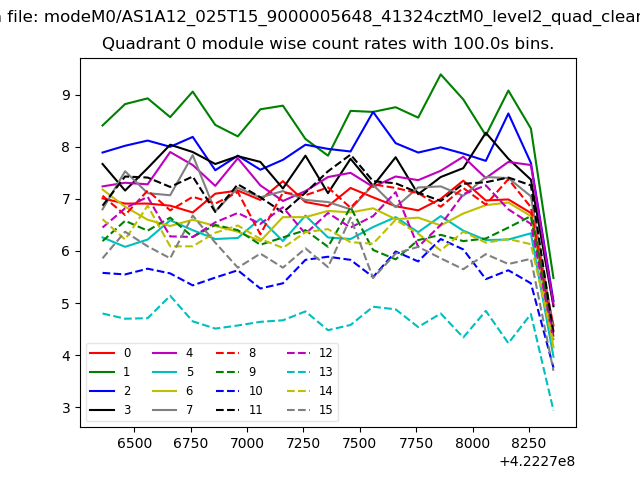 |
 |
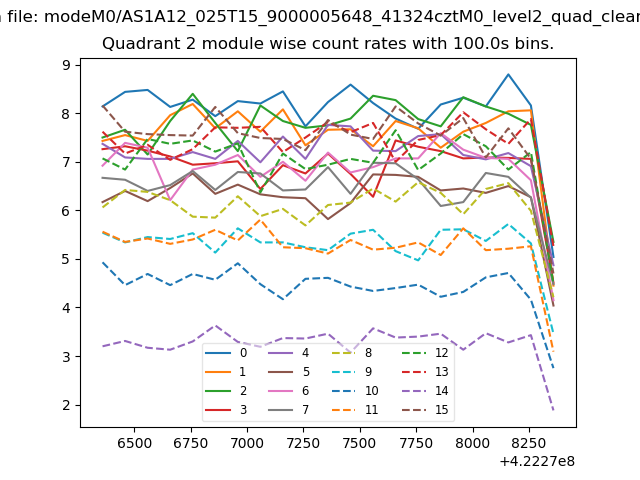
| Module-wise count rates for Quadrant B Data is divided into 100 sec bins |
 |
 |
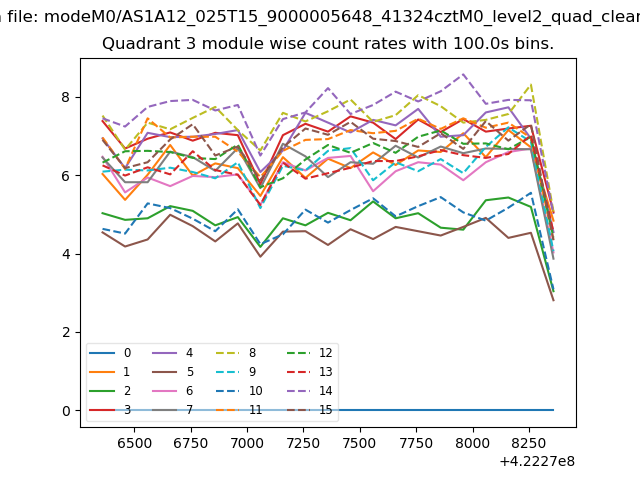
| Module-wise count rates for Quadrant C Data is divided into 100 sec bins |
 |
 |
| Module-wise count rates for Quadrant D Data is divided into 100 sec bins |
 |
 |
| Parameter | Plot |
|---|---|
| CZT HV Monitor | 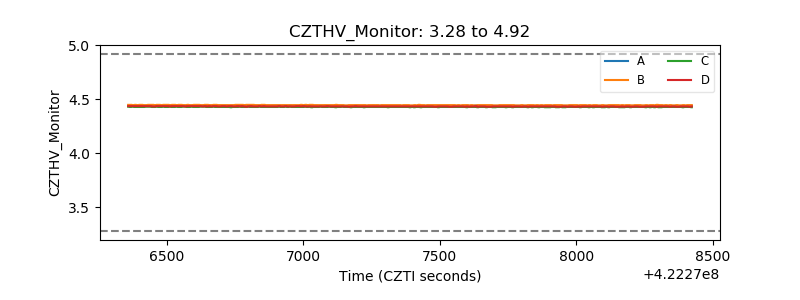 |
| D_VDD | 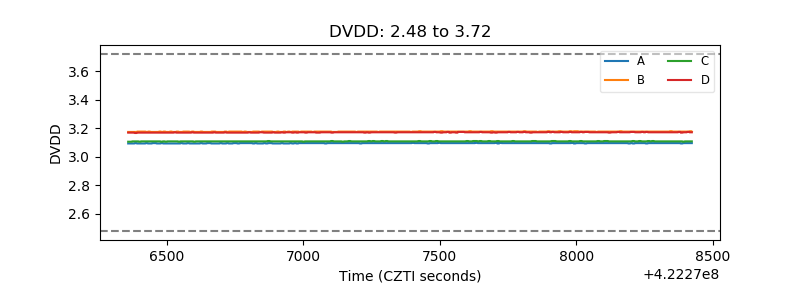 |
| Temperature 1 | 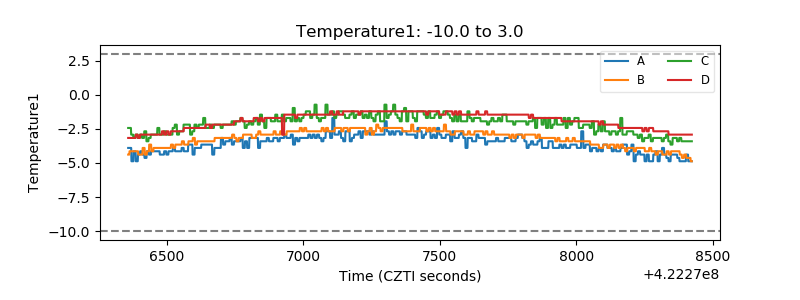 |
| Veto HV Monitor | 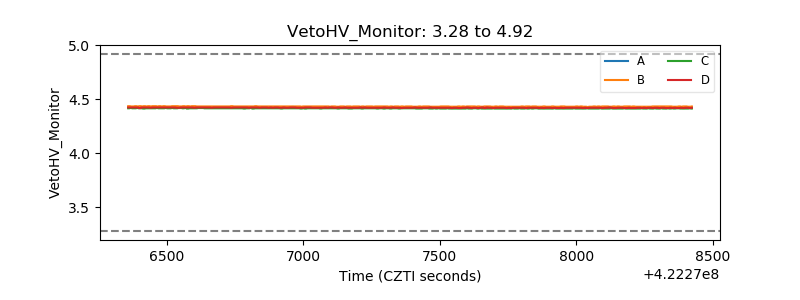 |
| Veto LLD | 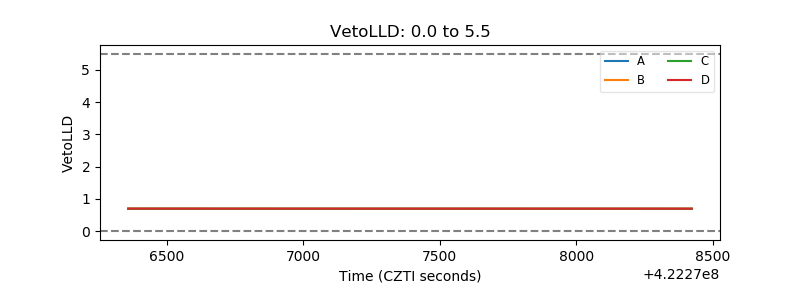 |
| Alpha Counter | 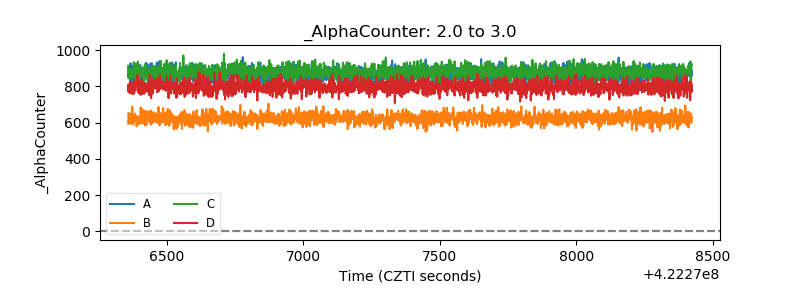 |
| _CPM_Rate | 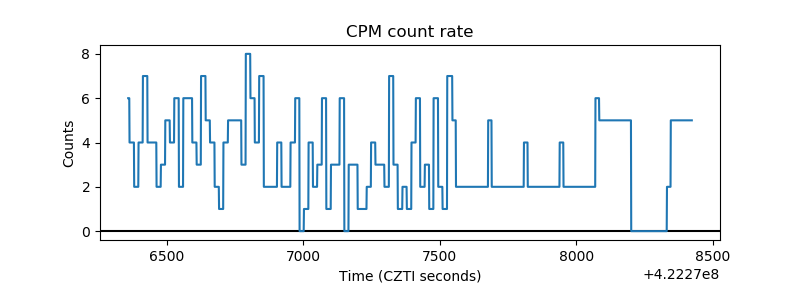 |
| CZT Counter | 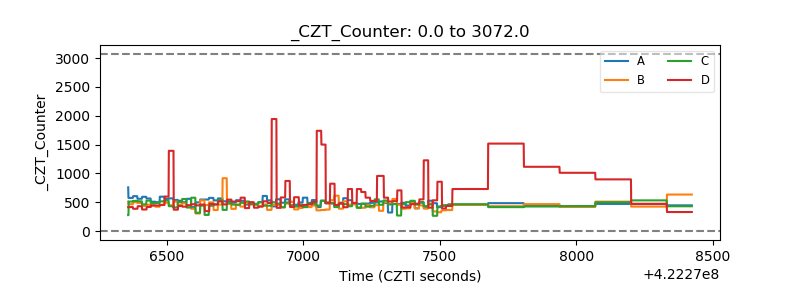 |
| +2.5 Volts monitor | 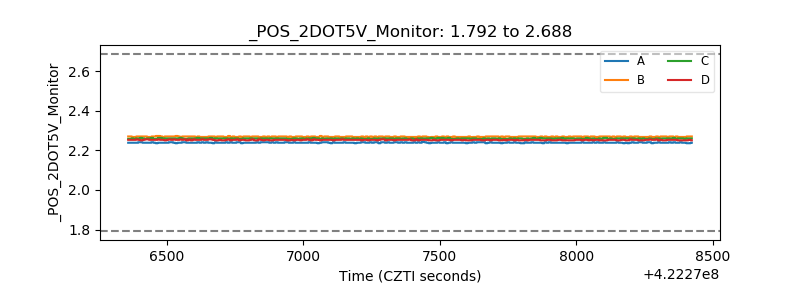 |
| +5 Volts monitor | 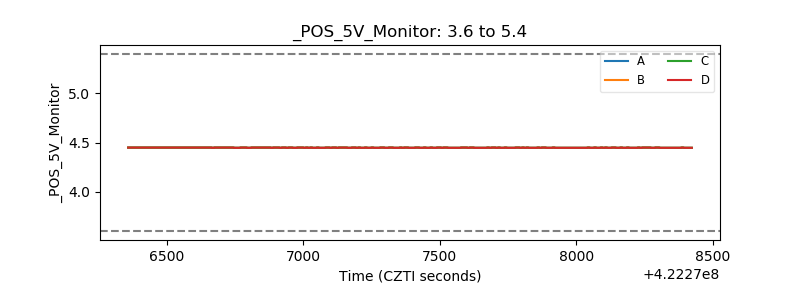 |
| _ROLL_ROT | 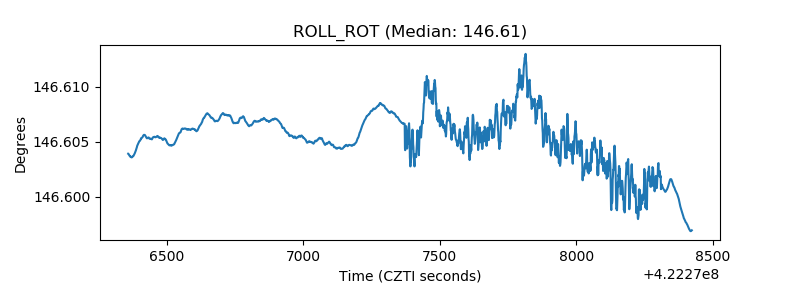 |
| _Roll_DEC | 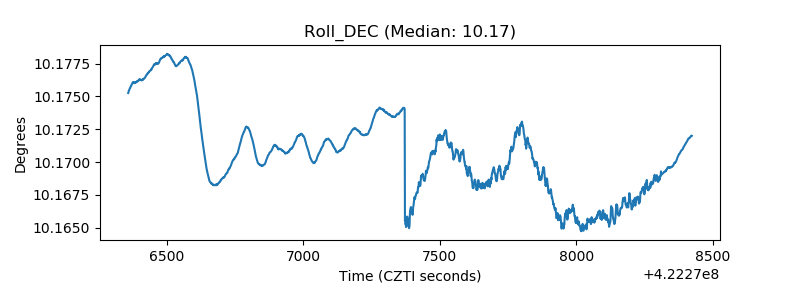 |
| _Roll_RA | 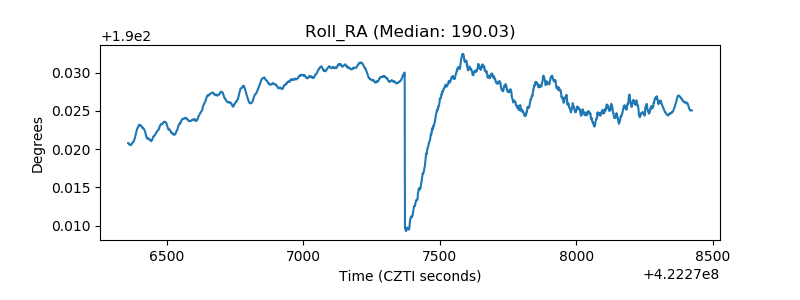 |
| Veto Counter | 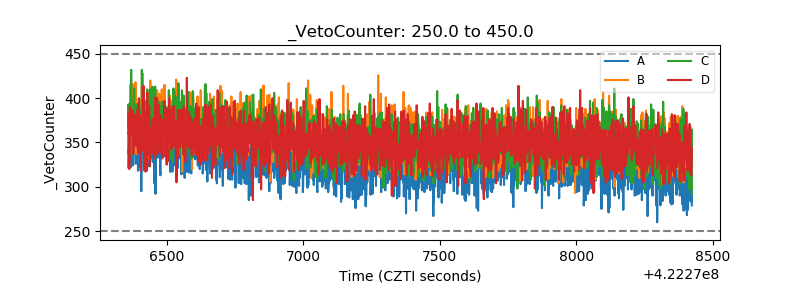 |