| Param | Original file | Final file |
|---|---|---|
| Filename | modeM0/AS1A12_025T16_9000005650_41321cztM0_level2.fits | modeM0/AS1A12_025T16_9000005650_41321cztM0_level2_quad_clean.evt |
| Size (bytes) | 380,174,400 | 97,790,400 |
| Size | 362.6 MB | 93.3 MB |
| Events in quadrant A | 3,156,840 | 662,995 |
| Events in quadrant B | 3,058,407 | 672,097 |
| Events in quadrant C | 3,251,974 | 622,905 |
| Events in quadrant D | 4,138,121 | 583,470 |
| Mode M0 | |||
|---|---|---|---|
| Quadrant | BADHDUFLAG | Total packets | Discarded packets |
| A | 0 | 12996 | 3 |
| B | 0 | 13121 | 2 |
| C | 0 | 13432 | 2 |
| D | 0 | 16491 | 2 |
| Mode M9 | |||
|---|---|---|---|
| Quadrant | BADHDUFLAG | Total packets | Discarded packets |
| A | 0 | 13 | 0 |
| B | 0 | 13 | 0 |
| C | 0 | 13 | 0 |
| D | 0 | 13 | 0 |
| Mode SS | |||
|---|---|---|---|
| Quadrant | BADHDUFLAG | Total packets | Discarded packets |
| A | 0 | 122 | 0 |
| B | 0 | 122 | 0 |
| C | 0 | 122 | 0 |
| D | 0 | 122 | 0 |
| Quadrant | Total seconds | Saturated seconds | Saturation percentage |
|---|---|---|---|
| A | 6007 | 11 | 0.183120% |
| B | 6007 | 60 | 0.998835% |
| C | 6007 | 195 | 3.246213% |
| D | 6007 | 194 | 3.229566% |
Noise dominated data is calculated using 1-second bins in cleaned event files. If a bin has >2000 counts, and if more than 50% of those come from <1% of pixels, then it is considered to be noise-dominated and hence unusable.
| Quadrant | # 1 sec bins | Bins with >0 counts | Bins with >2000 counts | High rate bins dominated by noise | Noise dominated (total time) | Noise dominated (detector-on time) | Marked lightcurve |
|---|---|---|---|---|---|---|---|
| A | 7289 | 6008 | 3 | 3 | 0.04% | 0.05% | 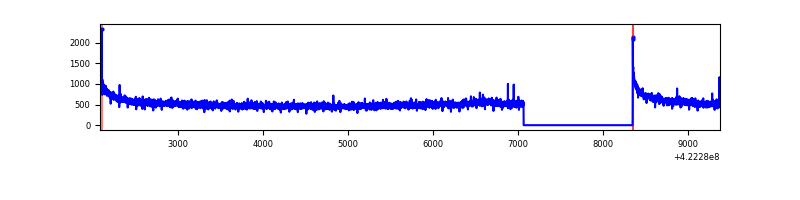 |
| B | 7289 | 6008 | 34 | 34 | 0.47% | 0.57% | 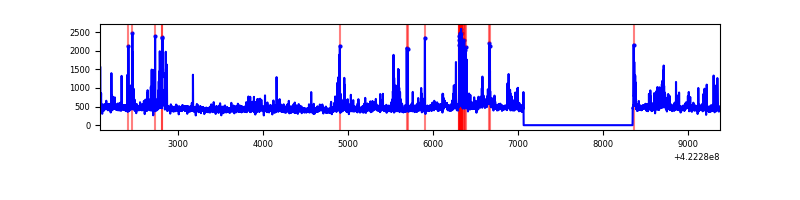 |
| C | 7289 | 6008 | 178 | 178 | 2.44% | 2.96% | 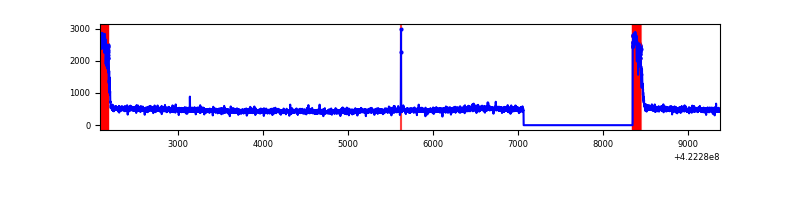 |
| D | 7289 | 6008 | 159 | 159 | 2.18% | 2.65% | 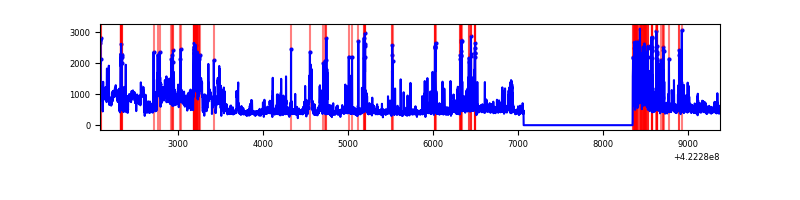 |
Top three noisy pixels from each quadrant. If the there are fewer than three noisy pixels in the level2.evt file, extra rows are filled as -1
| Pixel properties | Quadrant properties | ||||||
|---|---|---|---|---|---|---|---|
| Quadrant | DetID | PixID | Counts | Sigma | Mean | Median | Sigma |
| A | 10 | 83 | 545047 | 3929.91 | 667 | 654 | 138.5 |
| A | 13 | 6 | 12475 | 85.33 | 667 | 654 | 138.5 |
| A | 12 | 189 | 11220 | 76.27 | 667 | 654 | 138.5 |
| B | 5 | 255 | 339057 | 2620.92 | 658 | 640 | 129.1 |
| B | 0 | 190 | 83804 | 644.08 | 658 | 640 | 129.1 |
| B | 0 | 155 | 34444 | 261.8 | 658 | 640 | 129.1 |
| C | 0 | 10 | 508688 | 3379.79 | 637 | 640 | 150.3 |
| C | 15 | 214 | 252751 | 1677.17 | 637 | 640 | 150.3 |
| C | 15 | 159 | 7440 | 45.24 | 637 | 640 | 150.3 |
| D | 2 | 120 | 580954 | 3668.32 | 644 | 625 | 158.2 |
| D | 2 | 249 | 327673 | 2067.3 | 644 | 625 | 158.2 |
| D | 13 | 249 | 303362 | 1913.63 | 644 | 625 | 158.2 |
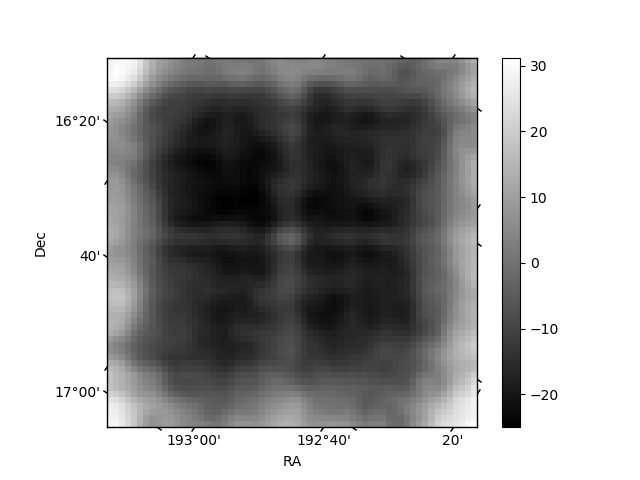
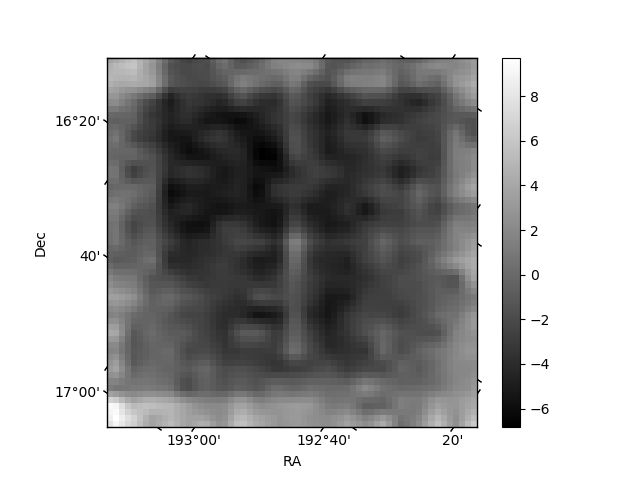
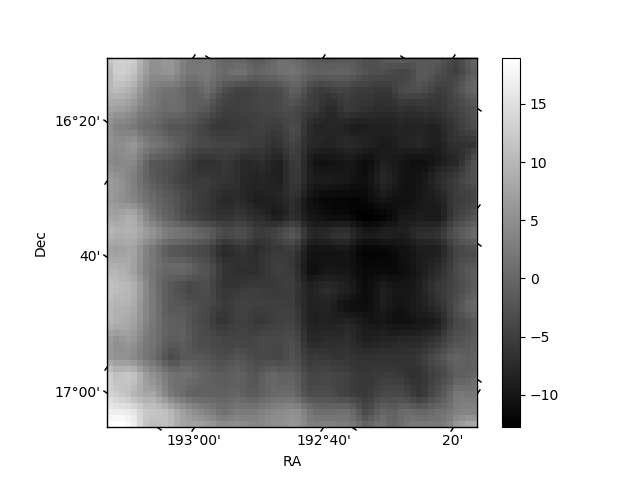
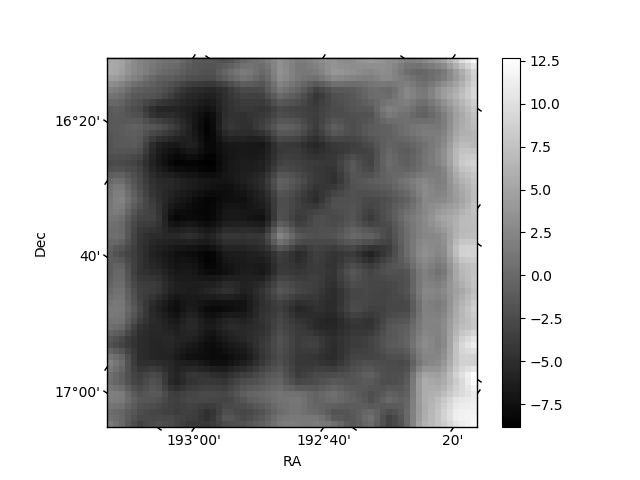
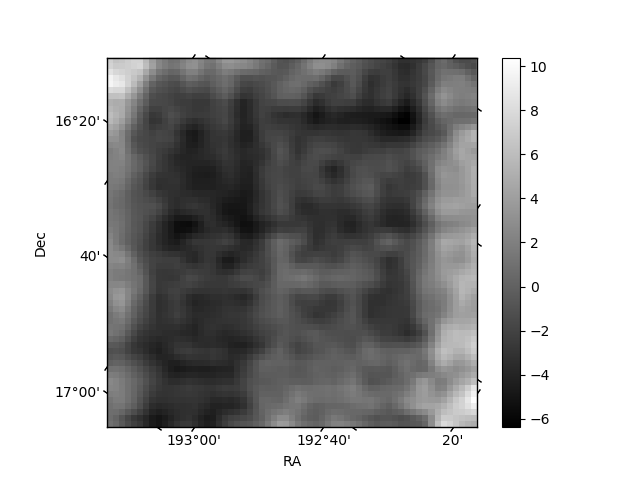
Histogram calculated using DETX and DETY for each event in the final _common_clean file
| Quadrant A | 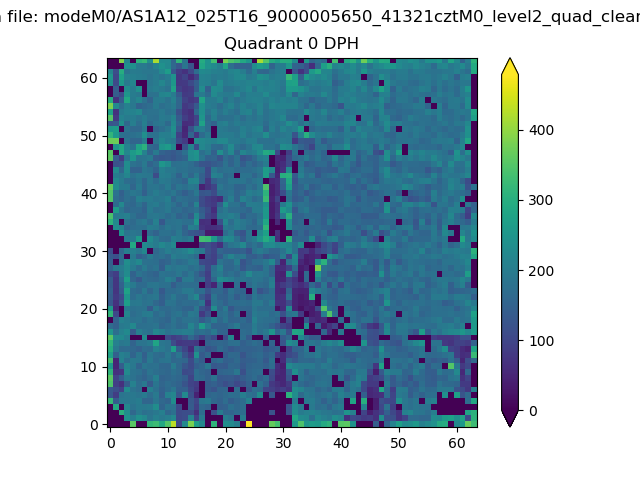 |
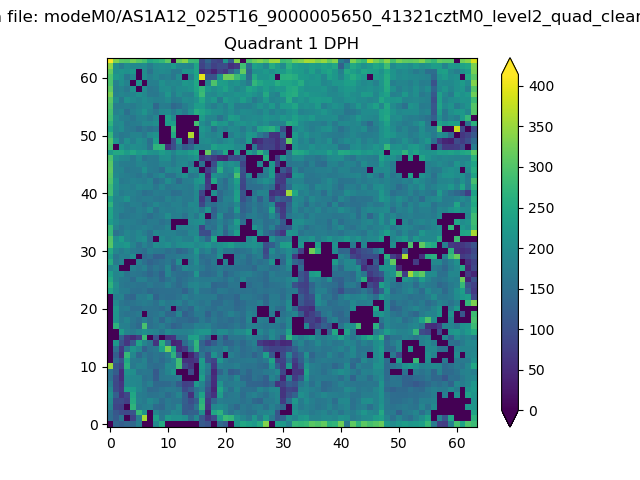 |
Quadrant B |
|---|---|---|---|
| Quadrant D | 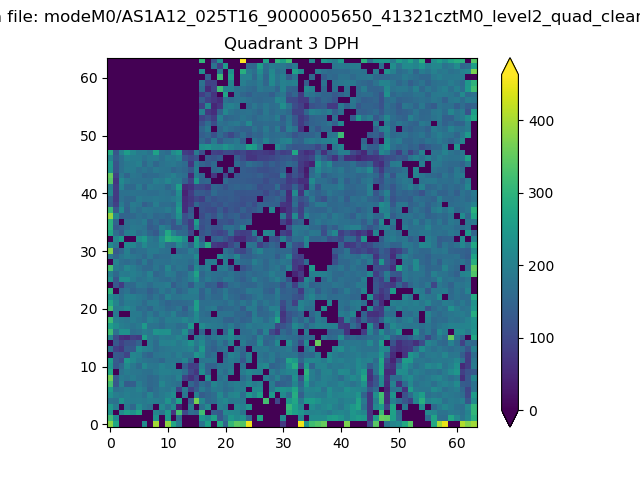 |
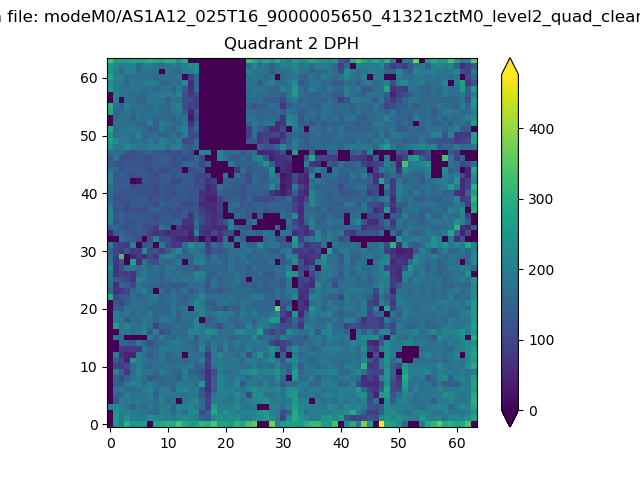 |
Quadrant C |
| Plot type | Count rate plots | Images |
|---|---|---|
| Comparison with Poisson distribution Blue bars denote a histogram of data divided into 1 sec bins. Red curve is a Poisson curve with rate = median count rate of data. |
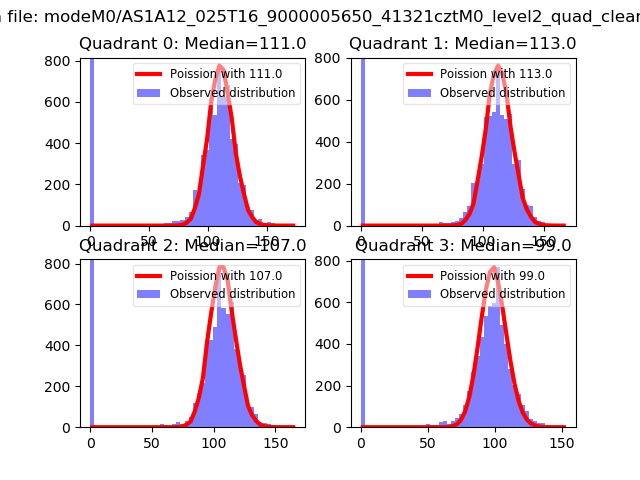 |
 |
| Quadrant-wise count rates Data is divided into 100 sec bins |
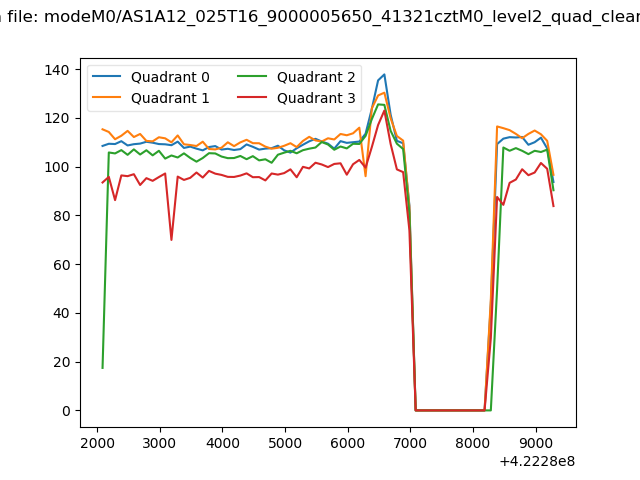 |
|
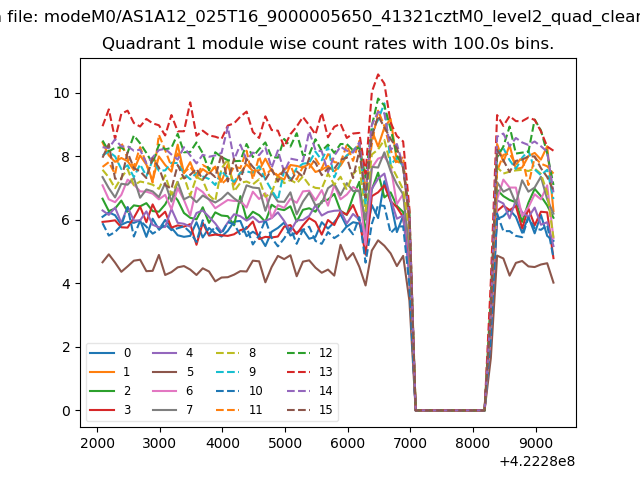
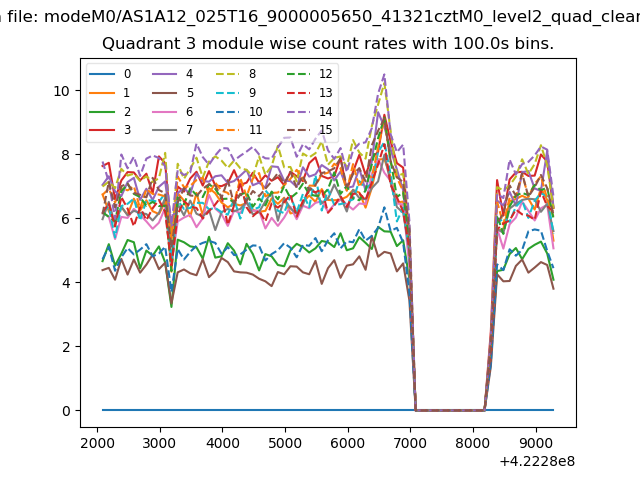
| Module-wise count rates for Quadrant A Data is divided into 100 sec bins |
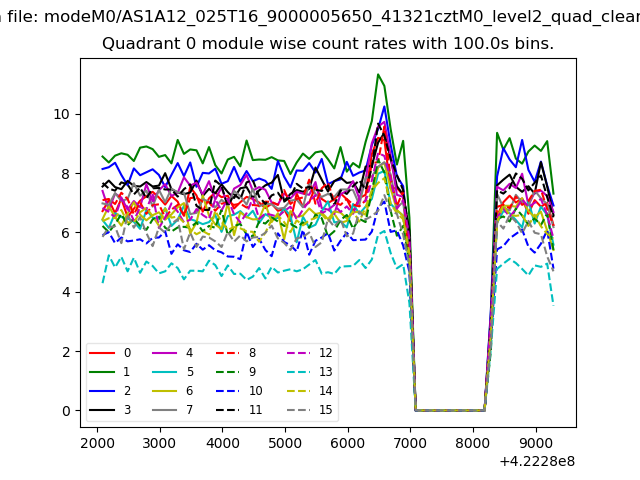 |
 |
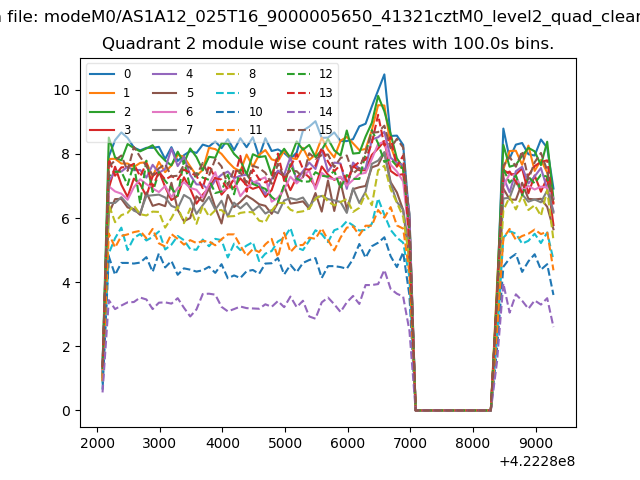
| Module-wise count rates for Quadrant B Data is divided into 100 sec bins |
 |
 |
| Module-wise count rates for Quadrant C Data is divided into 100 sec bins |
 |
 |
| Module-wise count rates for Quadrant D Data is divided into 100 sec bins |
 |
 |
| Parameter | Plot |
|---|---|
| CZT HV Monitor | 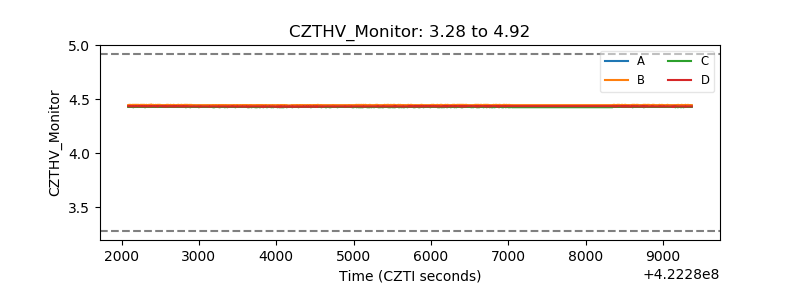 |
| D_VDD | 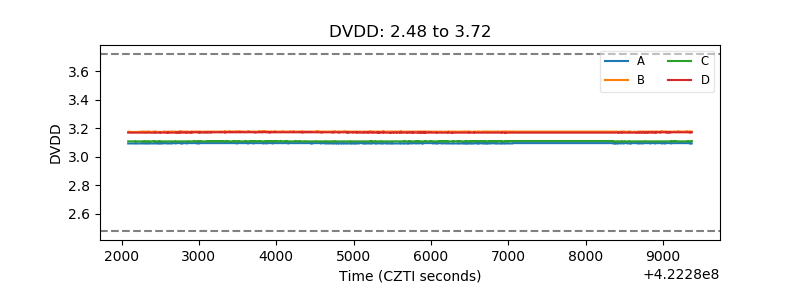 |
| Temperature 1 | 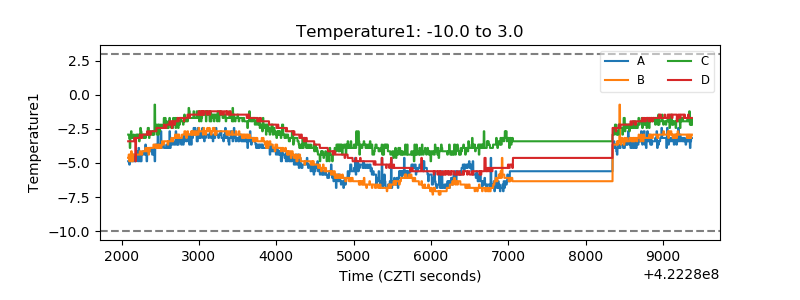 |
| Veto HV Monitor | 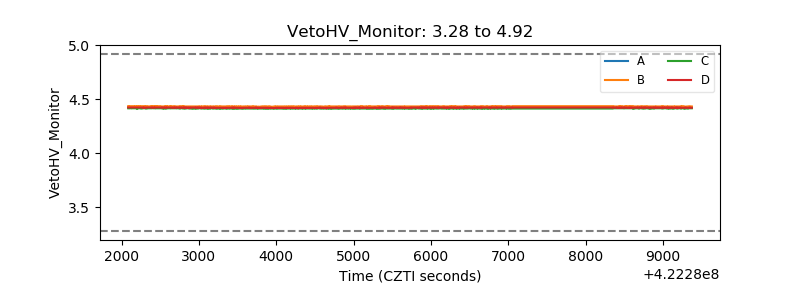 |
| Veto LLD | 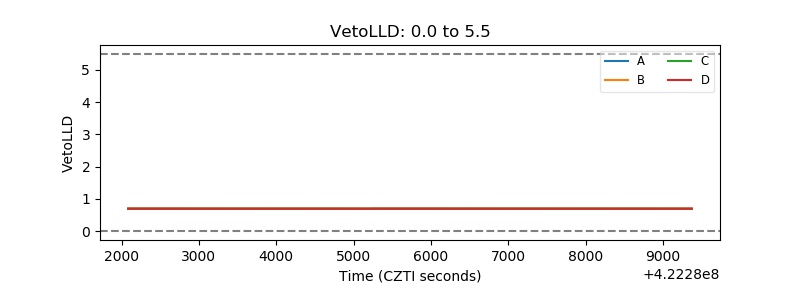 |
| Alpha Counter | 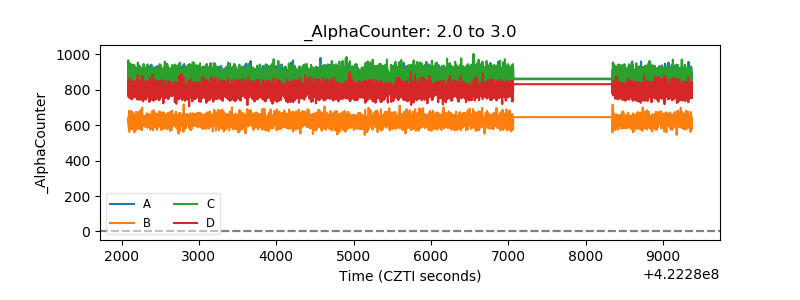 |
| _CPM_Rate | 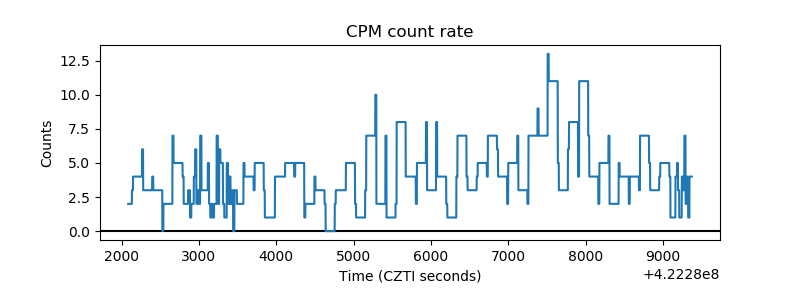 |
| CZT Counter | 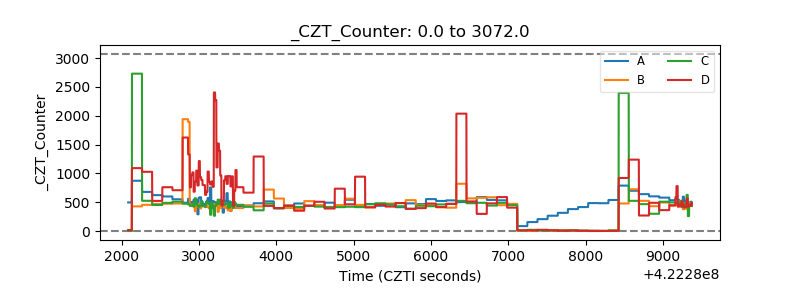 |
| +2.5 Volts monitor | 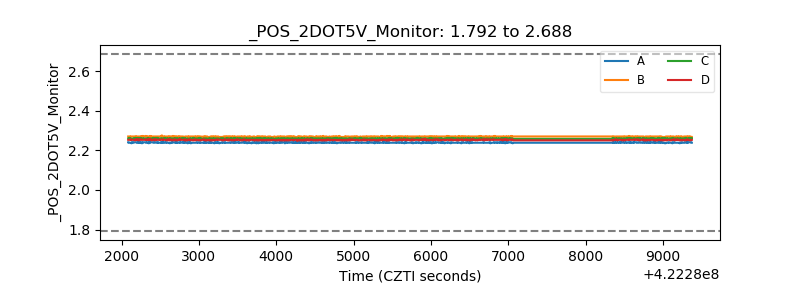 |
| +5 Volts monitor | 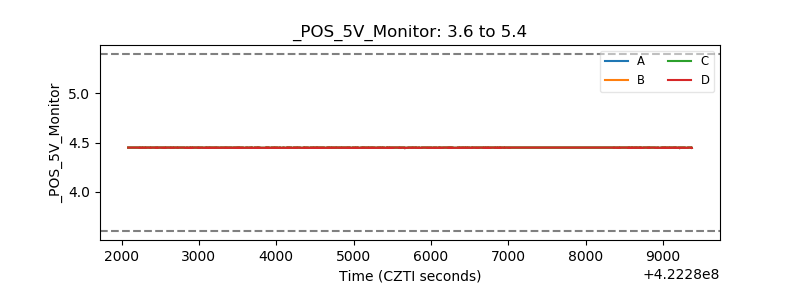 |
| _ROLL_ROT |  |
| _Roll_DEC | 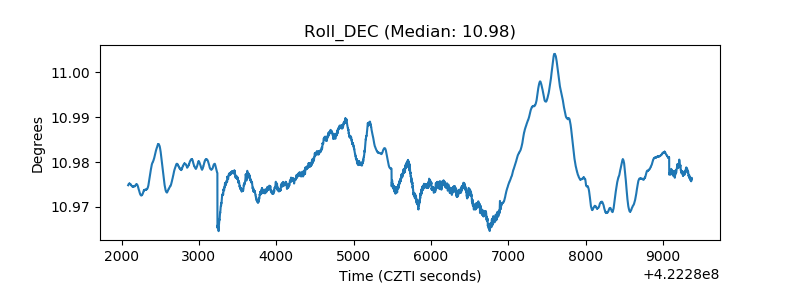 |
| _Roll_RA | 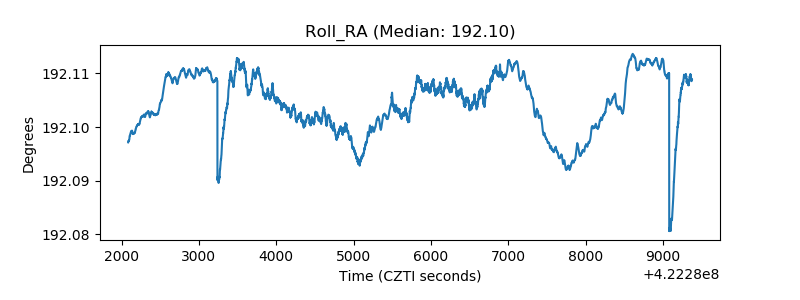 |
| Veto Counter |  |