| Param | Original file | Final file |
|---|---|---|
| Filename | modeM0/AS1A12_025T16_9000005650_41323cztM0_level2.fits | modeM0/AS1A12_025T16_9000005650_41323cztM0_level2_quad_clean.evt |
| Size (bytes) | 353,116,800 | 94,953,600 |
| Size | 336.8 MB | 90.6 MB |
| Events in quadrant A | 3,052,032 | 642,073 |
| Events in quadrant B | 2,996,659 | 651,134 |
| Events in quadrant C | 3,025,660 | 605,019 |
| Events in quadrant D | 3,541,402 | 568,803 |
| Mode M0 | |||
|---|---|---|---|
| Quadrant | BADHDUFLAG | Total packets | Discarded packets |
| A | 0 | 12668 | 1 |
| B | 0 | 12850 | 1 |
| C | 0 | 12710 | 1 |
| D | 0 | 14609 | 1 |
| Mode M9 | |||
|---|---|---|---|
| Quadrant | BADHDUFLAG | Total packets | Discarded packets |
| A | 0 | 14 | 0 |
| B | 0 | 14 | 0 |
| C | 0 | 14 | 0 |
| D | 0 | 14 | 0 |
| Mode SS | |||
|---|---|---|---|
| Quadrant | BADHDUFLAG | Total packets | Discarded packets |
| A | 0 | 116 | 0 |
| B | 0 | 116 | 0 |
| C | 0 | 116 | 0 |
| D | 0 | 116 | 0 |
| Quadrant | Total seconds | Saturated seconds | Saturation percentage |
|---|---|---|---|
| A | 5848 | 11 | 0.188098% |
| B | 5848 | 60 | 1.025992% |
| C | 5848 | 133 | 2.274282% |
| D | 5848 | 146 | 2.496580% |
Noise dominated data is calculated using 1-second bins in cleaned event files. If a bin has >2000 counts, and if more than 50% of those come from <1% of pixels, then it is considered to be noise-dominated and hence unusable.
| Quadrant | # 1 sec bins | Bins with >0 counts | Bins with >2000 counts | High rate bins dominated by noise | Noise dominated (total time) | Noise dominated (detector-on time) | Marked lightcurve |
|---|---|---|---|---|---|---|---|
| A | 7190 | 5849 | 3 | 3 | 0.04% | 0.05% | 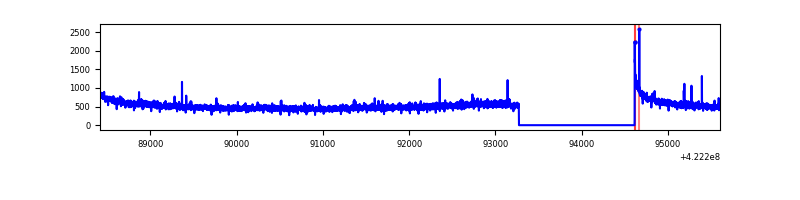 |
| B | 7190 | 5849 | 36 | 36 | 0.50% | 0.62% | 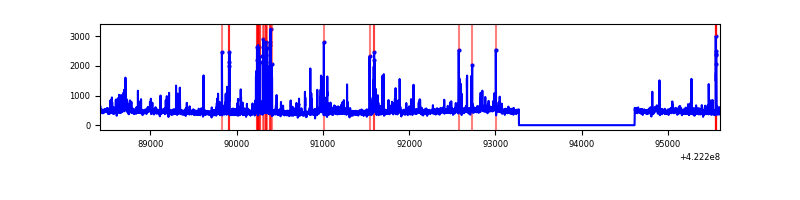 |
| C | 7190 | 5849 | 118 | 118 | 1.64% | 2.02% | 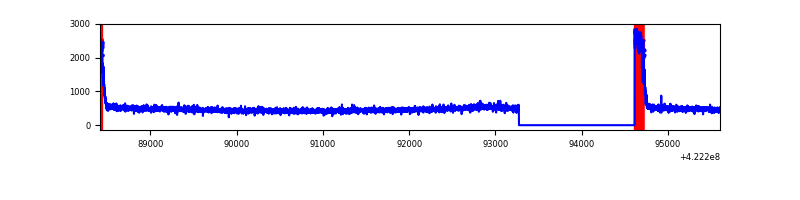 |
| D | 7190 | 5849 | 126 | 126 | 1.75% | 2.15% | 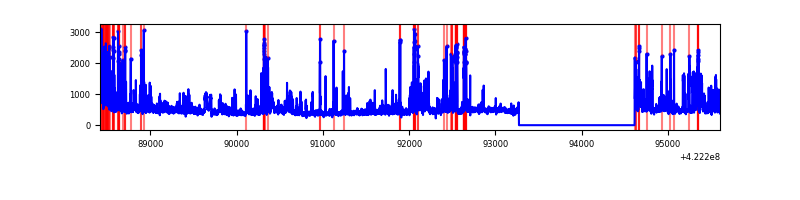 |
Top three noisy pixels from each quadrant. If the there are fewer than three noisy pixels in the level2.evt file, extra rows are filled as -1
| Pixel properties | Quadrant properties | ||||||
|---|---|---|---|---|---|---|---|
| Quadrant | DetID | PixID | Counts | Sigma | Mean | Median | Sigma |
| A | 10 | 83 | 508628 | 3767.23 | 646 | 631 | 134.8 |
| A | 12 | 189 | 26310 | 190.43 | 646 | 631 | 134.8 |
| A | 2 | 79 | 22173 | 159.75 | 646 | 631 | 134.8 |
| B | 5 | 255 | 345193 | 2731.98 | 637 | 618 | 126.1 |
| B | 0 | 190 | 88181 | 694.25 | 637 | 618 | 126.1 |
| B | 5 | 252 | 30566 | 237.44 | 637 | 618 | 126.1 |
| C | 0 | 10 | 350124 | 2392.47 | 622 | 626 | 146.1 |
| C | 15 | 214 | 248311 | 1695.51 | 622 | 626 | 146.1 |
| C | 13 | 61 | 4020 | 23.23 | 622 | 626 | 146.1 |
| D | 2 | 249 | 391042 | 2531.72 | 624 | 606 | 154.2 |
| D | 2 | 120 | 172411 | 1114.04 | 624 | 606 | 154.2 |
| D | 5 | 222 | 159071 | 1027.54 | 624 | 606 | 154.2 |
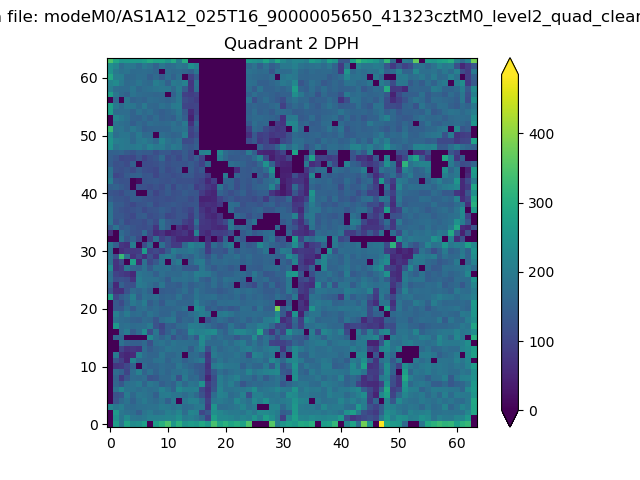
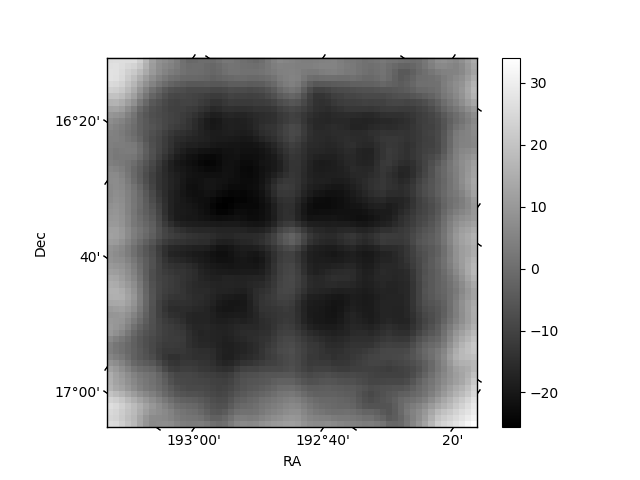
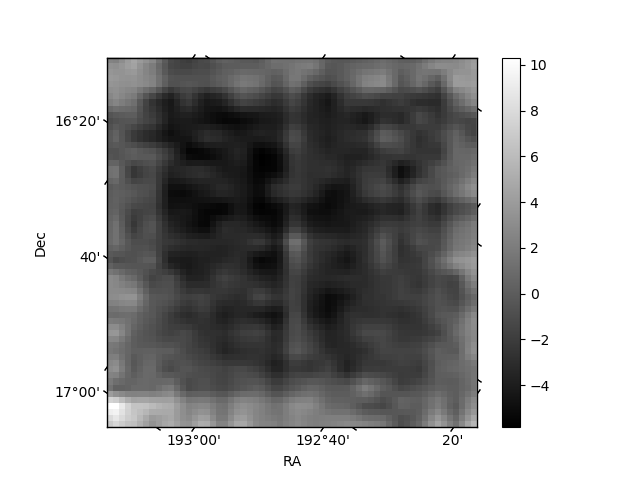
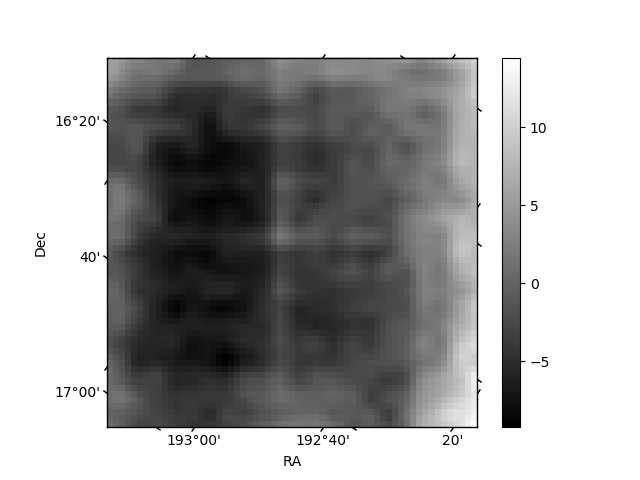
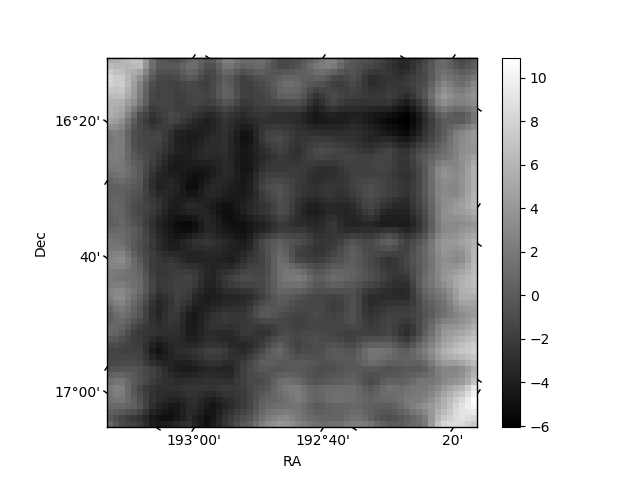
Histogram calculated using DETX and DETY for each event in the final _common_clean file
| Quadrant A | 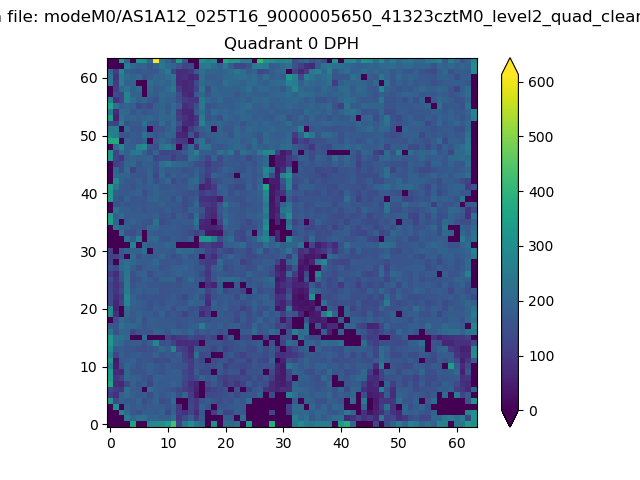 |
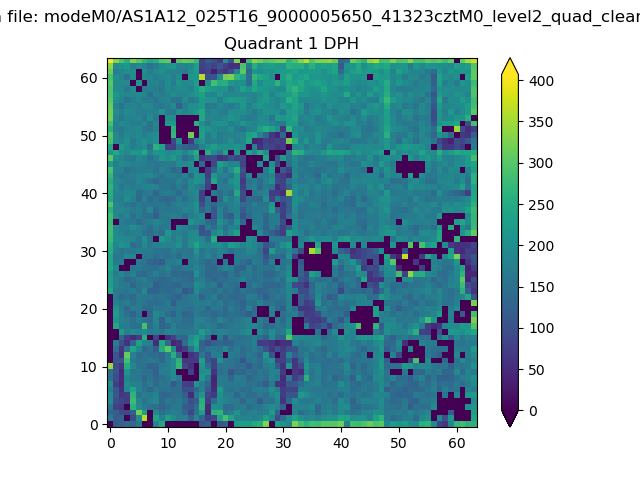 |
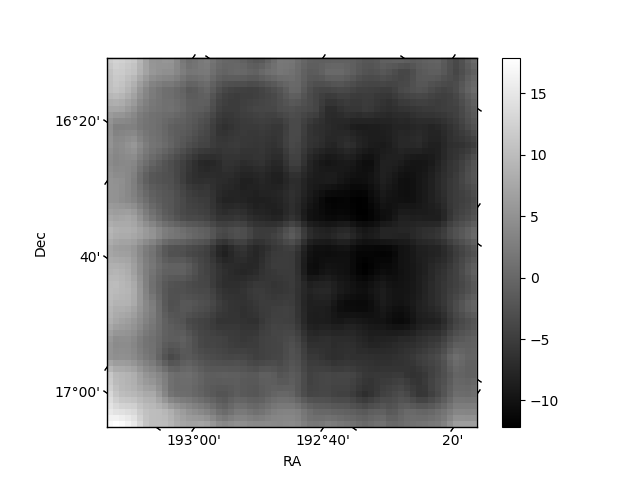
Quadrant B |
|---|---|---|---|
| Quadrant D | 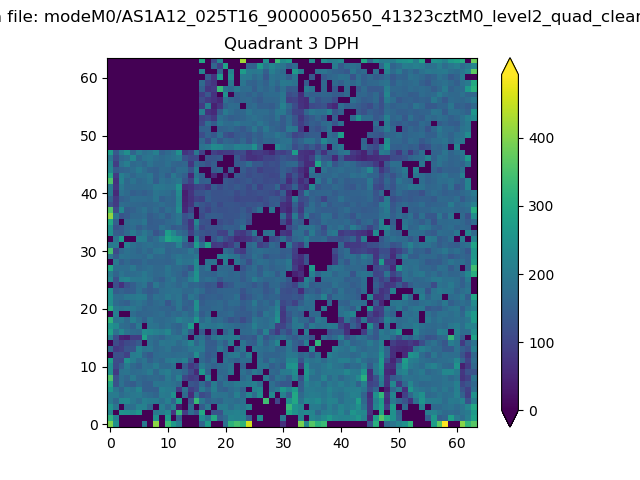 |
 |
Quadrant C |
| Plot type | Count rate plots | Images |
|---|---|---|
| Comparison with Poisson distribution Blue bars denote a histogram of data divided into 1 sec bins. Red curve is a Poisson curve with rate = median count rate of data. |
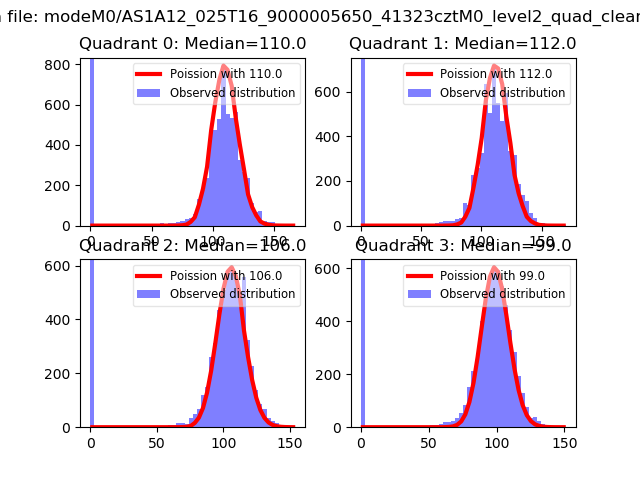 |
 |
| Quadrant-wise count rates Data is divided into 100 sec bins |
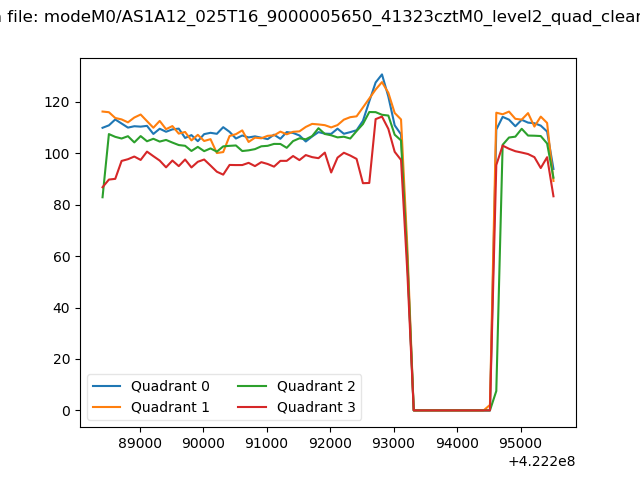 |
|
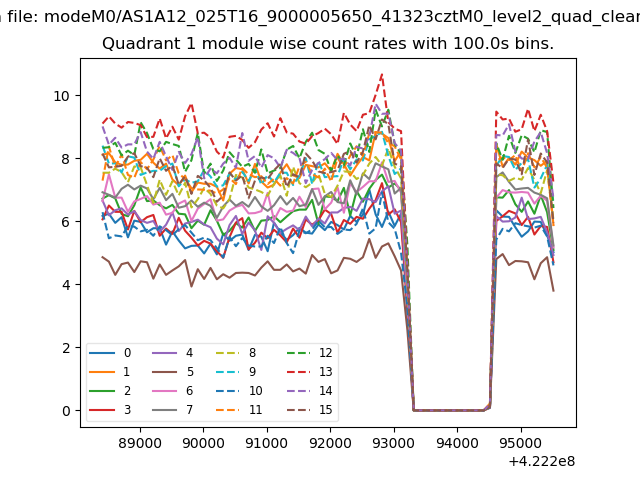
| Module-wise count rates for Quadrant A Data is divided into 100 sec bins |
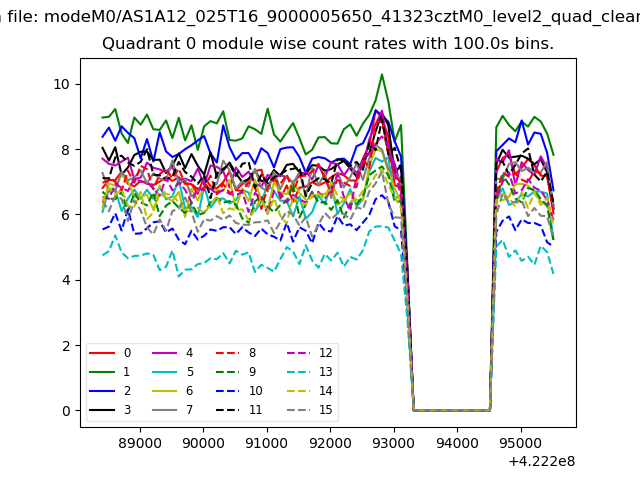 |
 |
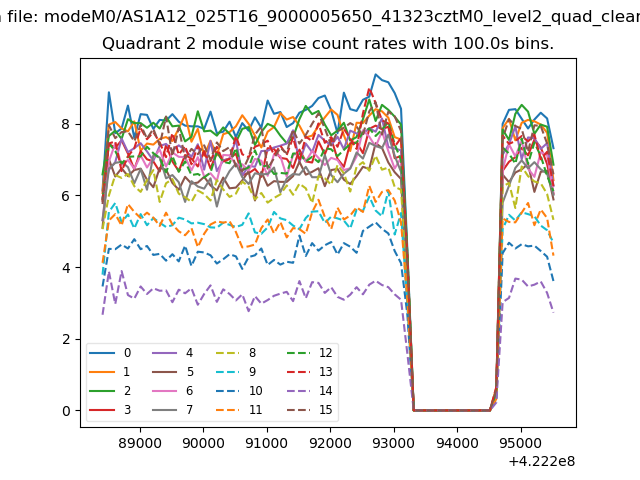
| Module-wise count rates for Quadrant B Data is divided into 100 sec bins |
 |
 |
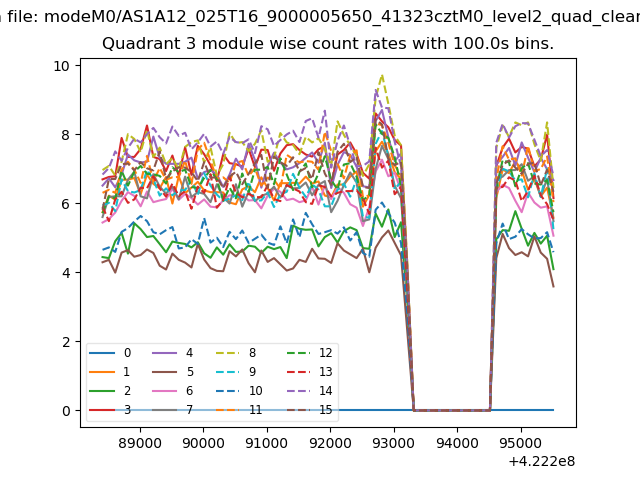
| Module-wise count rates for Quadrant C Data is divided into 100 sec bins |
 |
 |
| Module-wise count rates for Quadrant D Data is divided into 100 sec bins |
 |
 |
| Parameter | Plot |
|---|---|
| CZT HV Monitor | 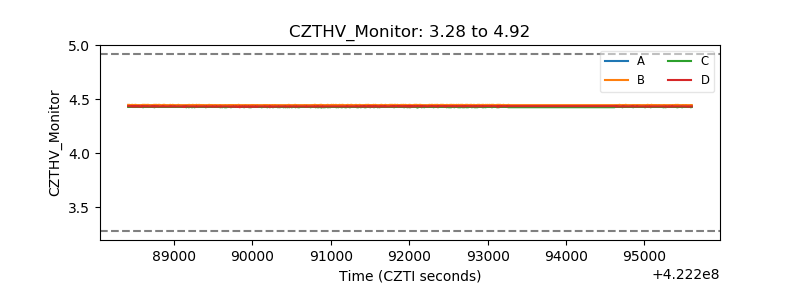 |
| D_VDD | 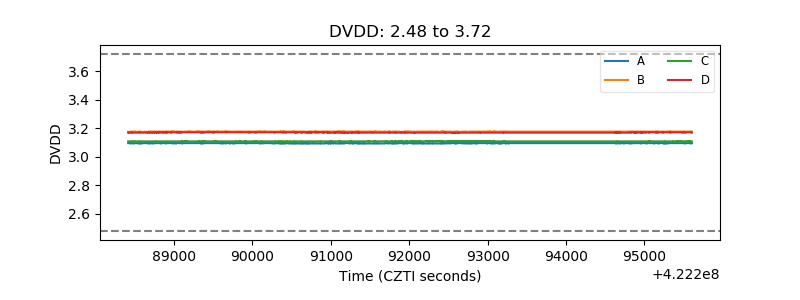 |
| Temperature 1 | 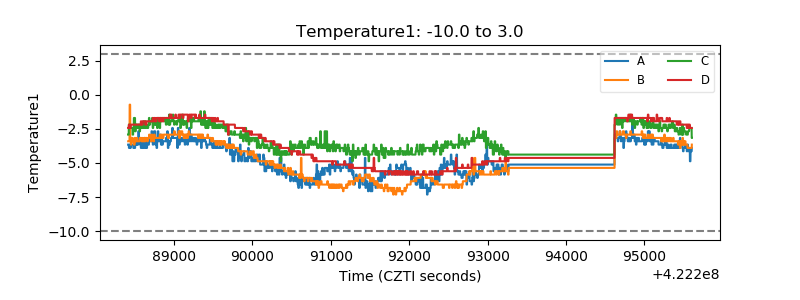 |
| Veto HV Monitor | 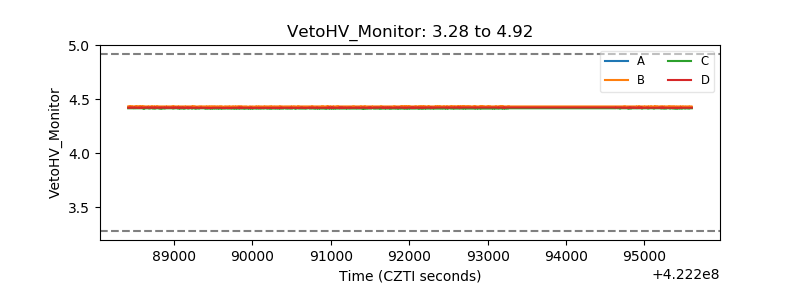 |
| Veto LLD | 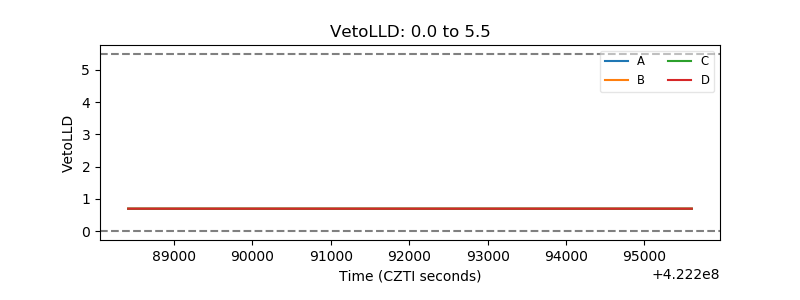 |
| Alpha Counter | 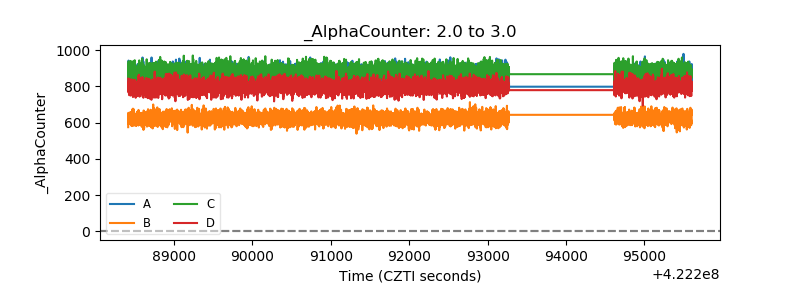 |
| _CPM_Rate | 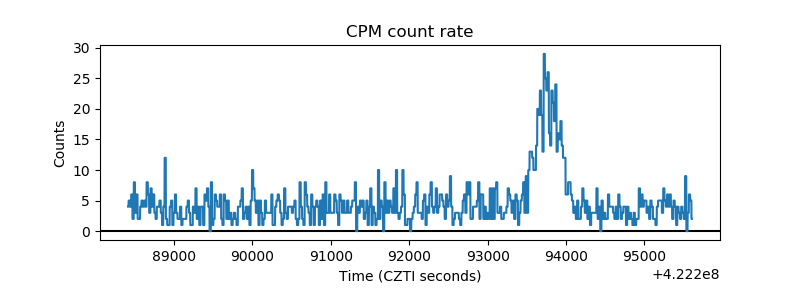 |
| CZT Counter | 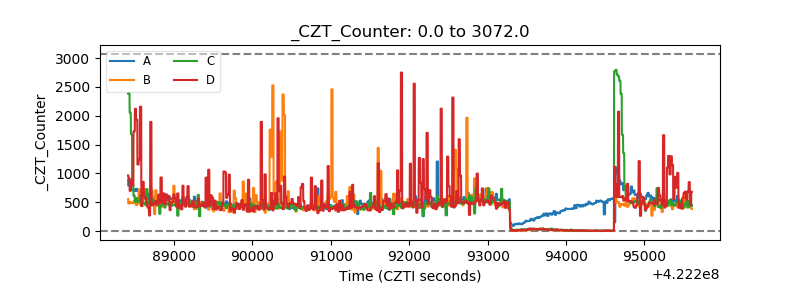 |
| +2.5 Volts monitor | 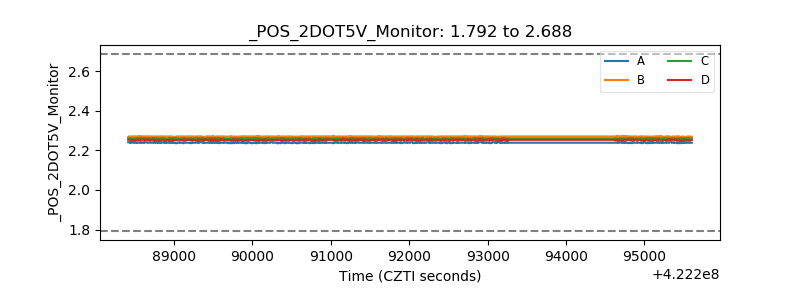 |
| +5 Volts monitor | 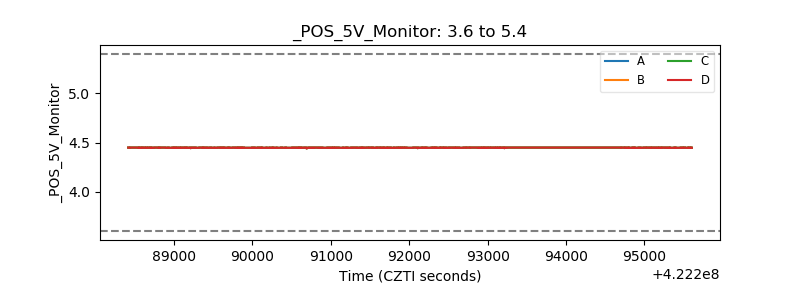 |
| _ROLL_ROT | 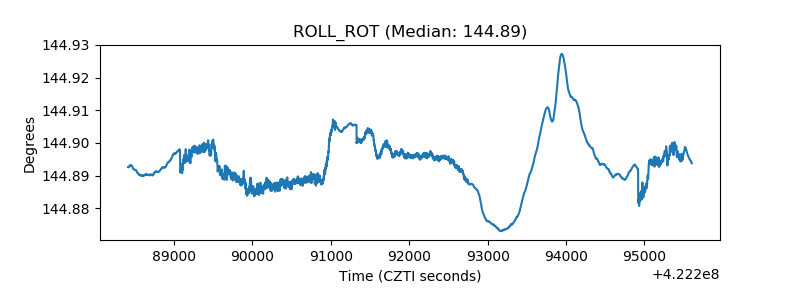 |
| _Roll_DEC | 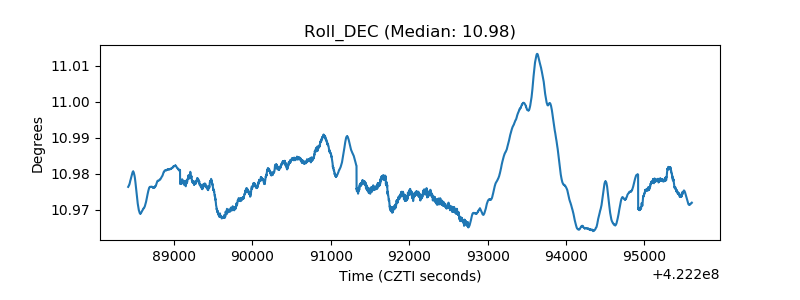 |
| _Roll_RA | 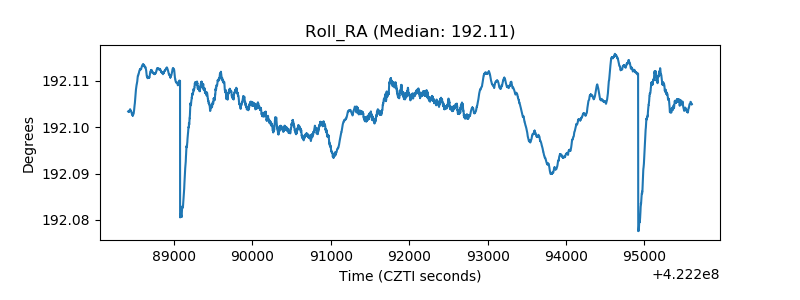 |
| Veto Counter | 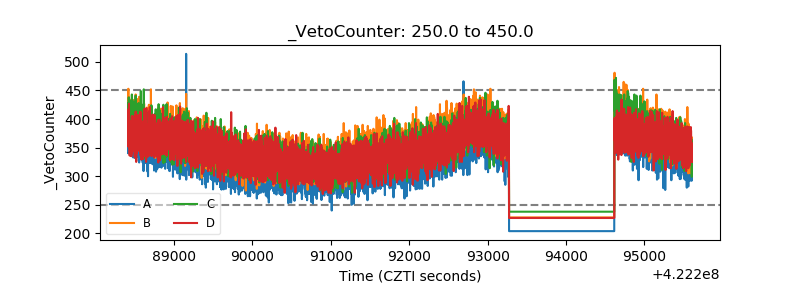 |