| Param | Original file | Final file |
|---|---|---|
| Filename | modeM0/AS1A12_025T16_9000005650_41324cztM0_level2.fits | modeM0/AS1A12_025T16_9000005650_41324cztM0_level2_quad_clean.evt |
| Size (bytes) | 188,303,040 | 46,229,760 |
| Size | 179.6 MB | 44.1 MB |
| Events in quadrant A | 1,503,858 | 311,555 |
| Events in quadrant B | 1,631,695 | 315,559 |
| Events in quadrant C | 1,579,261 | 293,954 |
| Events in quadrant D | 2,034,576 | 277,183 |
| Mode M0 | |||
|---|---|---|---|
| Quadrant | BADHDUFLAG | Total packets | Discarded packets |
| A | 0 | 6113 | 2 |
| B | 0 | 6707 | 1 |
| C | 0 | 6369 | 1 |
| D | 0 | 8046 | 1 |
| Mode M9 | |||
|---|---|---|---|
| Quadrant | BADHDUFLAG | Total packets | Discarded packets |
| A | 0 | 13 | 0 |
| B | 0 | 13 | 0 |
| C | 0 | 13 | 0 |
| D | 0 | 13 | 0 |
| Mode SS | |||
|---|---|---|---|
| Quadrant | BADHDUFLAG | Total packets | Discarded packets |
| A | 0 | 60 | 0 |
| B | 0 | 60 | 0 |
| C | 0 | 60 | 0 |
| D | 0 | 60 | 0 |
| Quadrant | Total seconds | Saturated seconds | Saturation percentage |
|---|---|---|---|
| A | 2816 | 7 | 0.248580% |
| B | 2816 | 71 | 2.521307% |
| C | 2816 | 100 | 3.551136% |
| D | 2816 | 54 | 1.917614% |
Noise dominated data is calculated using 1-second bins in cleaned event files. If a bin has >2000 counts, and if more than 50% of those come from <1% of pixels, then it is considered to be noise-dominated and hence unusable.
| Quadrant | # 1 sec bins | Bins with >0 counts | Bins with >2000 counts | High rate bins dominated by noise | Noise dominated (total time) | Noise dominated (detector-on time) | Marked lightcurve |
|---|---|---|---|---|---|---|---|
| A | 4159 | 2817 | 3 | 3 | 0.07% | 0.11% | 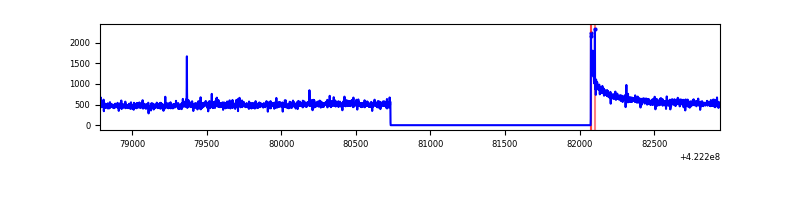 |
| B | 4159 | 2817 | 43 | 43 | 1.03% | 1.53% | 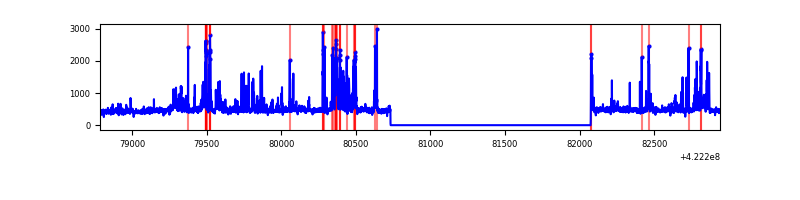 |
| C | 4159 | 2817 | 94 | 94 | 2.26% | 3.34% | 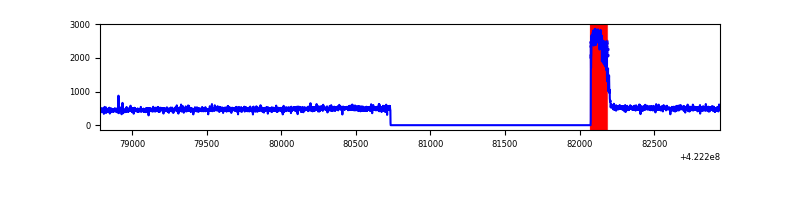 |
| D | 4158 | 2816 | 47 | 47 | 1.13% | 1.67% | 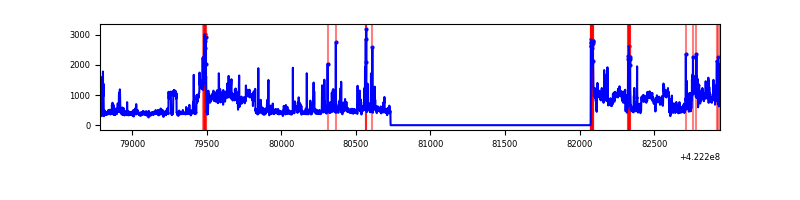 |
Top three noisy pixels from each quadrant. If the there are fewer than three noisy pixels in the level2.evt file, extra rows are filled as -1
| Pixel properties | Quadrant properties | ||||||
|---|---|---|---|---|---|---|---|
| Quadrant | DetID | PixID | Counts | Sigma | Mean | Median | Sigma |
| A | 10 | 83 | 255974 | 3829.82 | 317 | 310 | 66.8 |
| A | 12 | 189 | 8080 | 116.39 | 317 | 310 | 66.8 |
| A | 2 | 79 | 7370 | 105.76 | 317 | 310 | 66.8 |
| B | 5 | 255 | 356804 | 5658.48 | 314 | 304 | 63.0 |
| B | 0 | 190 | 34026 | 535.25 | 314 | 304 | 63.0 |
| B | 12 | 111 | 8168 | 124.82 | 314 | 304 | 63.0 |
| C | 0 | 10 | 279209 | 3848.3 | 302 | 304 | 72.5 |
| C | 15 | 214 | 118733 | 1634.07 | 302 | 304 | 72.5 |
| C | 8 | 79 | 2730 | 33.47 | 302 | 304 | 72.5 |
| D | 2 | 120 | 551461 | 7209.21 | 303 | 294 | 76.5 |
| D | 2 | 249 | 87027 | 1134.46 | 303 | 294 | 76.5 |
| D | 1 | 47 | 86532 | 1127.98 | 303 | 294 | 76.5 |
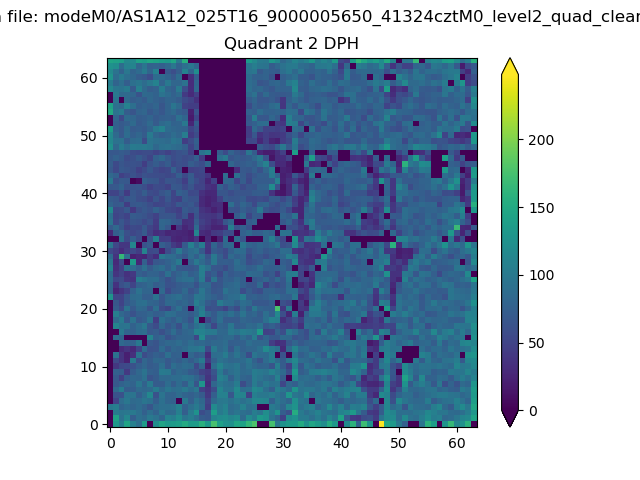
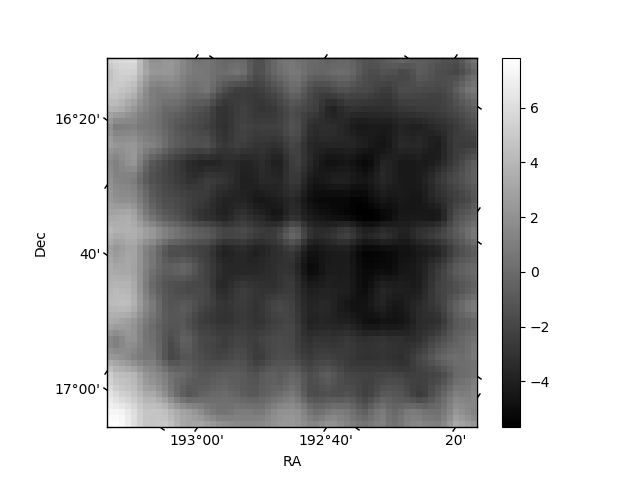
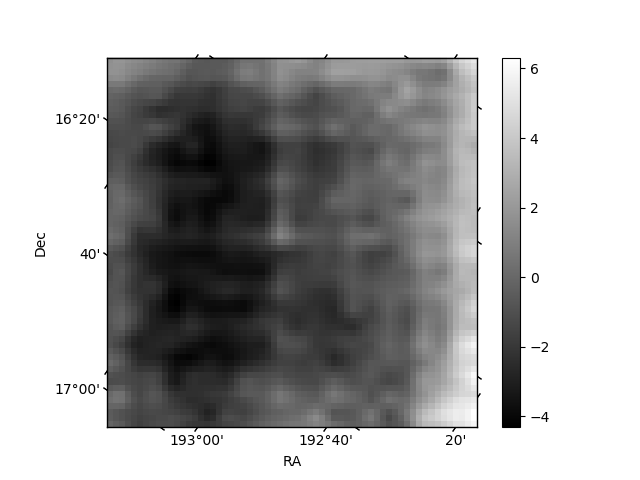
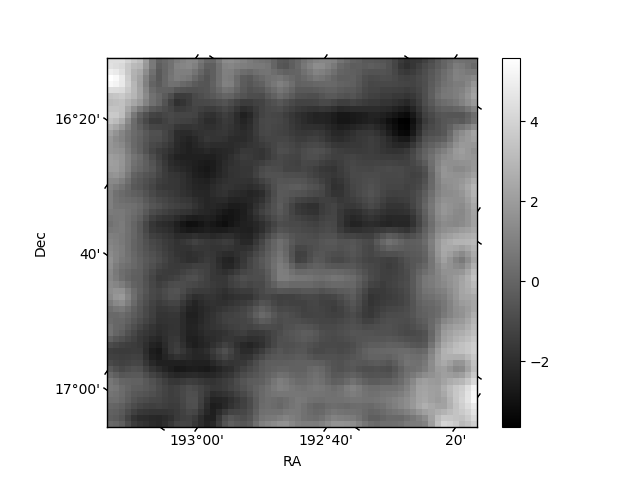
Histogram calculated using DETX and DETY for each event in the final _common_clean file
| Quadrant A | 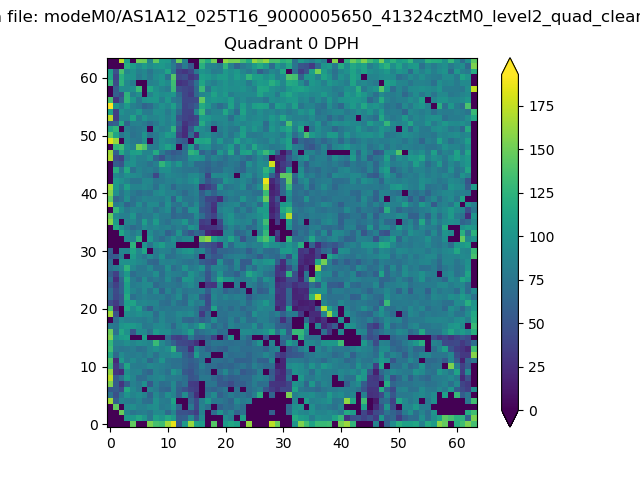 |
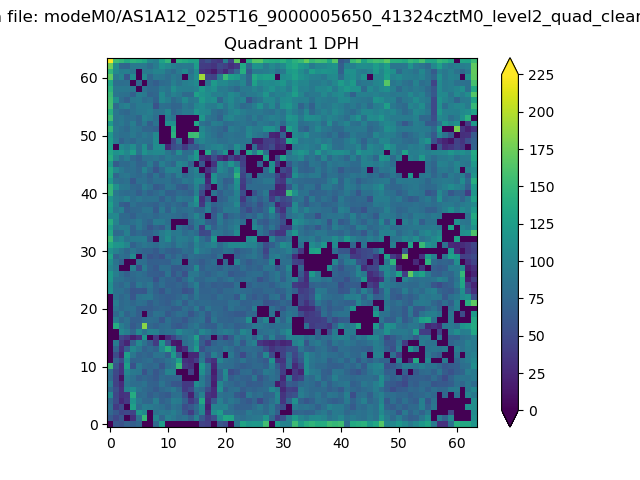 |
Quadrant B |
|---|---|---|---|
| Quadrant D | 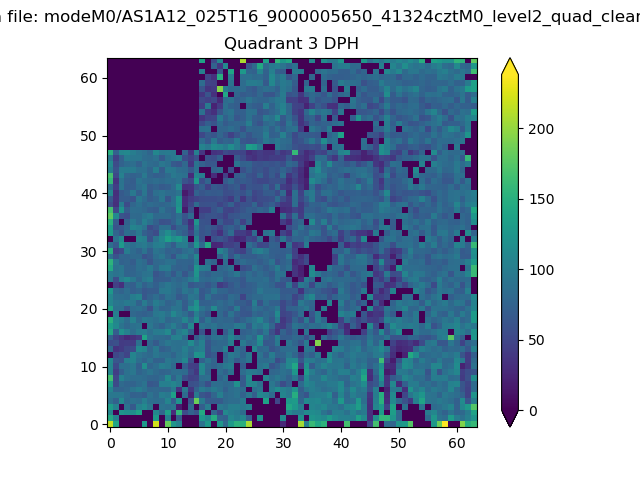 |
 |
Quadrant C |
| Plot type | Count rate plots | Images |
|---|---|---|
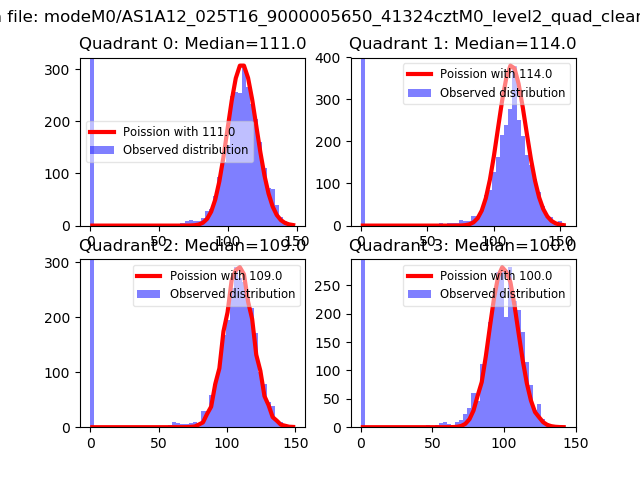
| Comparison with Poisson distribution Blue bars denote a histogram of data divided into 1 sec bins. Red curve is a Poisson curve with rate = median count rate of data. |
 |
 |
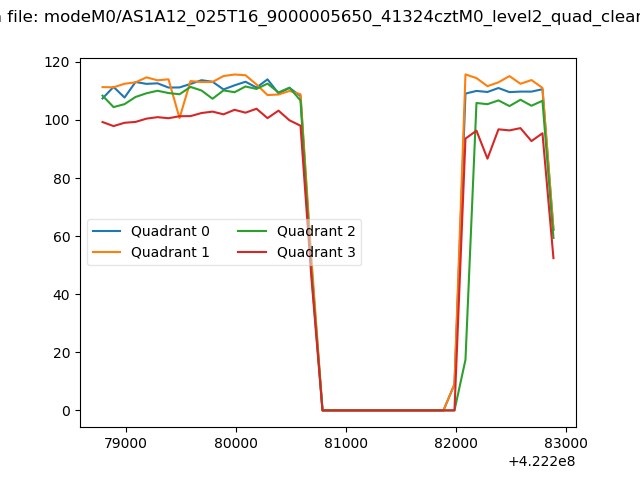
| Quadrant-wise count rates Data is divided into 100 sec bins |
 |
|
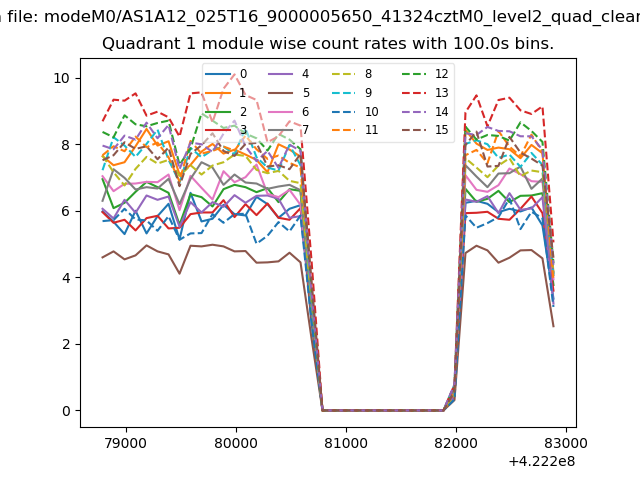
| Module-wise count rates for Quadrant A Data is divided into 100 sec bins |
 |
 |
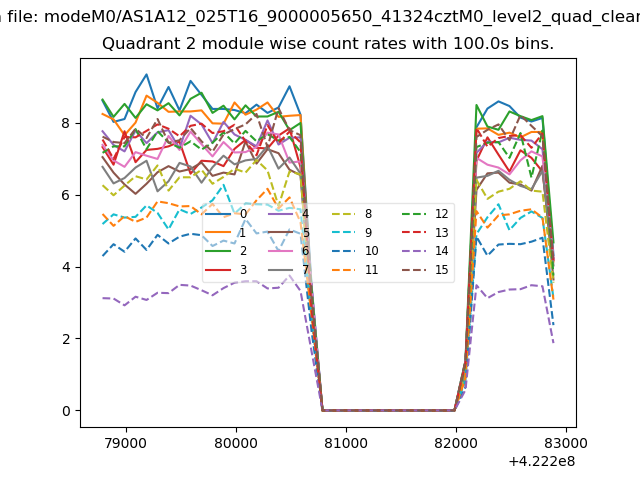
| Module-wise count rates for Quadrant B Data is divided into 100 sec bins |
 |
 |
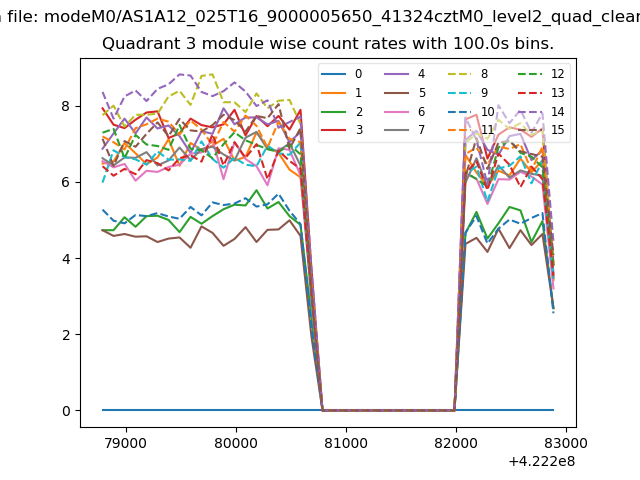
| Module-wise count rates for Quadrant C Data is divided into 100 sec bins |
 |
 |
| Module-wise count rates for Quadrant D Data is divided into 100 sec bins |
 |
 |
| Parameter | Plot |
|---|---|
| CZT HV Monitor |  |
| D_VDD | 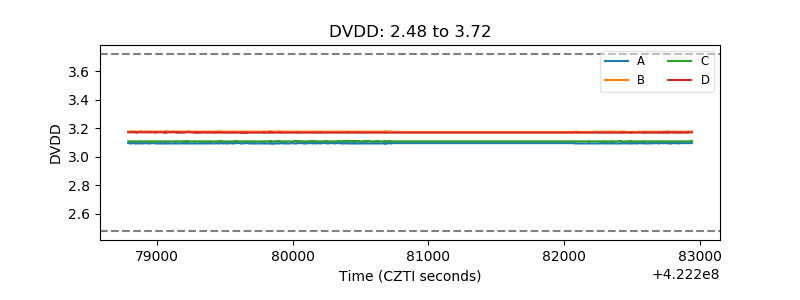 |
| Temperature 1 | 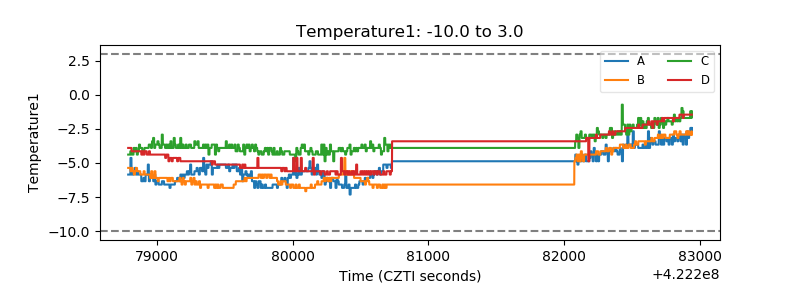 |
| Veto HV Monitor | 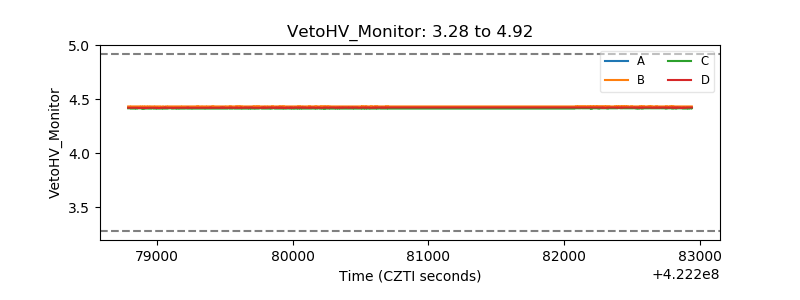 |
| Veto LLD | 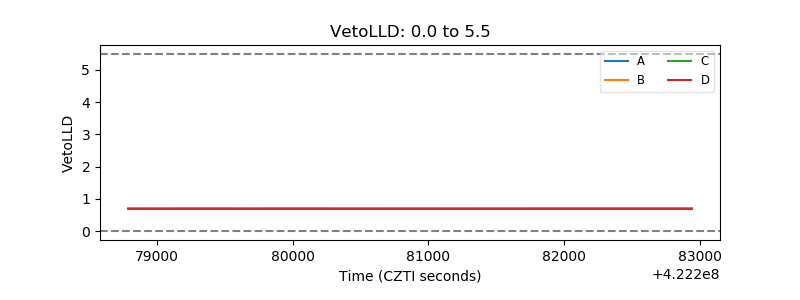 |
| Alpha Counter | 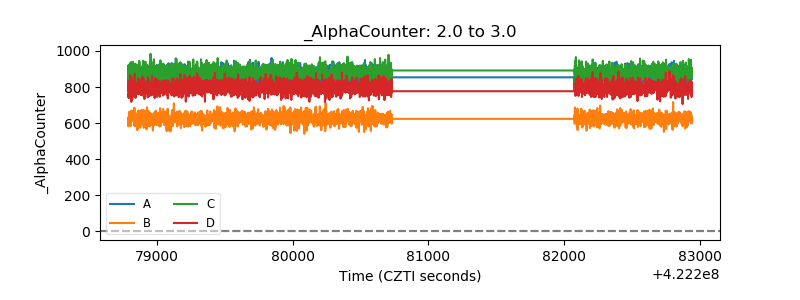 |
| _CPM_Rate | 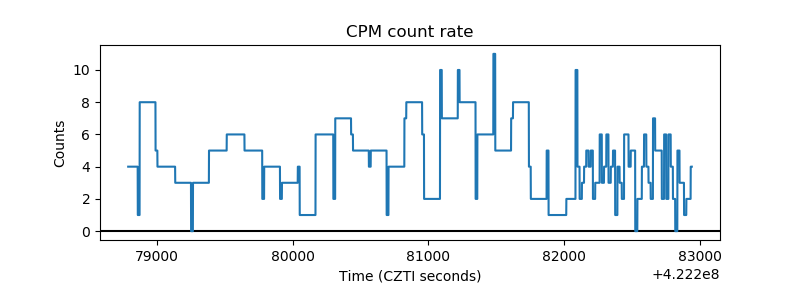 |
| CZT Counter | 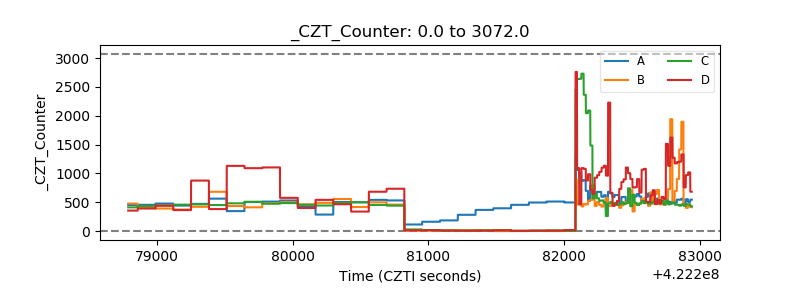 |
| +2.5 Volts monitor | 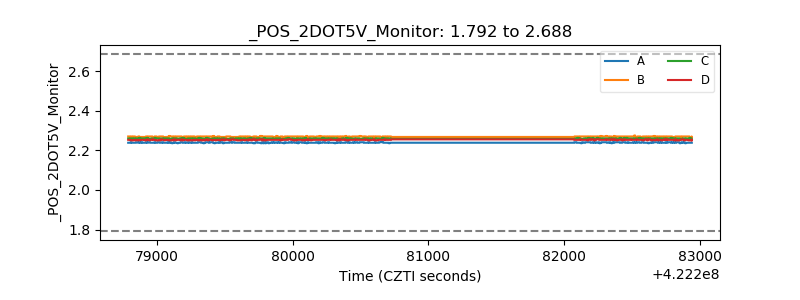 |
| +5 Volts monitor | 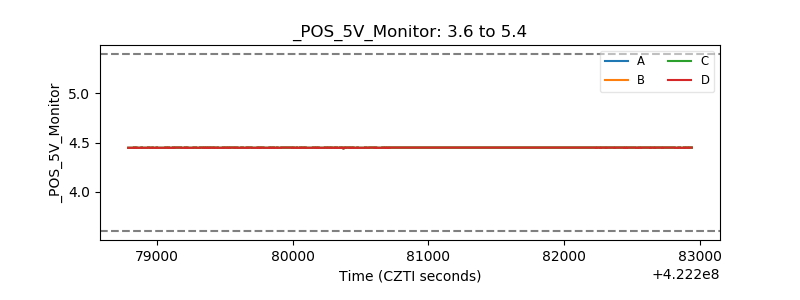 |
| _ROLL_ROT | 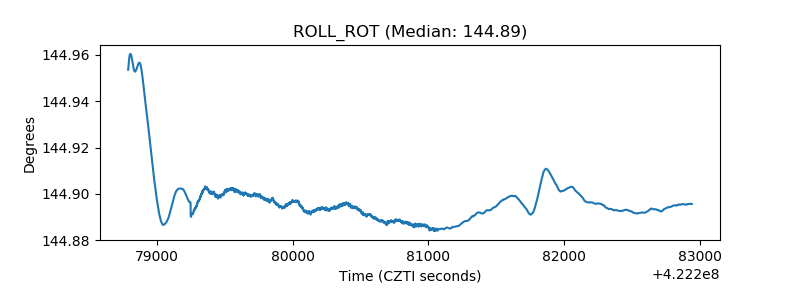 |
| _Roll_DEC | 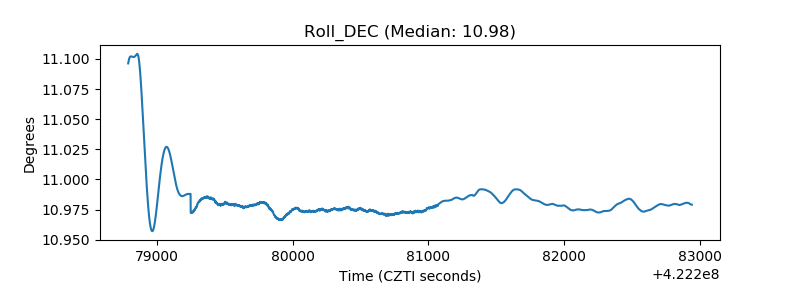 |
| _Roll_RA | 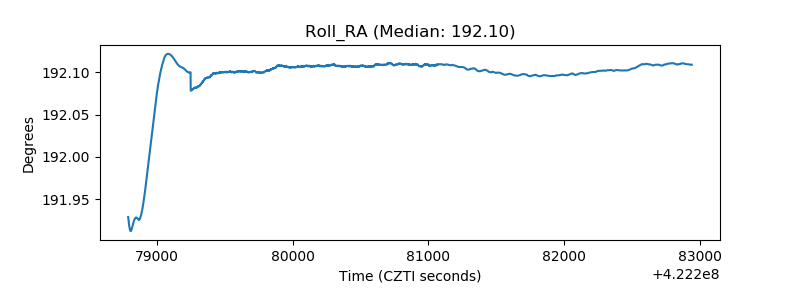 |
| Veto Counter | 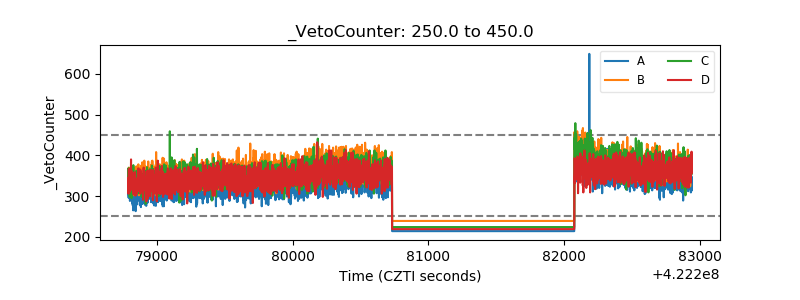 |