| Param | Original file | Final file |
|---|---|---|
| Filename | modeM0/AS1A12_037T01_9000005652_41323cztM0_level2.fits | modeM0/AS1A12_037T01_9000005652_41323cztM0_level2_quad_clean.evt |
| Size (bytes) | 175,158,720 | 51,001,920 |
| Size | 167.0 MB | 48.6 MB |
| Events in quadrant A | 1,509,153 | 341,215 |
| Events in quadrant B | 1,494,983 | 344,266 |
| Events in quadrant C | 1,406,759 | 331,440 |
| Events in quadrant D | 1,825,766 | 303,367 |
| Mode SS | |||
|---|---|---|---|
| Quadrant | BADHDUFLAG | Total packets | Discarded packets |
| A | 0 | 64 | 0 |
| B | 0 | 64 | 0 |
| C | 0 | 64 | 0 |
| D | 0 | 64 | 0 |
| Mode M0 | |||
|---|---|---|---|
| Quadrant | BADHDUFLAG | Total packets | Discarded packets |
| A | 0 | 6471 | 1 |
| B | 0 | 6624 | 0 |
| C | 0 | 6336 | 0 |
| D | 0 | 7752 | 0 |
| Quadrant | Total seconds | Saturated seconds | Saturation percentage |
|---|---|---|---|
| A | 3147 | 6 | 0.190658% |
| B | 3147 | 16 | 0.508421% |
| C | 3147 | 1 | 0.031776% |
| D | 3147 | 81 | 2.573880% |
Noise dominated data is calculated using 1-second bins in cleaned event files. If a bin has >2000 counts, and if more than 50% of those come from <1% of pixels, then it is considered to be noise-dominated and hence unusable.
| Quadrant | # 1 sec bins | Bins with >0 counts | Bins with >2000 counts | High rate bins dominated by noise | Noise dominated (total time) | Noise dominated (detector-on time) | Marked lightcurve |
|---|---|---|---|---|---|---|---|
| A | 3147 | 3147 | 1 | 1 | 0.03% | 0.03% | 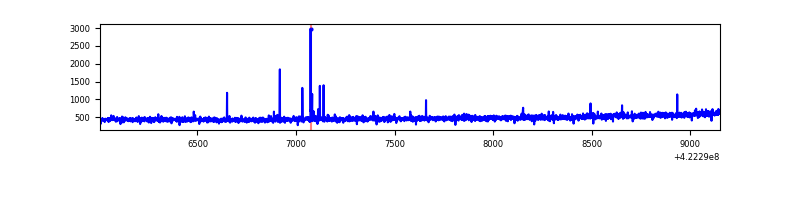 |
| B | 3147 | 3147 | 6 | 6 | 0.19% | 0.19% | 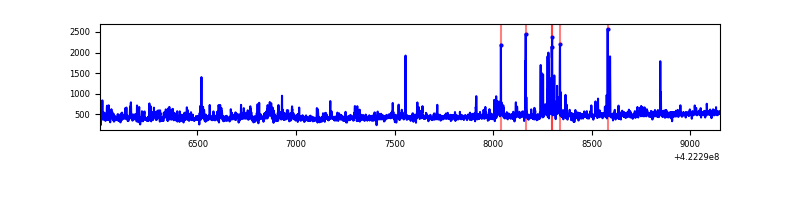 |
| C | 3147 | 3147 | 0 | 0 | 0.00% | 0.00% |  |
| D | 3147 | 3147 | 81 | 81 | 2.57% | 2.57% | 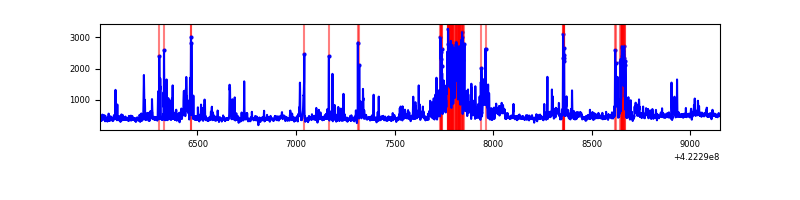 |
Top three noisy pixels from each quadrant. If the there are fewer than three noisy pixels in the level2.evt file, extra rows are filled as -1
| Pixel properties | Quadrant properties | ||||||
|---|---|---|---|---|---|---|---|
| Quadrant | DetID | PixID | Counts | Sigma | Mean | Median | Sigma |
| A | 10 | 83 | 180830 | 2525.62 | 336 | 328 | 71.5 |
| A | 2 | 79 | 19004 | 261.32 | 336 | 328 | 71.5 |
| A | 12 | 189 | 12545 | 170.94 | 336 | 328 | 71.5 |
| B | 0 | 190 | 103044 | 1549.85 | 334 | 325 | 66.3 |
| B | 5 | 255 | 49985 | 749.28 | 334 | 325 | 66.3 |
| B | 0 | 155 | 11655 | 170.95 | 334 | 325 | 66.3 |
| C | 15 | 214 | 127942 | 1636.67 | 326 | 329 | 78.0 |
| C | 0 | 10 | 4151 | 49.02 | 326 | 329 | 78.0 |
| C | 13 | 61 | 2132 | 23.12 | 326 | 329 | 78.0 |
| D | 2 | 249 | 254415 | 3182.4 | 320 | 311 | 79.8 |
| D | 1 | 52 | 172809 | 2160.36 | 320 | 311 | 79.8 |
| D | 6 | 112 | 44484 | 553.22 | 320 | 311 | 79.8 |
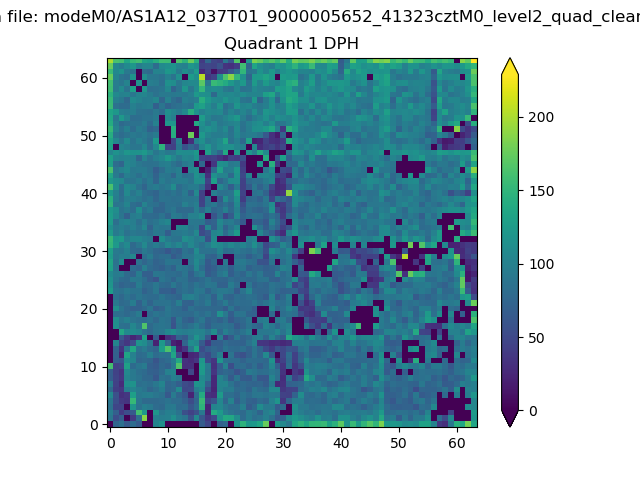
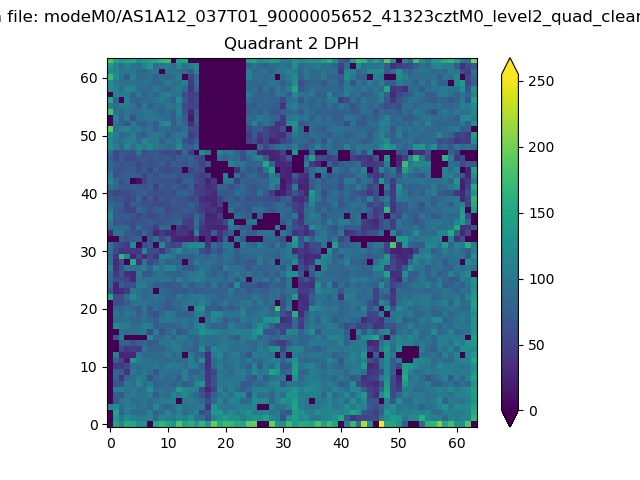
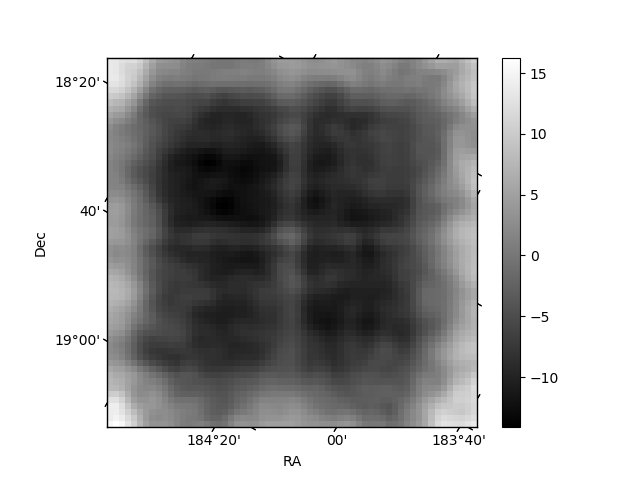
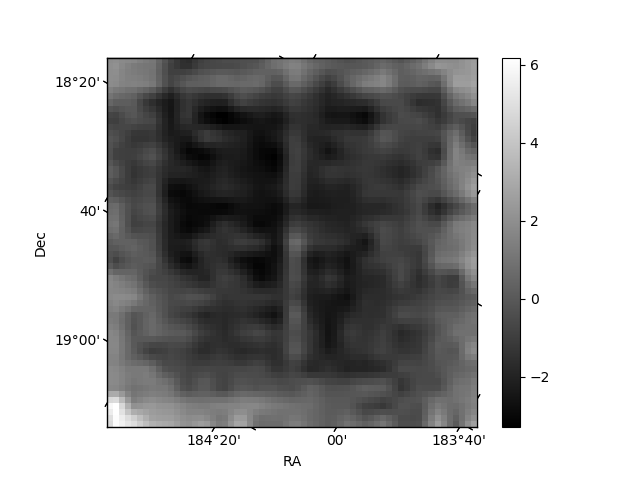
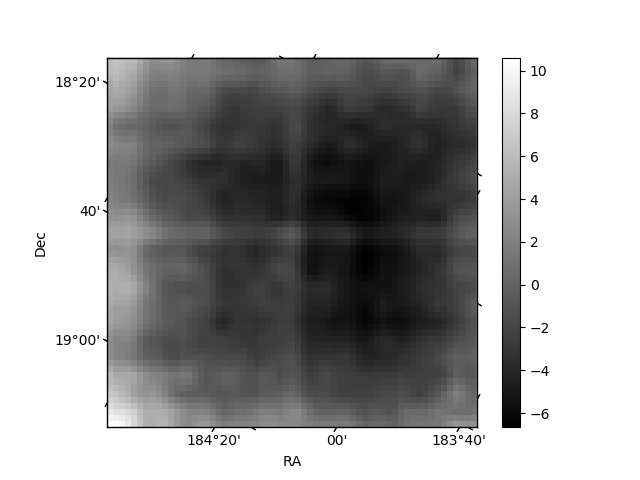
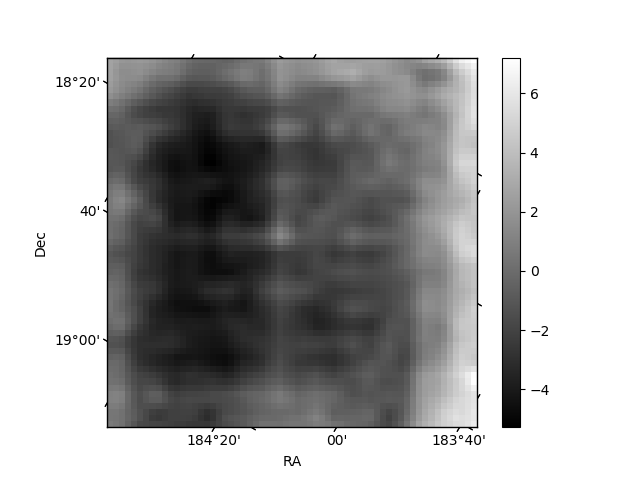
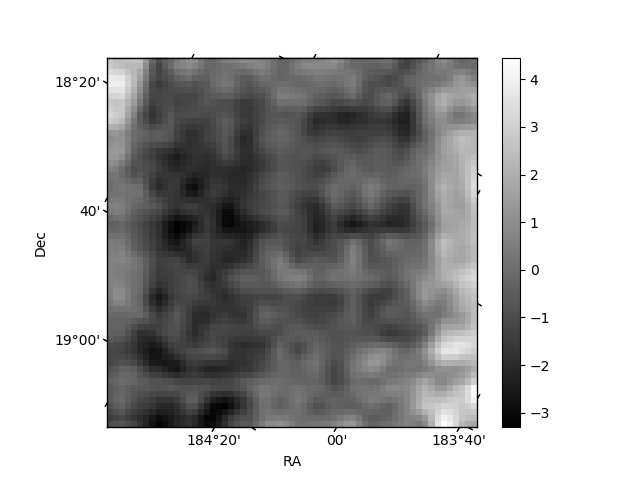
Histogram calculated using DETX and DETY for each event in the final _common_clean file
| Quadrant A | 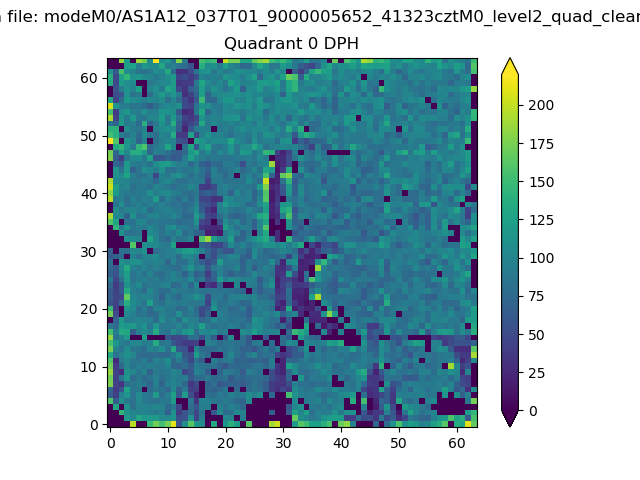 |
 |
Quadrant B |
|---|---|---|---|
| Quadrant D | 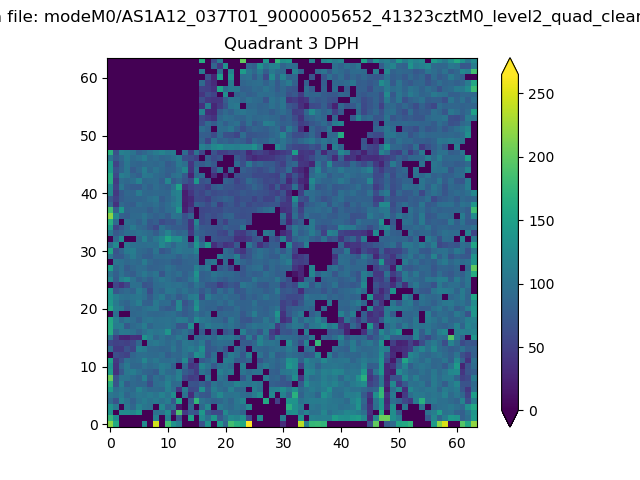 |
 |
Quadrant C |
| Plot type | Count rate plots | Images |
|---|---|---|
| Comparison with Poisson distribution Blue bars denote a histogram of data divided into 1 sec bins. Red curve is a Poisson curve with rate = median count rate of data. |
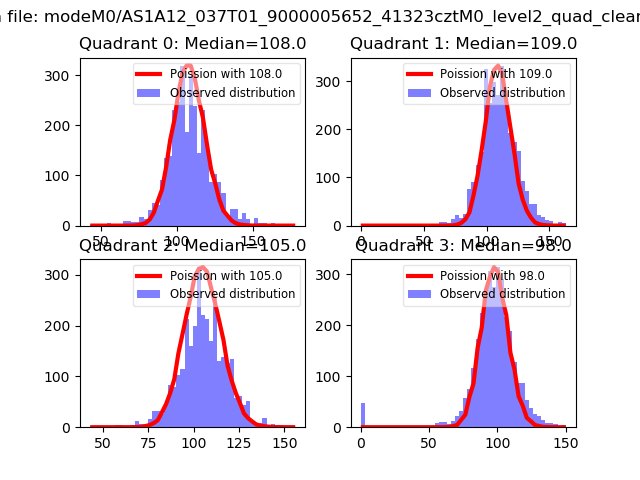 |
 |
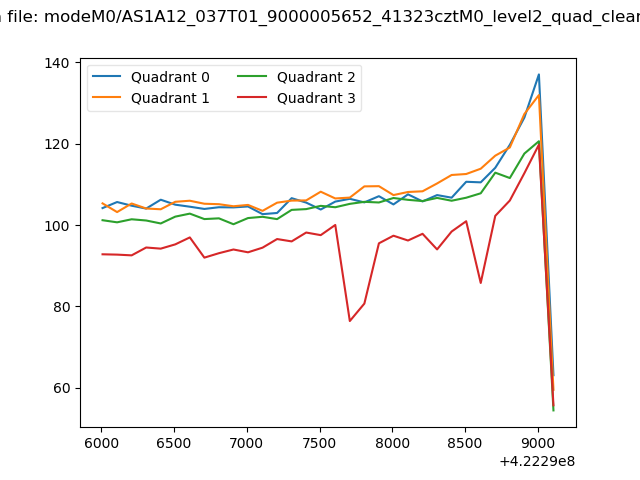
| Quadrant-wise count rates Data is divided into 100 sec bins |
 |
|
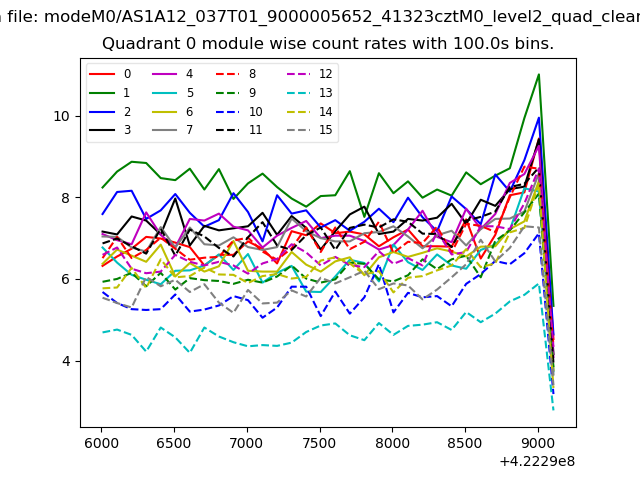
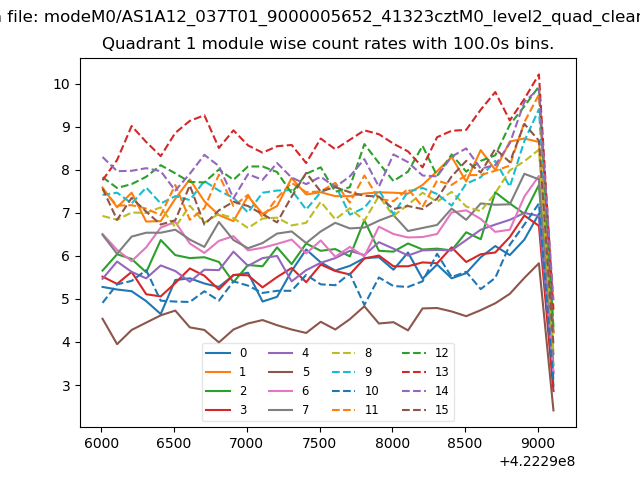
| Module-wise count rates for Quadrant A Data is divided into 100 sec bins |
 |
 |
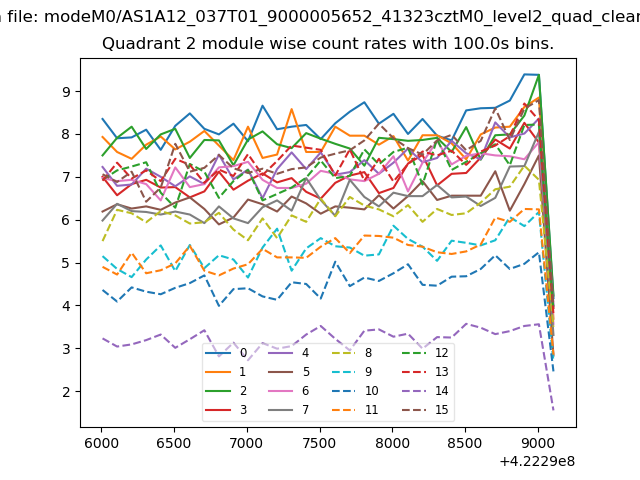
| Module-wise count rates for Quadrant B Data is divided into 100 sec bins |
 |
 |
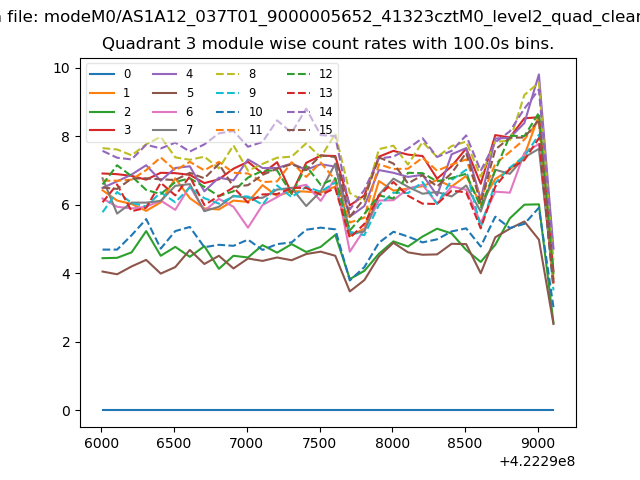
| Module-wise count rates for Quadrant C Data is divided into 100 sec bins |
 |
 |
| Module-wise count rates for Quadrant D Data is divided into 100 sec bins |
 |
 |
| Parameter | Plot |
|---|---|
| CZT HV Monitor | 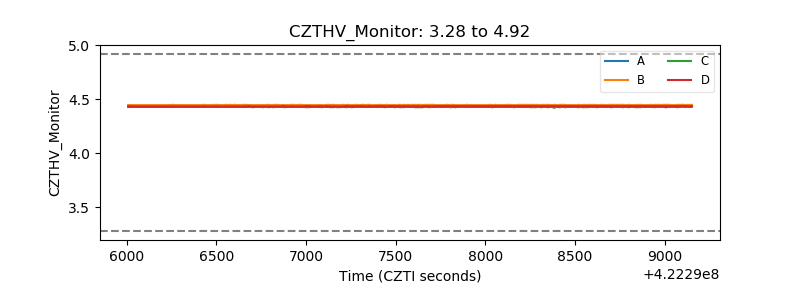 |
| D_VDD | 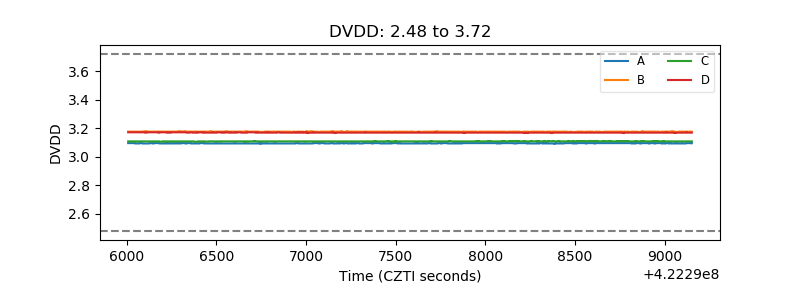 |
| Temperature 1 | 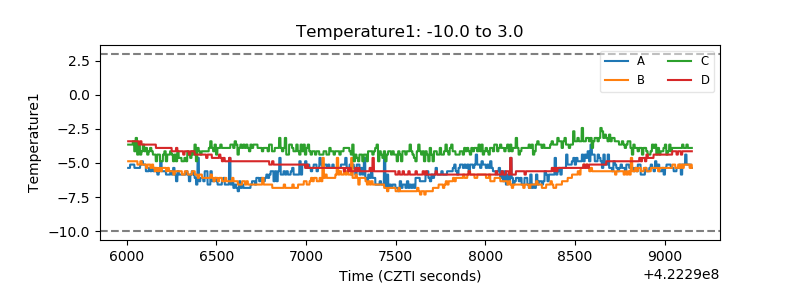 |
| Veto HV Monitor |  |
| Veto LLD | 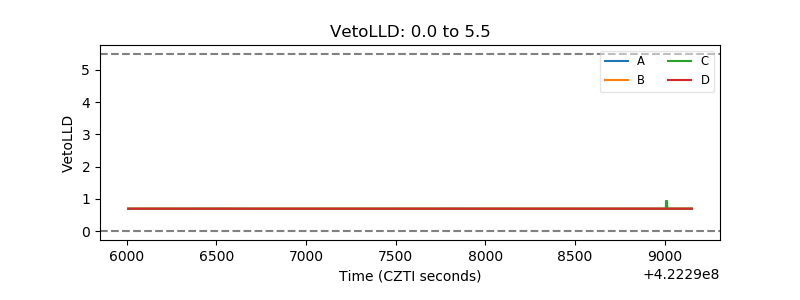 |
| Alpha Counter | 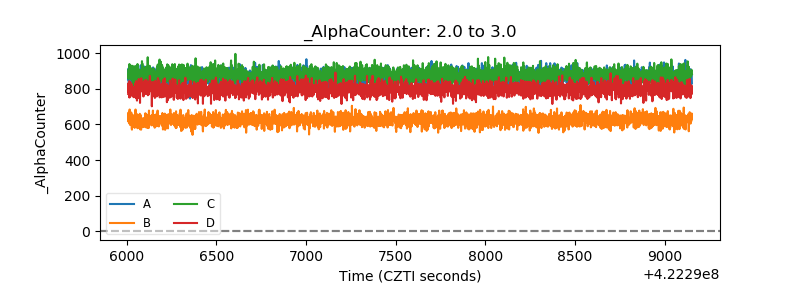 |
| _CPM_Rate | 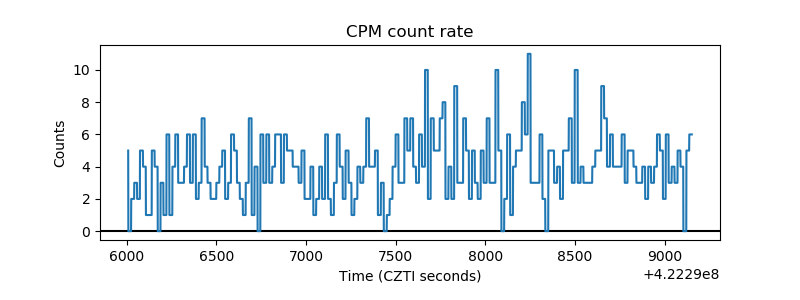 |
| CZT Counter | 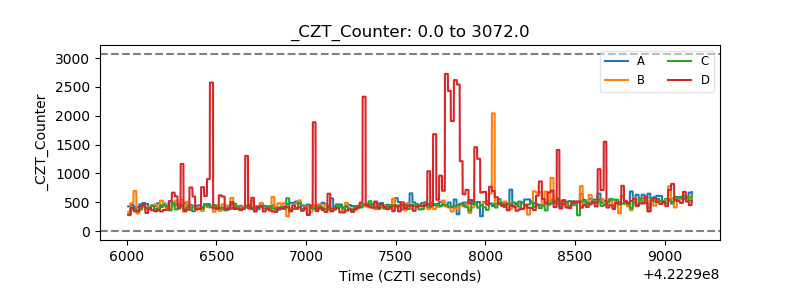 |
| +2.5 Volts monitor | 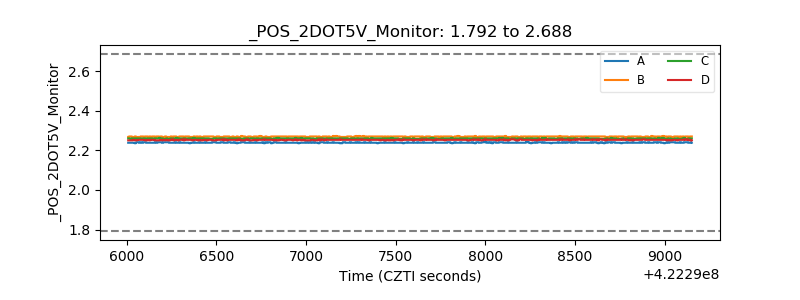 |
| +5 Volts monitor |  |
| _ROLL_ROT | 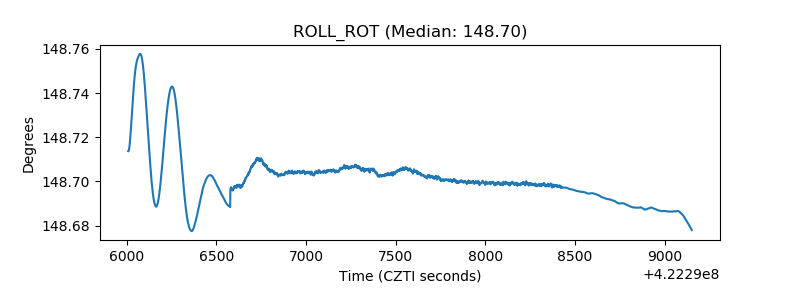 |
| _Roll_DEC | 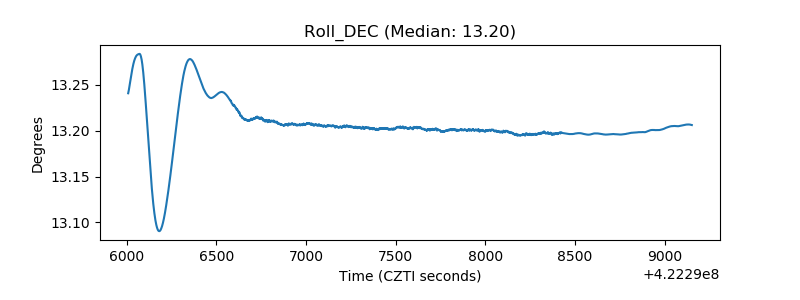 |
| _Roll_RA | 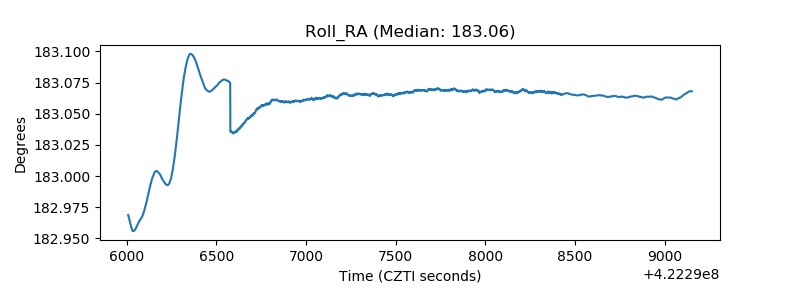 |
| Veto Counter | 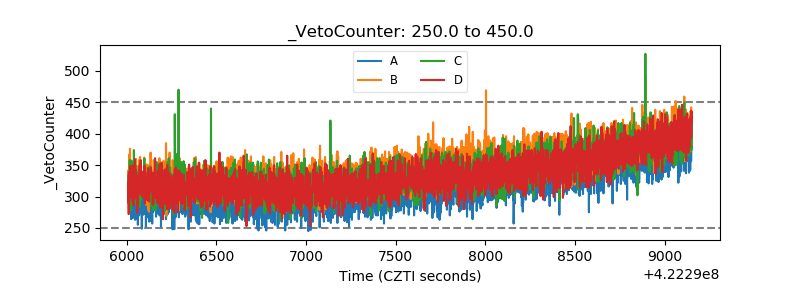 |