| Param | Original file | Final file |
|---|---|---|
| Filename | modeM0/AS1A12_037T01_9000005652_41324cztM0_level2.fits | modeM0/AS1A12_037T01_9000005652_41324cztM0_level2_quad_clean.evt |
| Size (bytes) | 454,872,960 | 119,790,720 |
| Size | 433.8 MB | 114.2 MB |
| Events in quadrant A | 3,926,718 | 810,074 |
| Events in quadrant B | 3,828,682 | 817,854 |
| Events in quadrant C | 3,984,922 | 764,013 |
| Events in quadrant D | 4,522,795 | 720,333 |
| Mode SS | |||
|---|---|---|---|
| Quadrant | BADHDUFLAG | Total packets | Discarded packets |
| A | 0 | 152 | 0 |
| B | 0 | 152 | 0 |
| C | 0 | 152 | 0 |
| D | 0 | 152 | 0 |
| Mode M9 | |||
|---|---|---|---|
| Quadrant | BADHDUFLAG | Total packets | Discarded packets |
| A | 0 | 30 | 0 |
| B | 0 | 30 | 0 |
| C | 0 | 30 | 0 |
| D | 0 | 30 | 0 |
| Mode M0 | |||
|---|---|---|---|
| Quadrant | BADHDUFLAG | Total packets | Discarded packets |
| A | 0 | 16330 | 3 |
| B | 0 | 16381 | 2 |
| C | 0 | 16543 | 2 |
| D | 0 | 18589 | 2 |
| Quadrant | Total seconds | Saturated seconds | Saturation percentage |
|---|---|---|---|
| A | 7397 | 20 | 0.270380% |
| B | 7397 | 97 | 1.311342% |
| C | 7397 | 217 | 2.933622% |
| D | 7397 | 189 | 2.555090% |
Noise dominated data is calculated using 1-second bins in cleaned event files. If a bin has >2000 counts, and if more than 50% of those come from <1% of pixels, then it is considered to be noise-dominated and hence unusable.
| Quadrant | # 1 sec bins | Bins with >0 counts | Bins with >2000 counts | High rate bins dominated by noise | Noise dominated (total time) | Noise dominated (detector-on time) | Marked lightcurve |
|---|---|---|---|---|---|---|---|
| A | 10381 | 7399 | 6 | 6 | 0.06% | 0.08% | 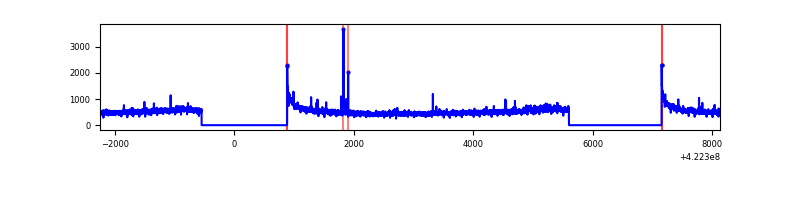 |
| B | 10381 | 7399 | 61 | 61 | 0.59% | 0.82% | 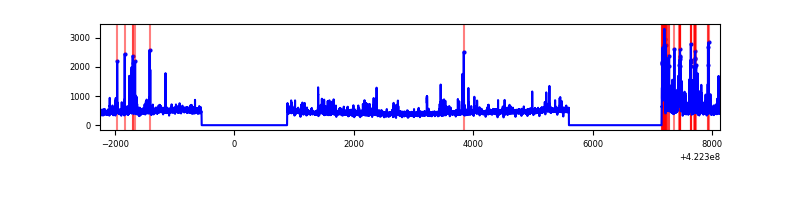 |
| C | 10381 | 7399 | 208 | 208 | 2.00% | 2.81% | 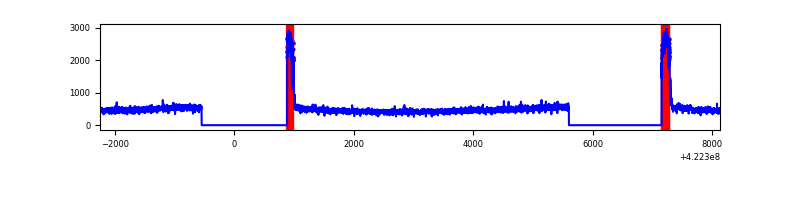 |
| D | 10381 | 7399 | 186 | 186 | 1.79% | 2.51% | 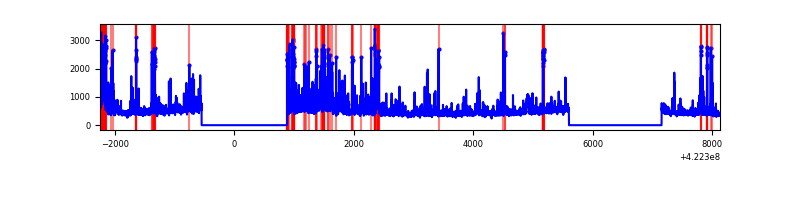 |
Top three noisy pixels from each quadrant. If the there are fewer than three noisy pixels in the level2.evt file, extra rows are filled as -1
| Pixel properties | Quadrant properties | ||||||
|---|---|---|---|---|---|---|---|
| Quadrant | DetID | PixID | Counts | Sigma | Mean | Median | Sigma |
| A | 10 | 83 | 636551 | 3778.48 | 819 | 802 | 168.3 |
| A | 12 | 189 | 82273 | 484.21 | 819 | 802 | 168.3 |
| A | 2 | 79 | 42077 | 245.31 | 819 | 802 | 168.3 |
| B | 5 | 255 | 416483 | 2628.71 | 810 | 788 | 158.1 |
| B | 0 | 190 | 174647 | 1099.42 | 810 | 788 | 158.1 |
| B | 0 | 155 | 25661 | 157.29 | 810 | 788 | 158.1 |
| C | 0 | 10 | 618848 | 3383.75 | 780 | 782 | 182.7 |
| C | 15 | 214 | 309490 | 1690.09 | 780 | 782 | 182.7 |
| C | 8 | 222 | 14087 | 72.84 | 780 | 782 | 182.7 |
| D | 1 | 52 | 791932 | 4105.86 | 787 | 764 | 192.7 |
| D | 2 | 249 | 178046 | 920.03 | 787 | 764 | 192.7 |
| D | 2 | 120 | 138087 | 712.65 | 787 | 764 | 192.7 |
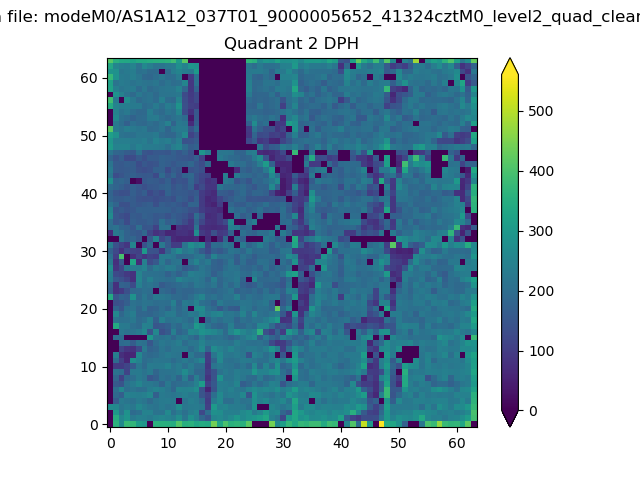
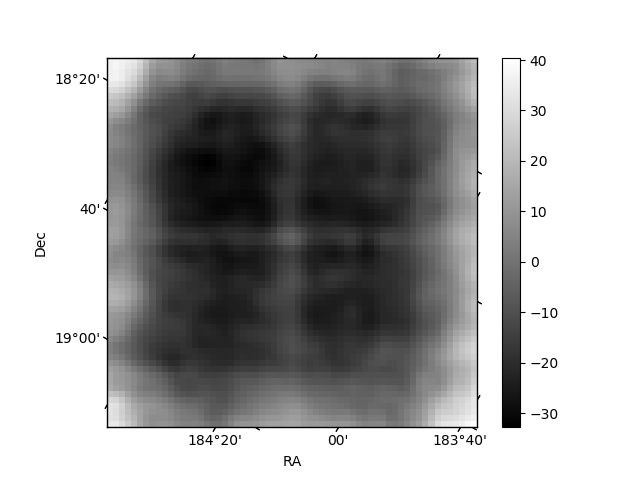
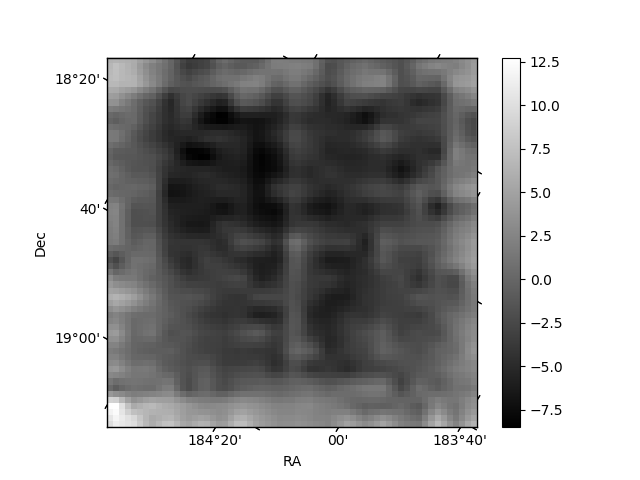
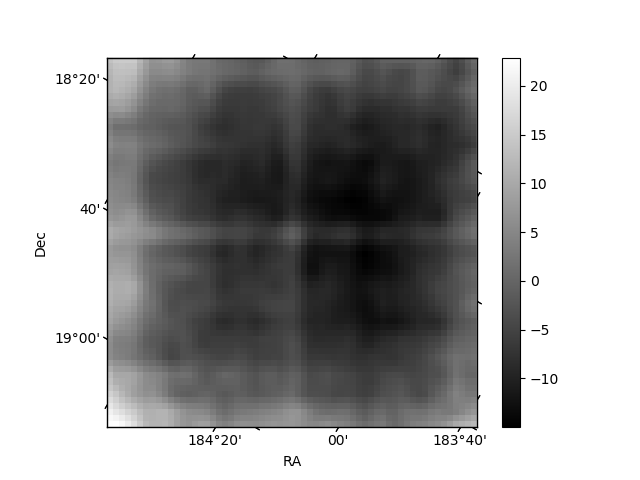
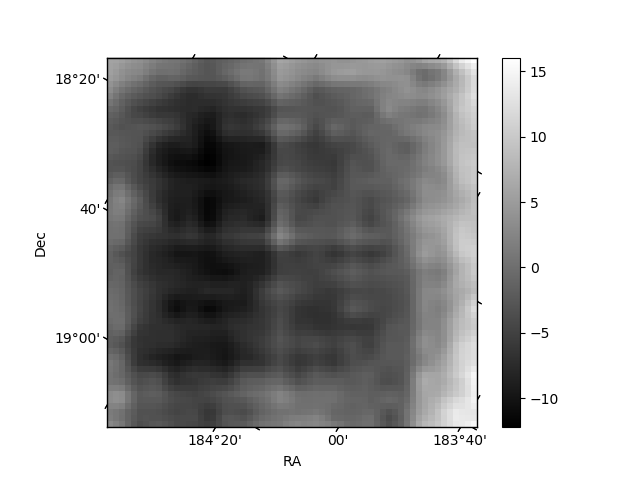
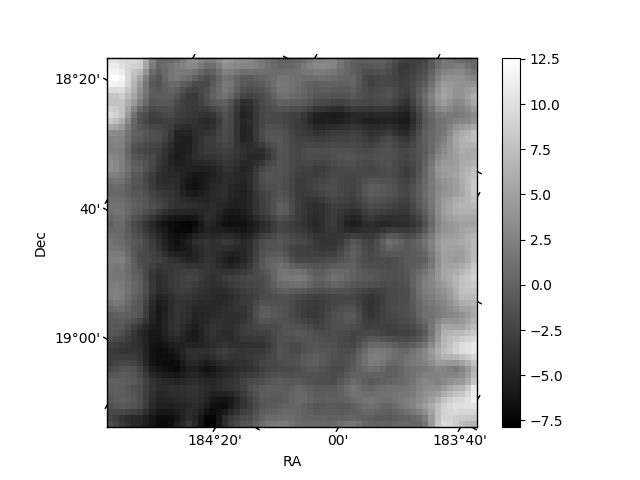
Histogram calculated using DETX and DETY for each event in the final _common_clean file
| Quadrant A | 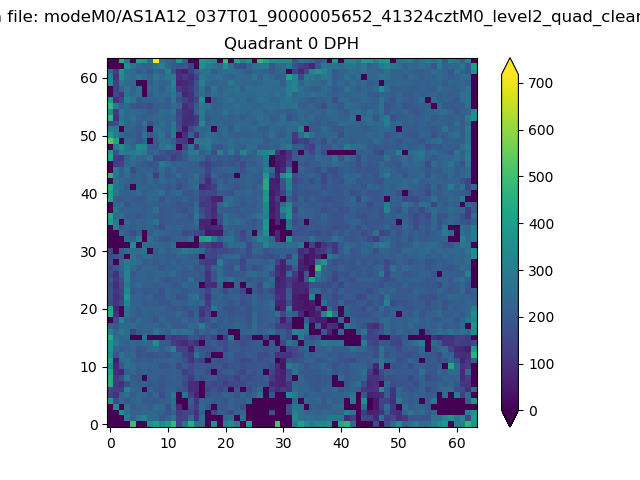 |
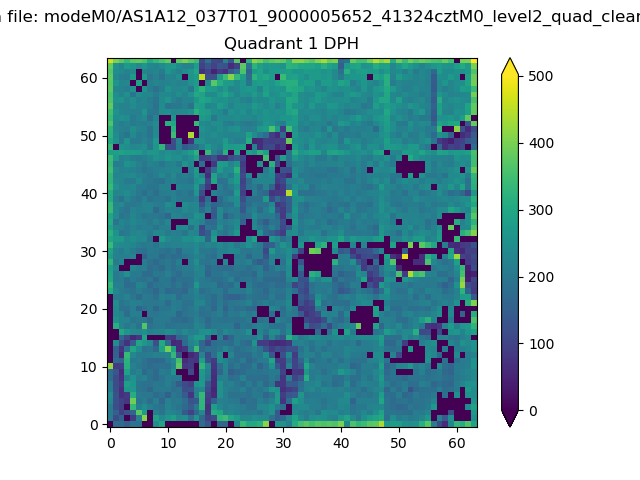 |
Quadrant B |
|---|---|---|---|
| Quadrant D | 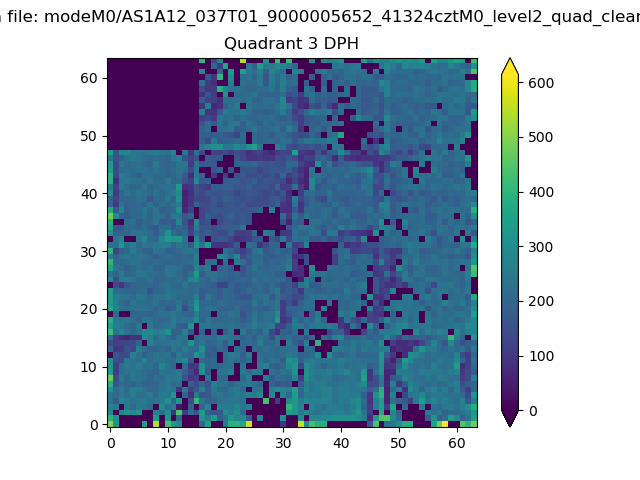 |
 |
Quadrant C |
| Plot type | Count rate plots | Images |
|---|---|---|
| Comparison with Poisson distribution Blue bars denote a histogram of data divided into 1 sec bins. Red curve is a Poisson curve with rate = median count rate of data. |
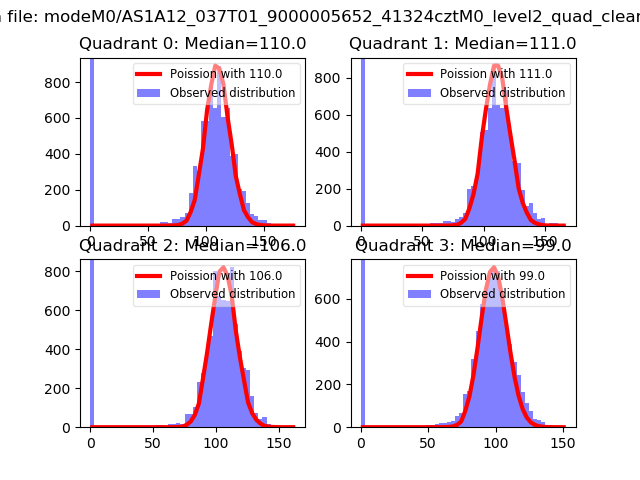 |
 |
| Quadrant-wise count rates Data is divided into 100 sec bins |
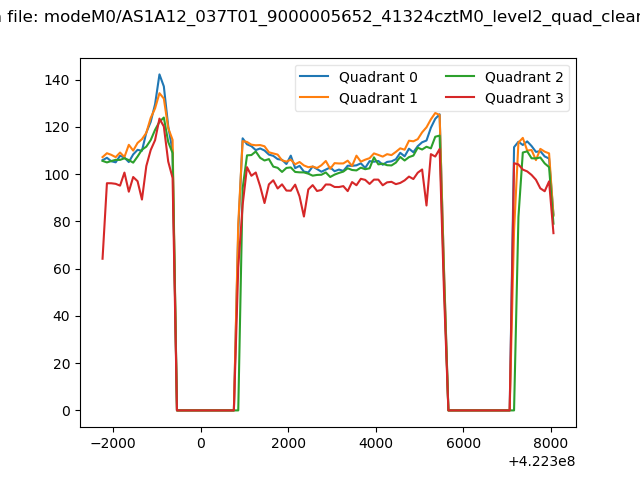 |
|
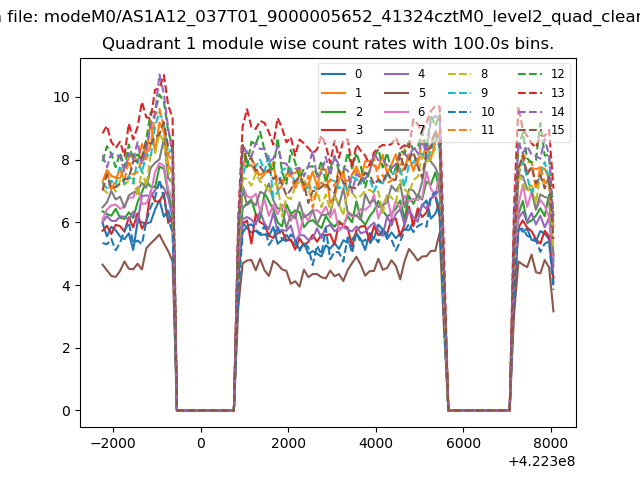
| Module-wise count rates for Quadrant A Data is divided into 100 sec bins |
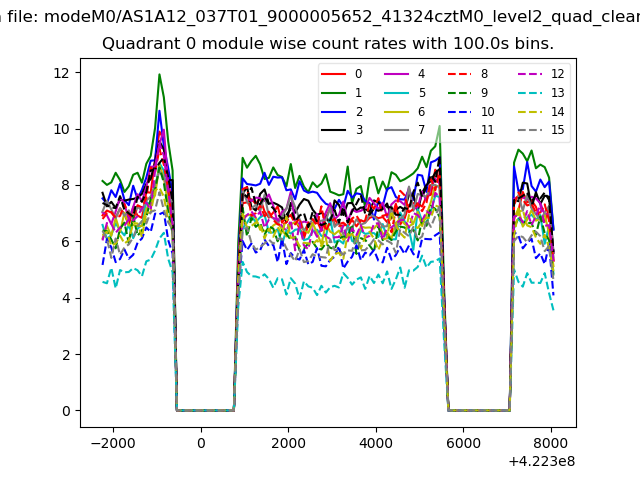 |
 |
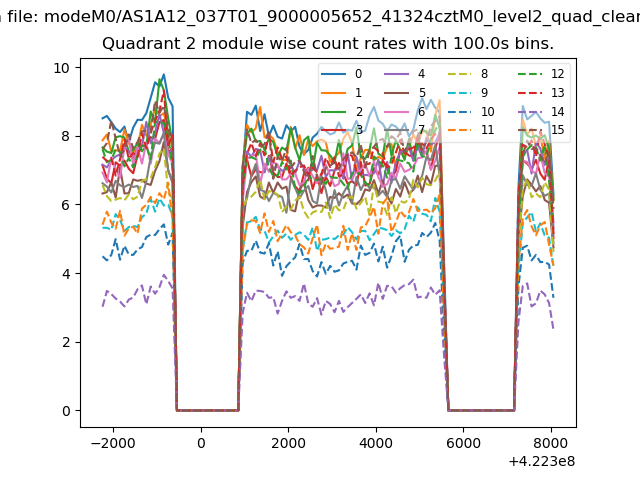
| Module-wise count rates for Quadrant B Data is divided into 100 sec bins |
 |
 |
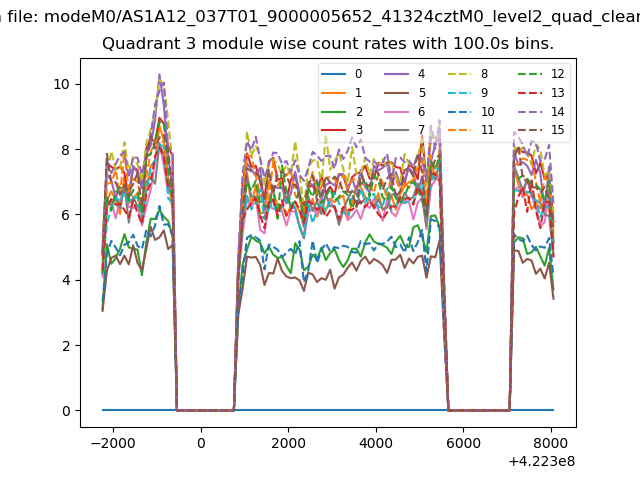
| Module-wise count rates for Quadrant C Data is divided into 100 sec bins |
 |
 |
| Module-wise count rates for Quadrant D Data is divided into 100 sec bins |
 |
 |
| Parameter | Plot |
|---|---|
| CZT HV Monitor | 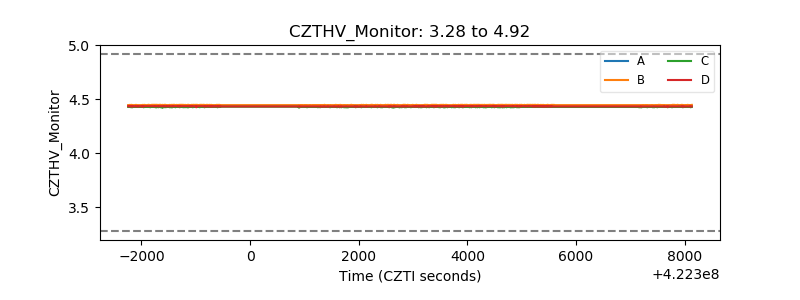 |
| D_VDD | 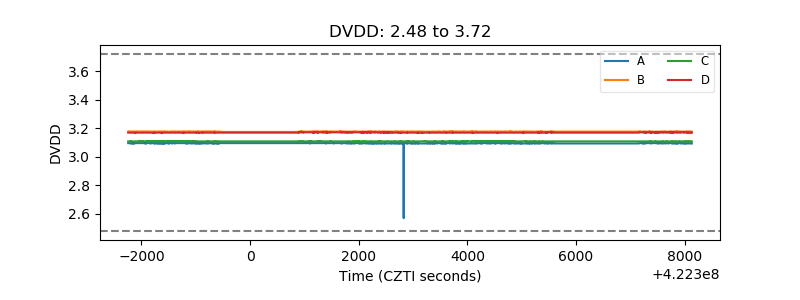 |
| Temperature 1 | 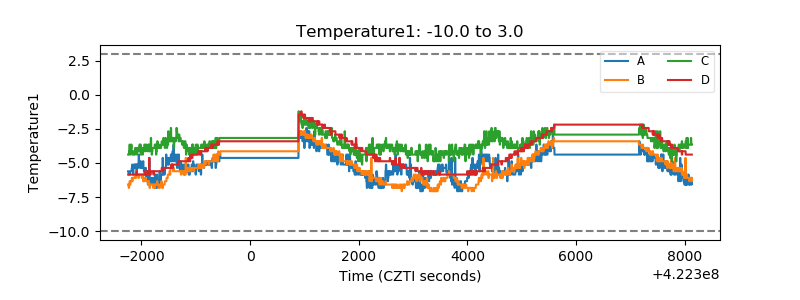 |
| Veto HV Monitor | 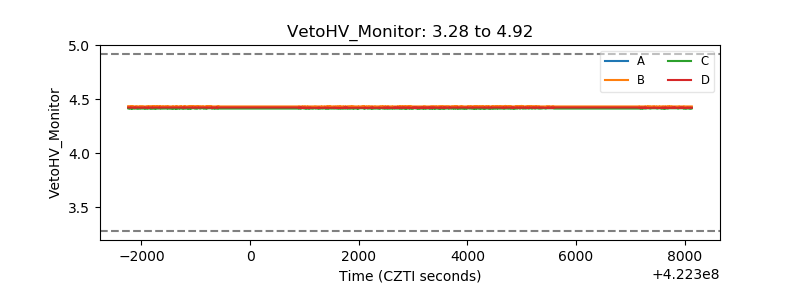 |
| Veto LLD | 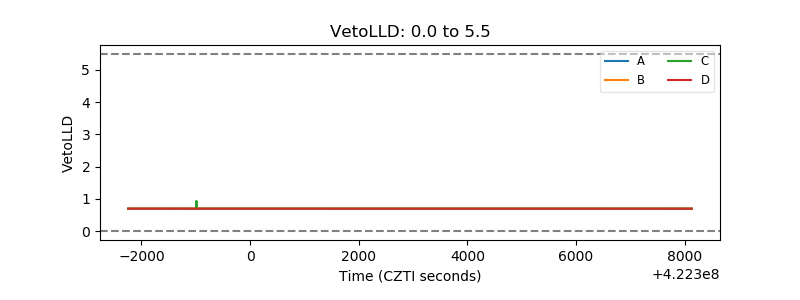 |
| Alpha Counter | 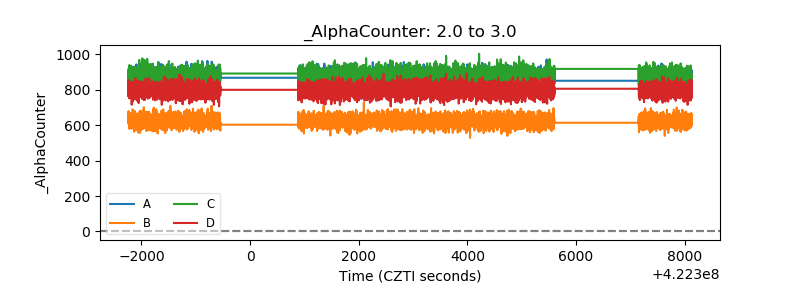 |
| _CPM_Rate | 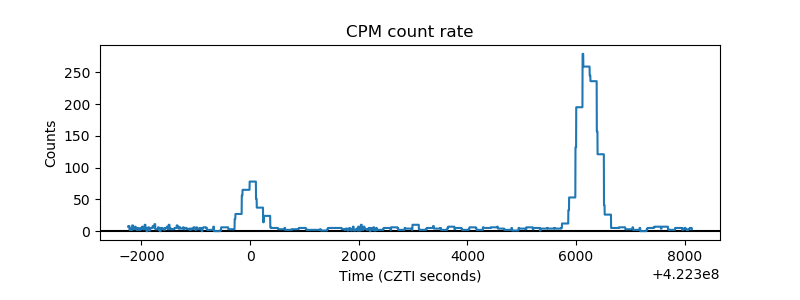 |
| CZT Counter | 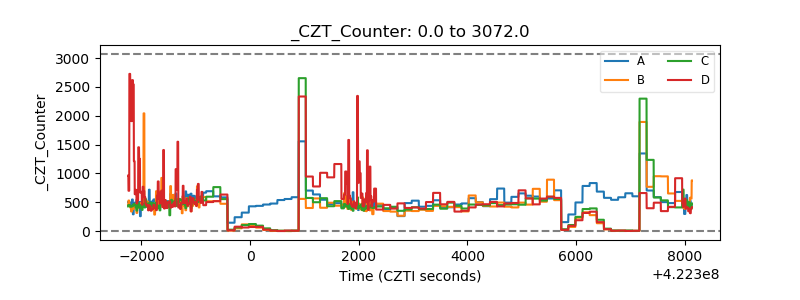 |
| +2.5 Volts monitor | 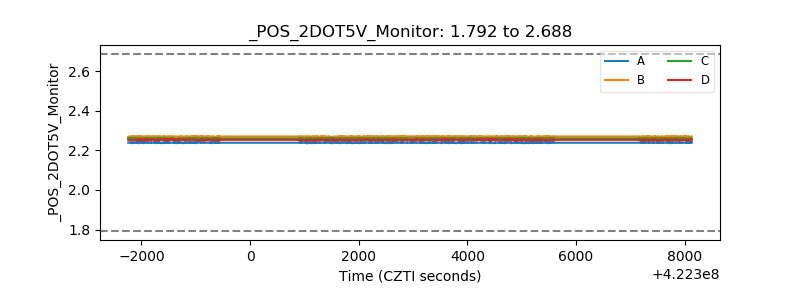 |
| +5 Volts monitor | 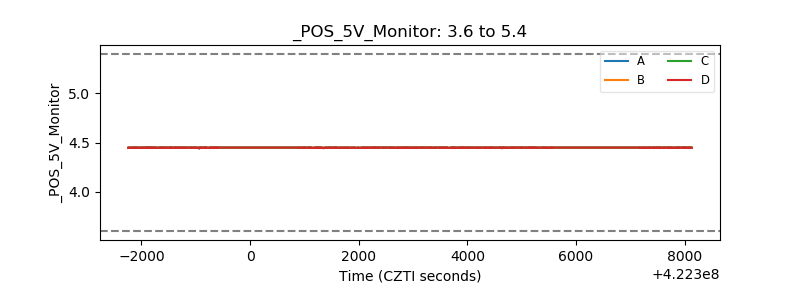 |
| _ROLL_ROT | 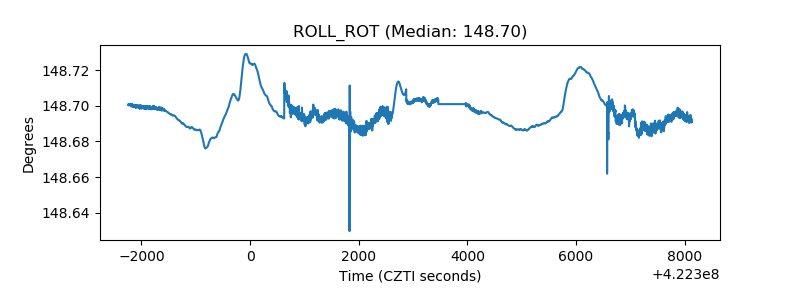 |
| _Roll_DEC | 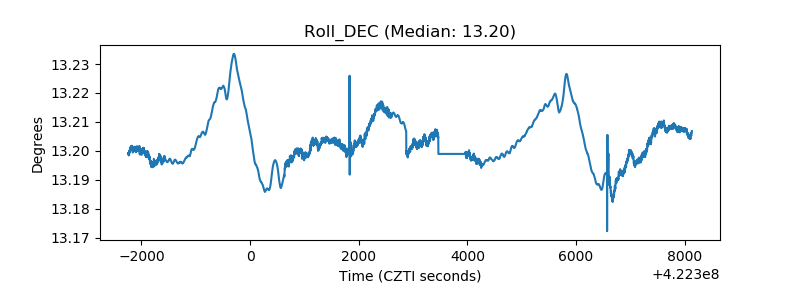 |
| _Roll_RA | 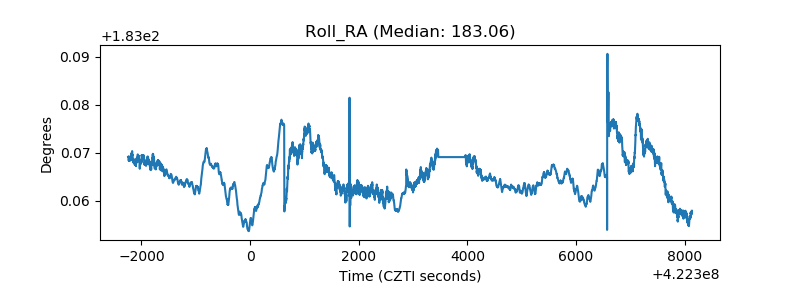 |
| Veto Counter | 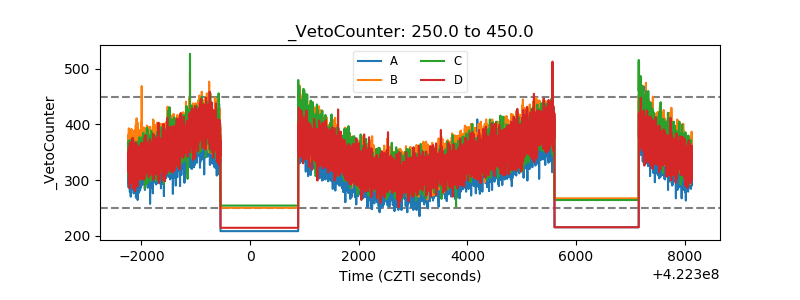 |