| Param | Original file | Final file |
|---|---|---|
| Filename | modeM0/AS1A12_037T01_9000005652_41325cztM0_level2.fits | modeM0/AS1A12_037T01_9000005652_41325cztM0_level2_quad_clean.evt |
| Size (bytes) | 342,702,720 | 85,556,160 |
| Size | 326.8 MB | 81.6 MB |
| Events in quadrant A | 2,898,766 | 582,563 |
| Events in quadrant B | 2,823,878 | 589,836 |
| Events in quadrant C | 3,122,789 | 539,792 |
| Events in quadrant D | 3,422,665 | 502,821 |
| Mode SS | |||
|---|---|---|---|
| Quadrant | BADHDUFLAG | Total packets | Discarded packets |
| A | 0 | 110 | 0 |
| B | 0 | 110 | 0 |
| C | 0 | 110 | 0 |
| D | 0 | 110 | 0 |
| Mode M9 | |||
|---|---|---|---|
| Quadrant | BADHDUFLAG | Total packets | Discarded packets |
| A | 0 | 29 | 0 |
| B | 0 | 29 | 0 |
| C | 0 | 29 | 0 |
| D | 0 | 30 | 0 |
| Mode M0 | |||
|---|---|---|---|
| Quadrant | BADHDUFLAG | Total packets | Discarded packets |
| A | 0 | 11899 | 3 |
| B | 0 | 12105 | 2 |
| C | 0 | 12599 | 2 |
| D | 0 | 14050 | 2 |
| Quadrant | Total seconds | Saturated seconds | Saturation percentage |
|---|---|---|---|
| A | 5361 | 13 | 0.242492% |
| B | 5361 | 92 | 1.716098% |
| C | 5361 | 246 | 4.588696% |
| D | 5361 | 276 | 5.148293% |
Noise dominated data is calculated using 1-second bins in cleaned event files. If a bin has >2000 counts, and if more than 50% of those come from <1% of pixels, then it is considered to be noise-dominated and hence unusable.
| Quadrant | # 1 sec bins | Bins with >0 counts | Bins with >2000 counts | High rate bins dominated by noise | Noise dominated (total time) | Noise dominated (detector-on time) | Marked lightcurve |
|---|---|---|---|---|---|---|---|
| A | 7033 | 5362 | 4 | 4 | 0.06% | 0.07% | 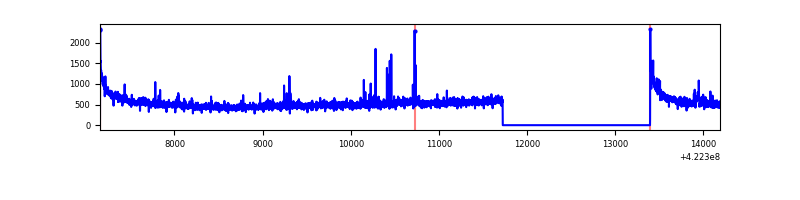 |
| B | 7033 | 5362 | 62 | 62 | 0.88% | 1.16% | 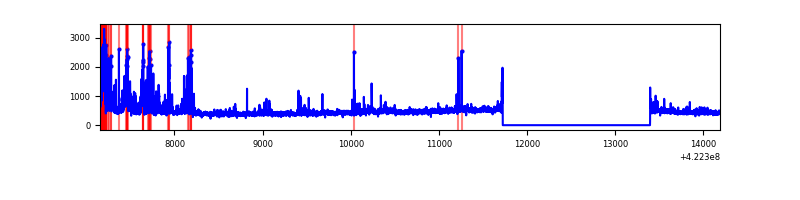 |
| C | 7033 | 5362 | 241 | 241 | 3.43% | 4.49% | 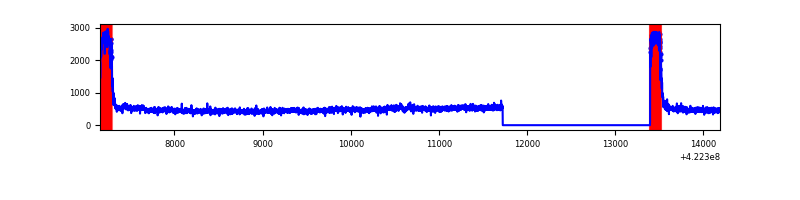 |
| D | 7033 | 5362 | 272 | 272 | 3.87% | 5.07% | 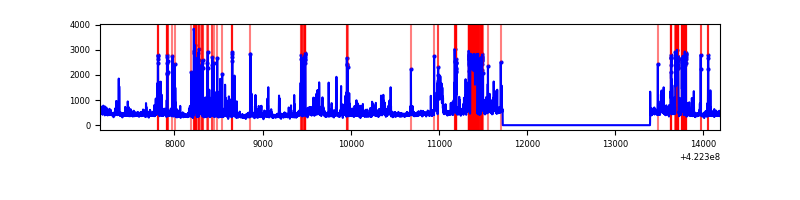 |
Top three noisy pixels from each quadrant. If the there are fewer than three noisy pixels in the level2.evt file, extra rows are filled as -1
| Pixel properties | Quadrant properties | ||||||
|---|---|---|---|---|---|---|---|
| Quadrant | DetID | PixID | Counts | Sigma | Mean | Median | Sigma |
| A | 10 | 83 | 511525 | 4237.36 | 579 | 566 | 120.6 |
| A | 2 | 79 | 73612 | 605.77 | 579 | 566 | 120.6 |
| A | 12 | 189 | 53646 | 440.19 | 579 | 566 | 120.6 |
| B | 5 | 255 | 405266 | 3610.51 | 575 | 559 | 112.1 |
| B | 0 | 190 | 81755 | 724.37 | 575 | 559 | 112.1 |
| B | 0 | 155 | 30938 | 271.02 | 575 | 559 | 112.1 |
| C | 0 | 10 | 718890 | 5558.27 | 548 | 551 | 129.2 |
| C | 15 | 214 | 224401 | 1732.08 | 548 | 551 | 129.2 |
| C | 8 | 222 | 38285 | 291.97 | 548 | 551 | 129.2 |
| D | 1 | 52 | 668768 | 4933.15 | 547 | 531 | 135.5 |
| D | 13 | 249 | 274217 | 2020.44 | 547 | 531 | 135.5 |
| D | 1 | 47 | 245439 | 1807.99 | 547 | 531 | 135.5 |
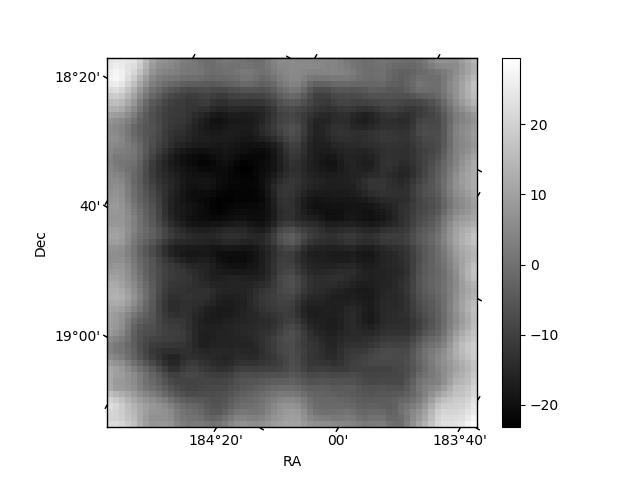
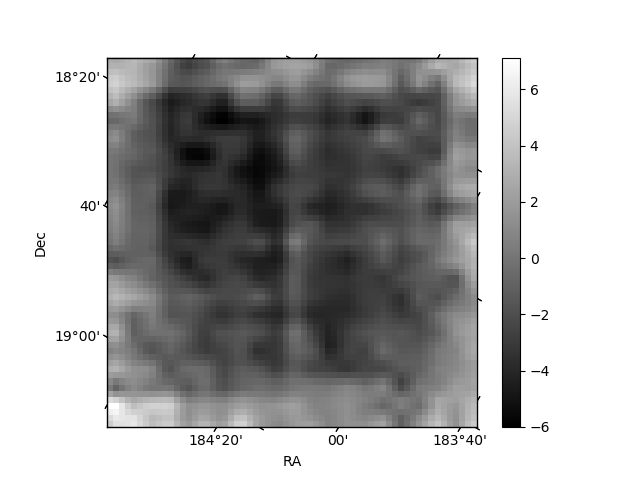
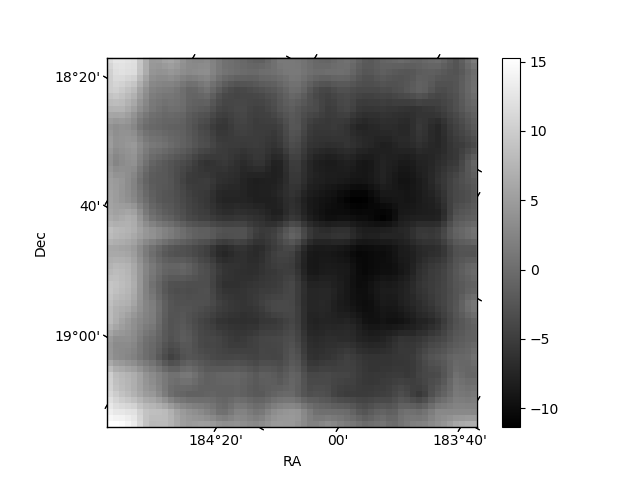
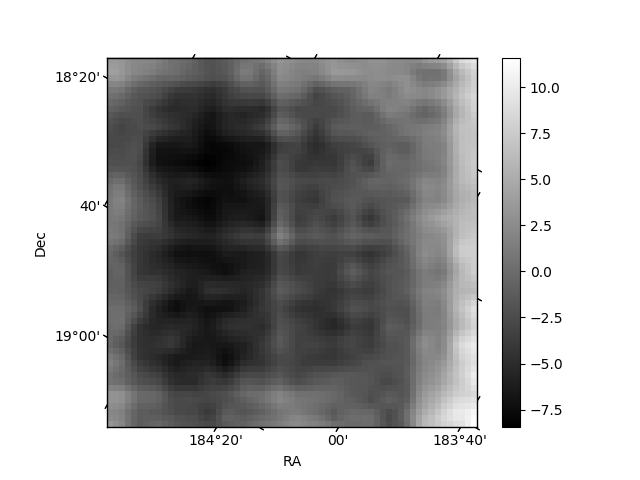
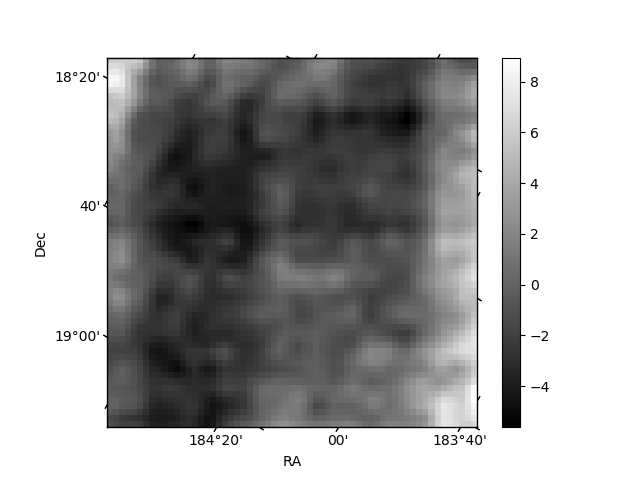
Histogram calculated using DETX and DETY for each event in the final _common_clean file
| Quadrant A | 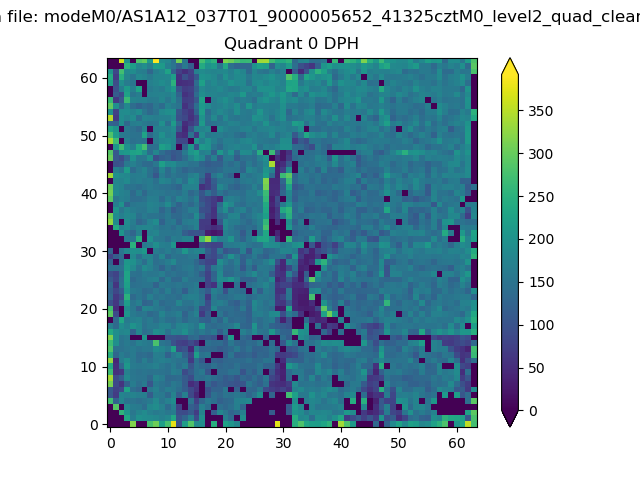 |
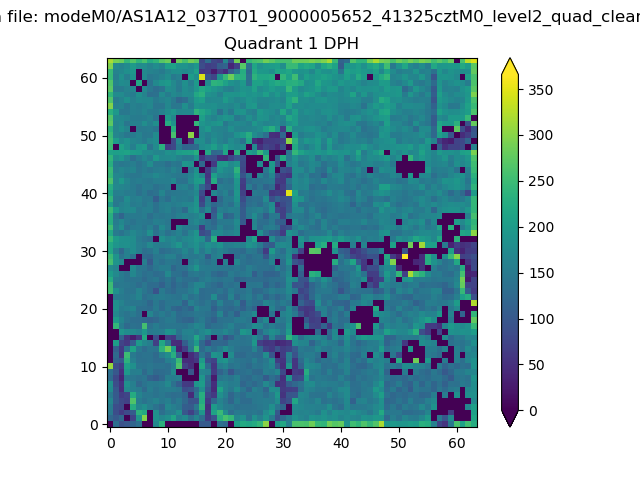 |
Quadrant B |
|---|---|---|---|
| Quadrant D | 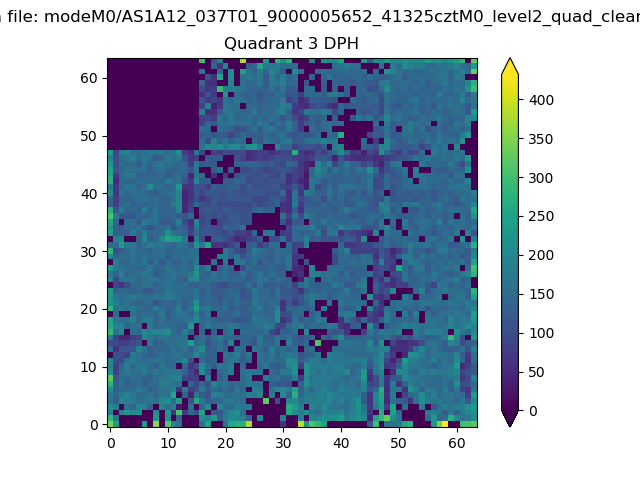 |
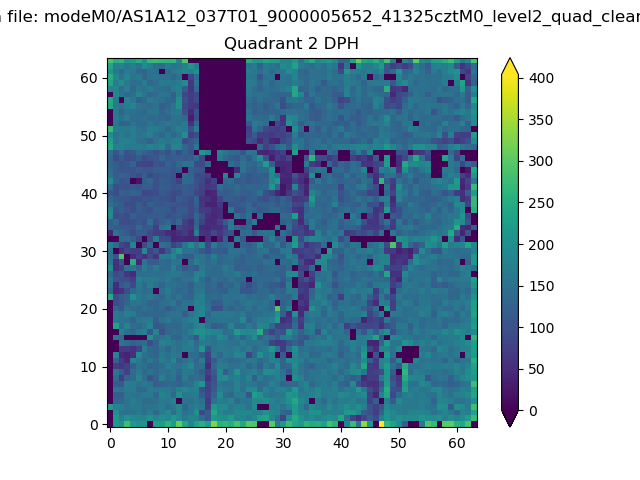 |
Quadrant C |
| Plot type | Count rate plots | Images |
|---|---|---|
| Comparison with Poisson distribution Blue bars denote a histogram of data divided into 1 sec bins. Red curve is a Poisson curve with rate = median count rate of data. |
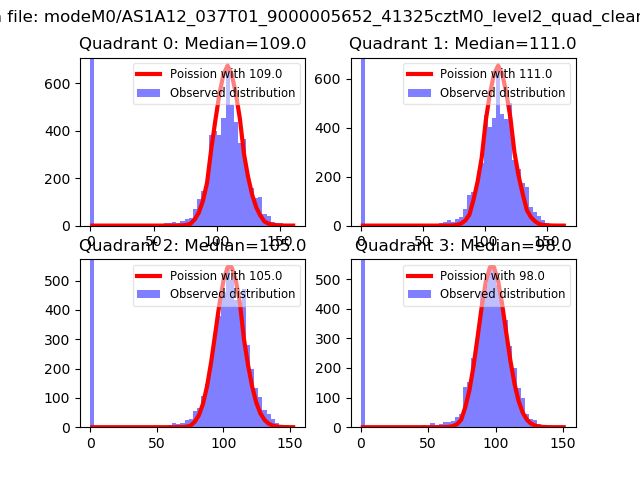 |
 |
| Quadrant-wise count rates Data is divided into 100 sec bins |
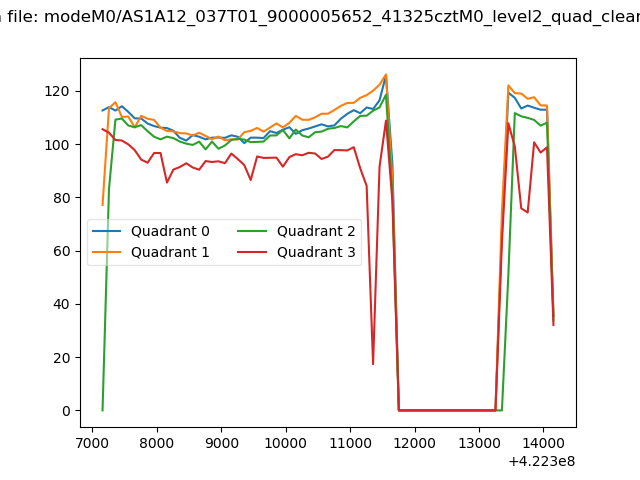 |
|
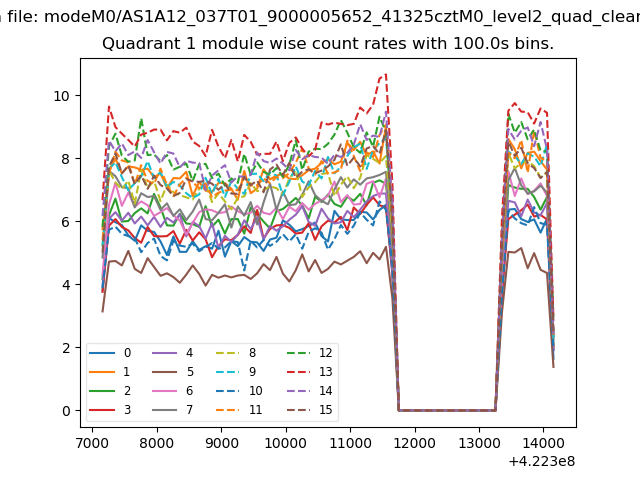
| Module-wise count rates for Quadrant A Data is divided into 100 sec bins |
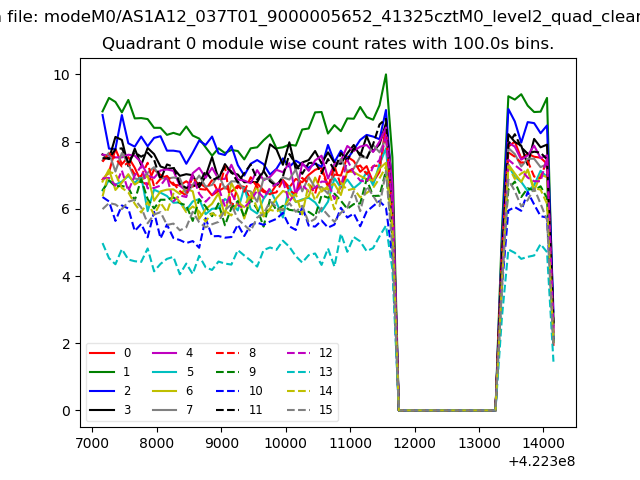 |
 |
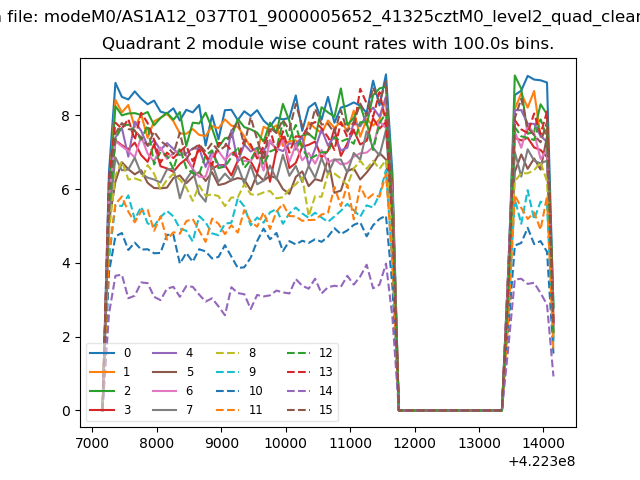
| Module-wise count rates for Quadrant B Data is divided into 100 sec bins |
 |
 |
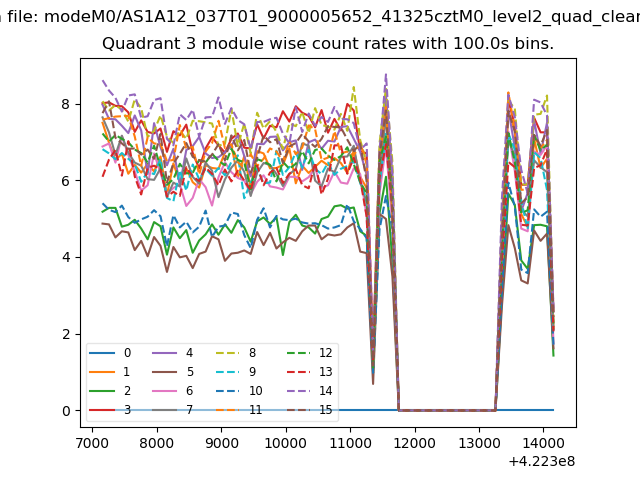
| Module-wise count rates for Quadrant C Data is divided into 100 sec bins |
 |
 |
| Module-wise count rates for Quadrant D Data is divided into 100 sec bins |
 |
 |
| Parameter | Plot |
|---|---|
| CZT HV Monitor | 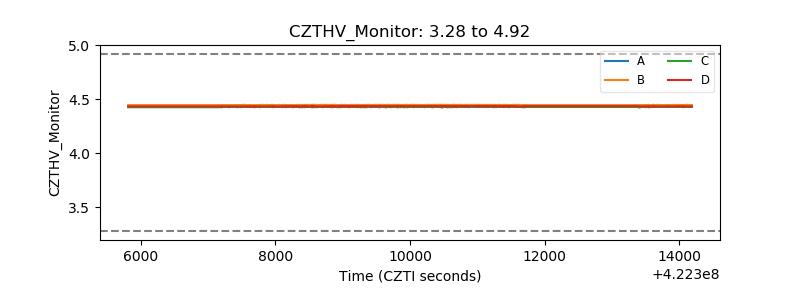 |
| D_VDD | 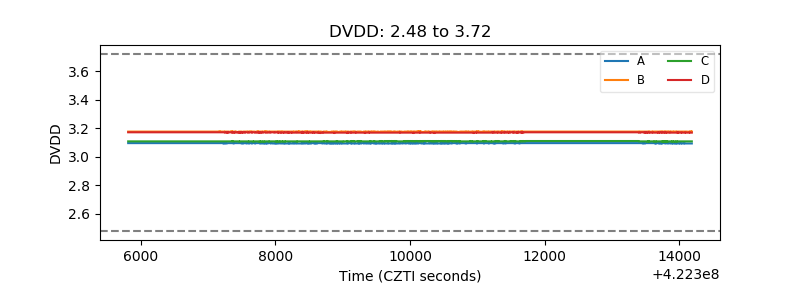 |
| Temperature 1 | 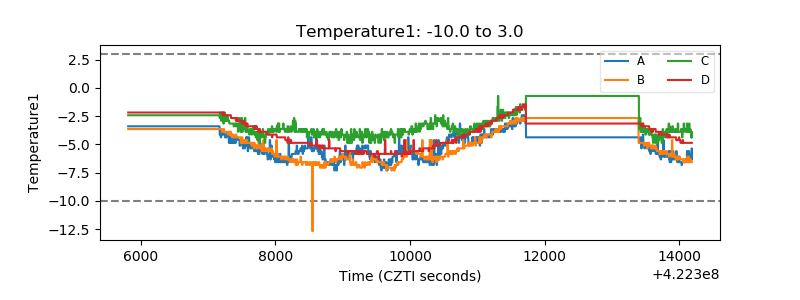 |
| Veto HV Monitor | 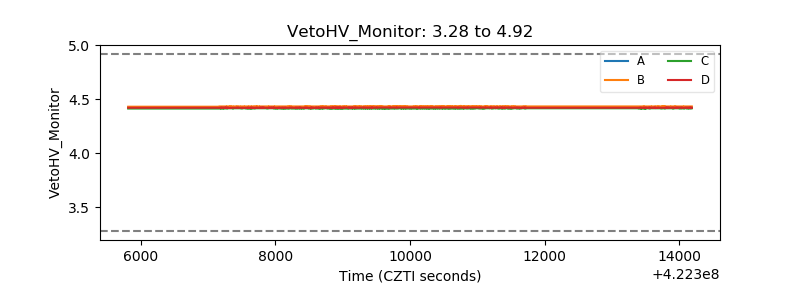 |
| Veto LLD | 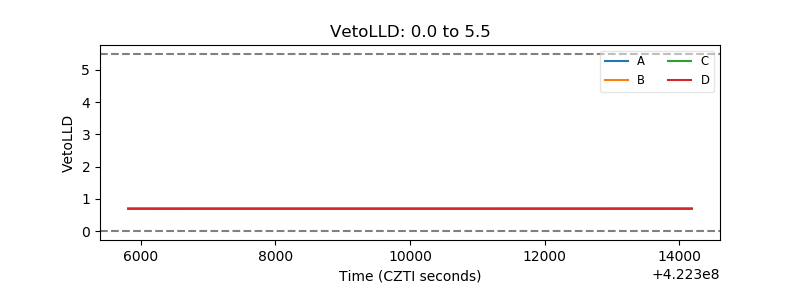 |
| Alpha Counter | 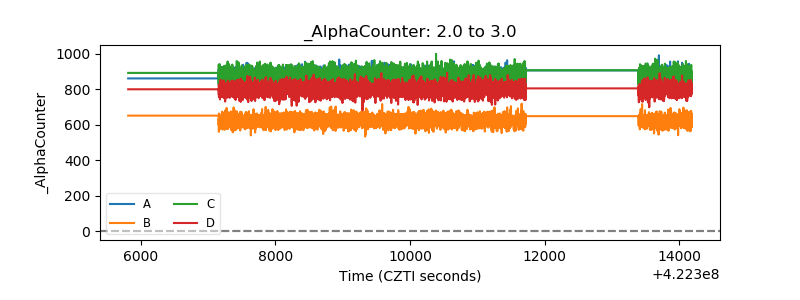 |
| _CPM_Rate | 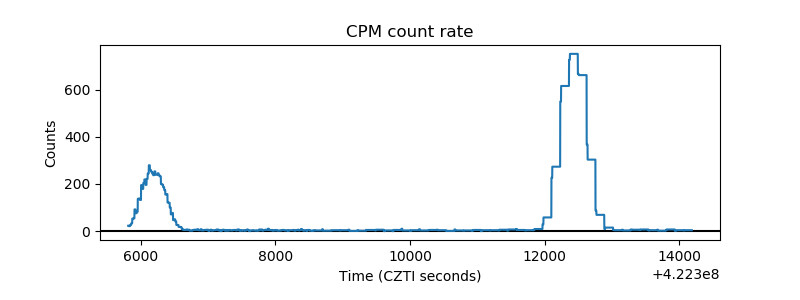 |
| CZT Counter | 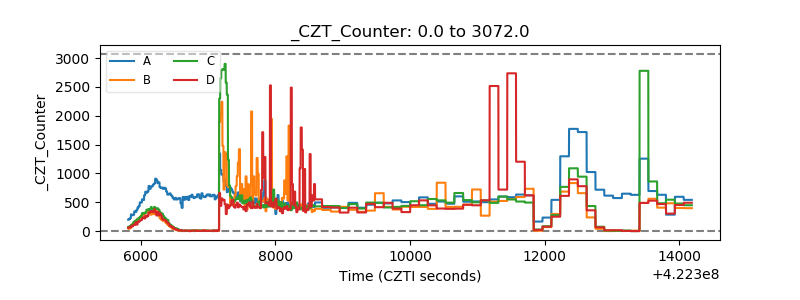 |
| +2.5 Volts monitor | 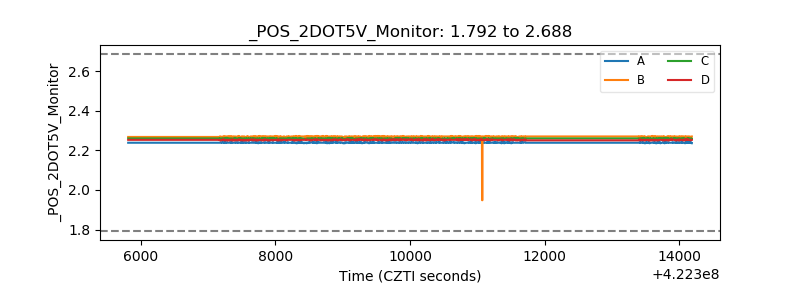 |
| +5 Volts monitor | 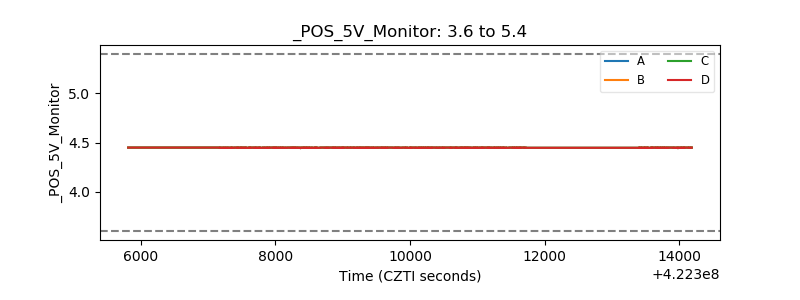 |
| _ROLL_ROT | 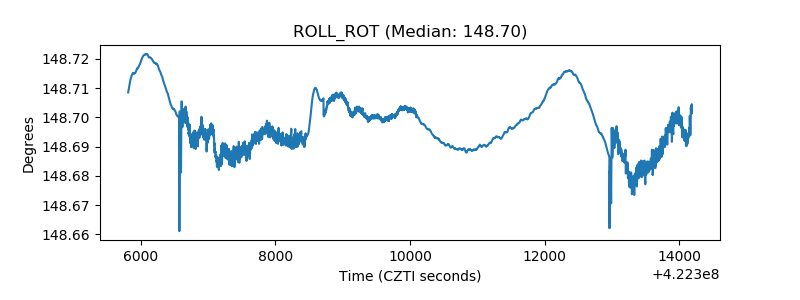 |
| _Roll_DEC | 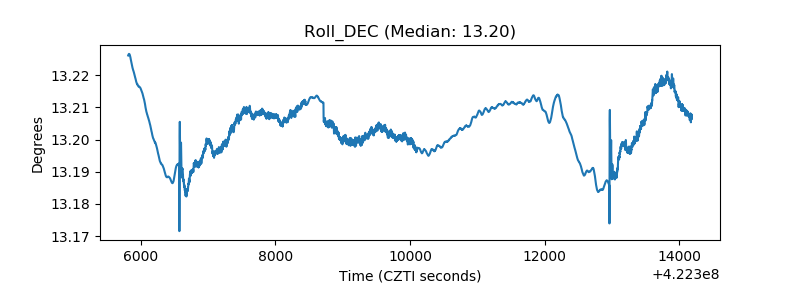 |
| _Roll_RA | 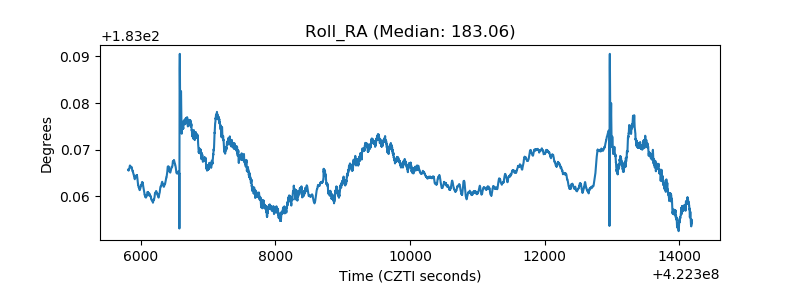 |
| Veto Counter | 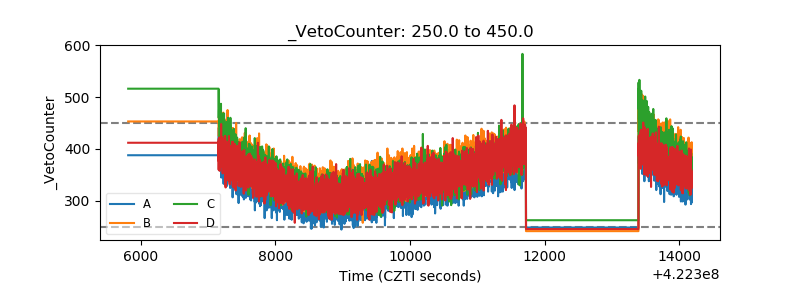 |