| Param | Original file | Final file |
|---|---|---|
| Filename | modeM0/AS1A12_037T01_9000005652_41327cztM0_level2.fits | modeM0/AS1A12_037T01_9000005652_41327cztM0_level2_quad_clean.evt |
| Size (bytes) | 311,941,440 | 85,953,600 |
| Size | 297.5 MB | 82.0 MB |
| Events in quadrant A | 2,813,073 | 581,521 |
| Events in quadrant B | 2,524,404 | 599,280 |
| Events in quadrant C | 3,100,041 | 536,422 |
| Events in quadrant D | 2,699,811 | 517,241 |
| Mode SS | |||
|---|---|---|---|
| Quadrant | BADHDUFLAG | Total packets | Discarded packets |
| A | 0 | 108 | 0 |
| B | 0 | 108 | 0 |
| C | 0 | 108 | 0 |
| D | 0 | 108 | 0 |
| Mode M9 | |||
|---|---|---|---|
| Quadrant | BADHDUFLAG | Total packets | Discarded packets |
| A | 0 | 28 | 0 |
| B | 0 | 28 | 0 |
| C | 0 | 28 | 0 |
| D | 0 | 29 | 0 |
| Mode M0 | |||
|---|---|---|---|
| Quadrant | BADHDUFLAG | Total packets | Discarded packets |
| A | 0 | 11552 | 3 |
| B | 0 | 11118 | 2 |
| C | 0 | 12518 | 2 |
| D | 0 | 11735 | 2 |
| Quadrant | Total seconds | Saturated seconds | Saturation percentage |
|---|---|---|---|
| A | 5255 | 15 | 0.285442% |
| B | 5255 | 18 | 0.342531% |
| C | 5255 | 260 | 4.947669% |
| D | 5255 | 84 | 1.598478% |
Noise dominated data is calculated using 1-second bins in cleaned event files. If a bin has >2000 counts, and if more than 50% of those come from <1% of pixels, then it is considered to be noise-dominated and hence unusable.
| Quadrant | # 1 sec bins | Bins with >0 counts | Bins with >2000 counts | High rate bins dominated by noise | Noise dominated (total time) | Noise dominated (detector-on time) | Marked lightcurve |
|---|---|---|---|---|---|---|---|
| A | 7048 | 5256 | 4 | 4 | 0.06% | 0.08% | 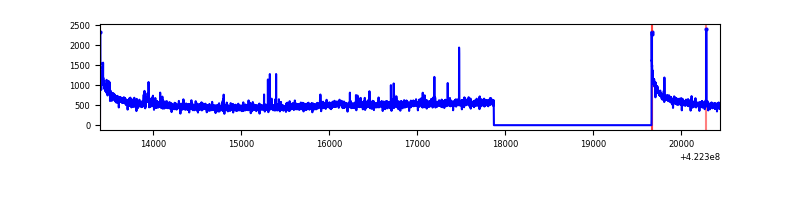 |
| B | 7048 | 5256 | 5 | 5 | 0.07% | 0.10% |  |
| C | 7048 | 5256 | 257 | 257 | 3.65% | 4.89% | 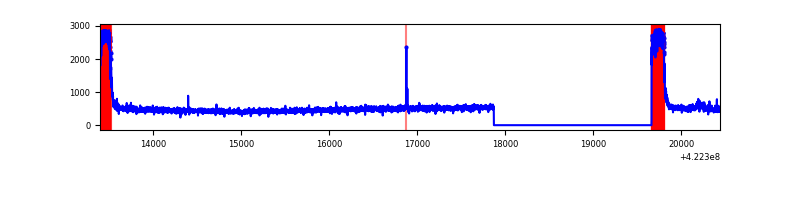 |
| D | 7048 | 5256 | 81 | 81 | 1.15% | 1.54% | 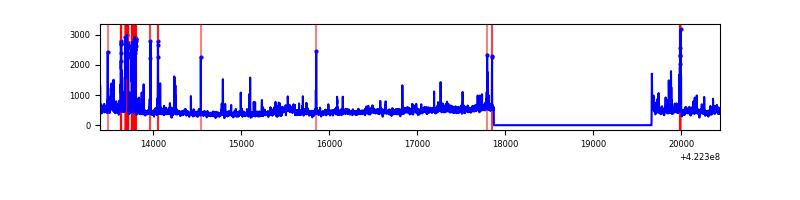 |
Top three noisy pixels from each quadrant. If the there are fewer than three noisy pixels in the level2.evt file, extra rows are filled as -1
| Pixel properties | Quadrant properties | ||||||
|---|---|---|---|---|---|---|---|
| Quadrant | DetID | PixID | Counts | Sigma | Mean | Median | Sigma |
| A | 10 | 83 | 500900 | 4212.17 | 578 | 566 | 118.8 |
| A | 2 | 79 | 45225 | 375.97 | 578 | 566 | 118.8 |
| A | 12 | 189 | 15989 | 129.84 | 578 | 566 | 118.8 |
| B | 5 | 255 | 101224 | 888.18 | 575 | 557 | 113.3 |
| B | 0 | 190 | 77097 | 675.31 | 575 | 557 | 113.3 |
| B | 0 | 229 | 68393 | 598.51 | 575 | 557 | 113.3 |
| C | 0 | 10 | 731048 | 5670.57 | 543 | 547 | 128.8 |
| C | 15 | 214 | 219847 | 1702.33 | 543 | 547 | 128.8 |
| C | 9 | 54 | 19400 | 146.35 | 543 | 547 | 128.8 |
| D | 13 | 249 | 218408 | 1588.02 | 554 | 540 | 137.2 |
| D | 1 | 52 | 112059 | 812.85 | 554 | 540 | 137.2 |
| D | 5 | 222 | 87241 | 631.96 | 554 | 540 | 137.2 |
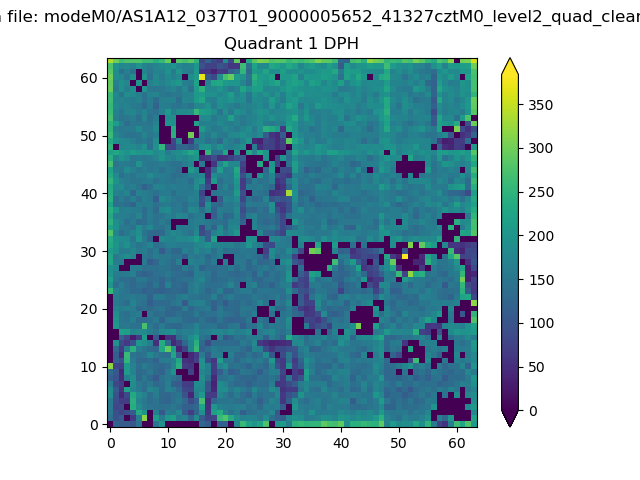
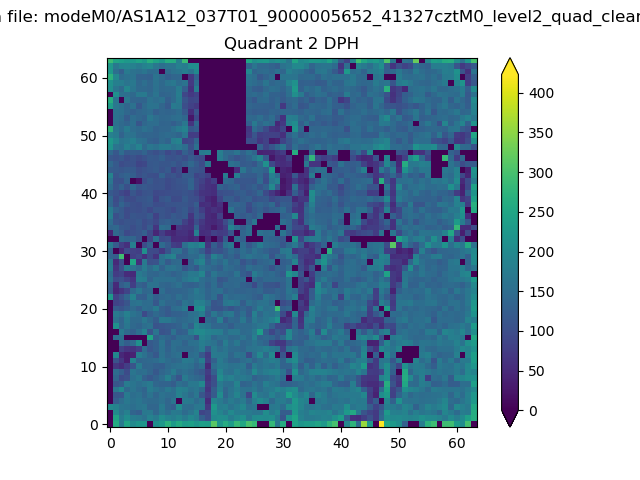
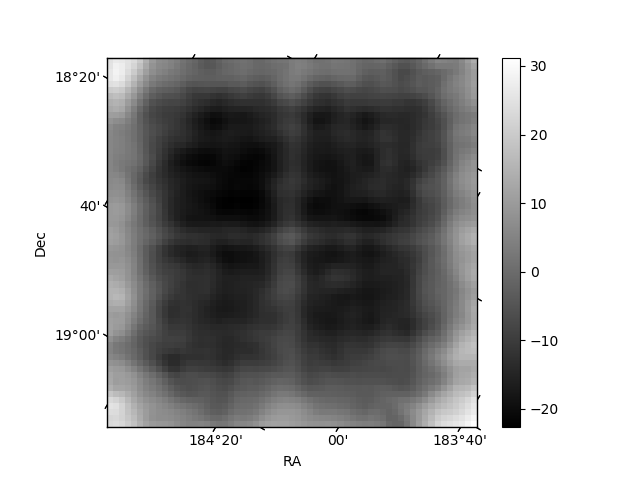
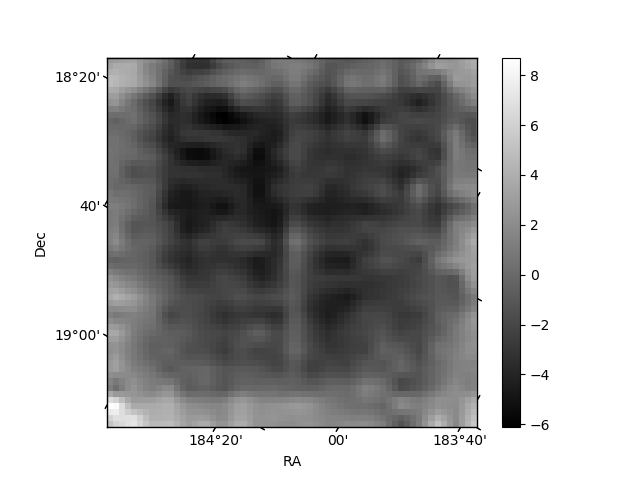
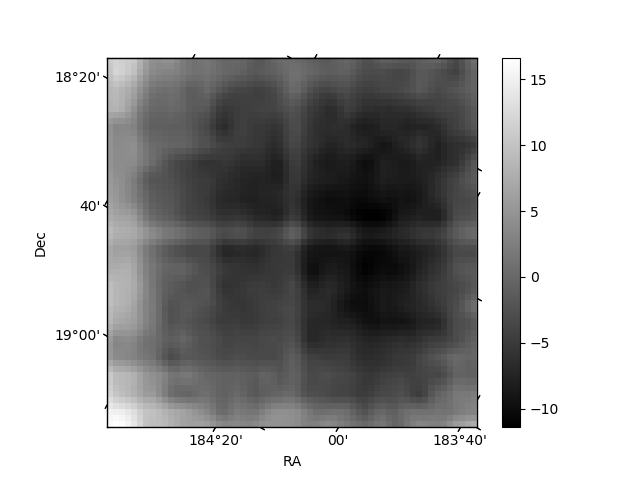
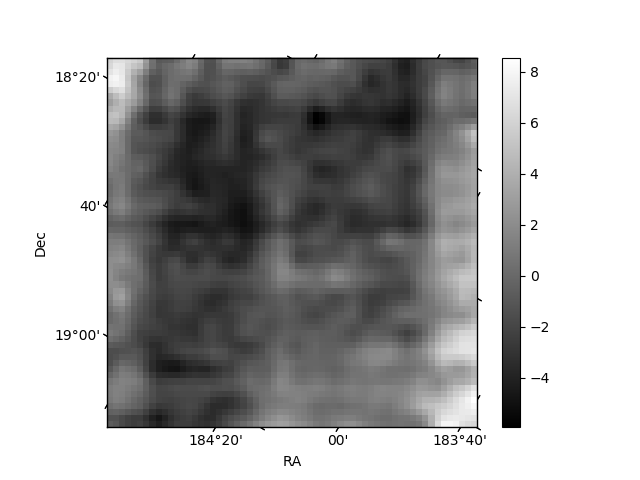
Histogram calculated using DETX and DETY for each event in the final _common_clean file
| Quadrant A | 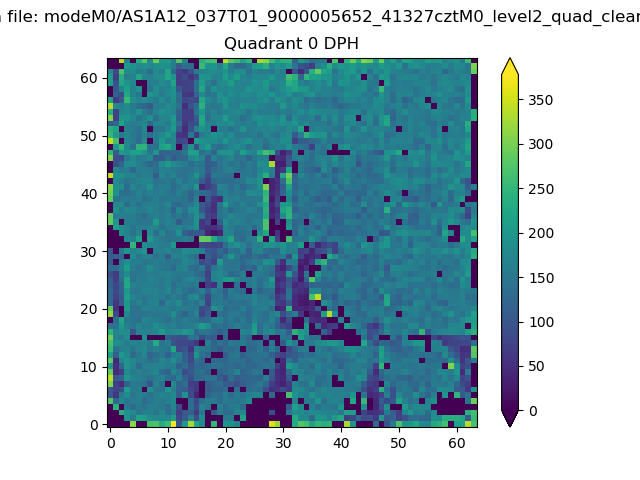 |
 |
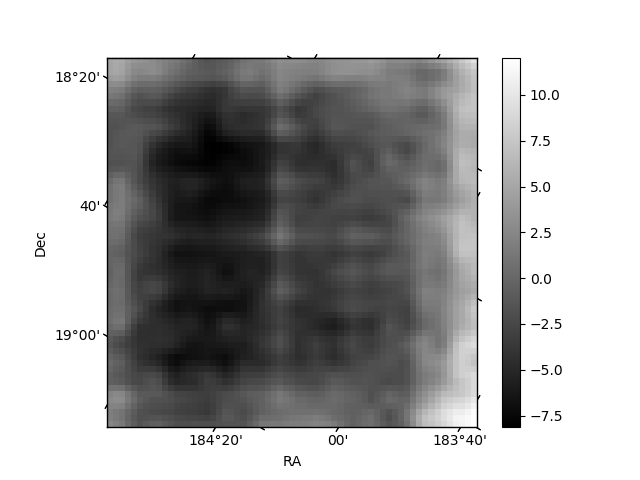
Quadrant B |
|---|---|---|---|
| Quadrant D | 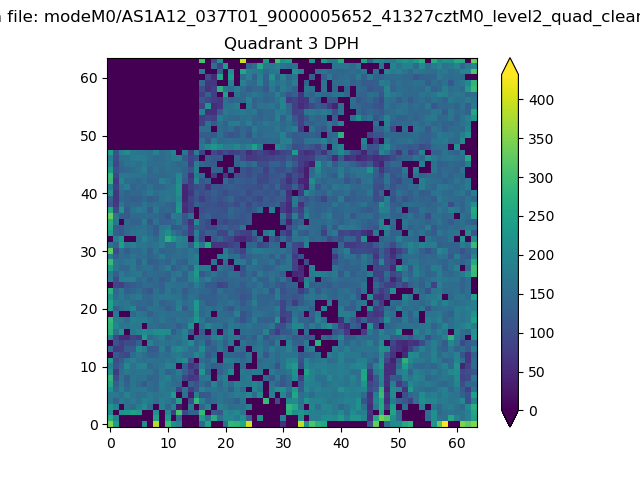 |
 |
Quadrant C |
| Plot type | Count rate plots | Images |
|---|---|---|
| Comparison with Poisson distribution Blue bars denote a histogram of data divided into 1 sec bins. Red curve is a Poisson curve with rate = median count rate of data. |
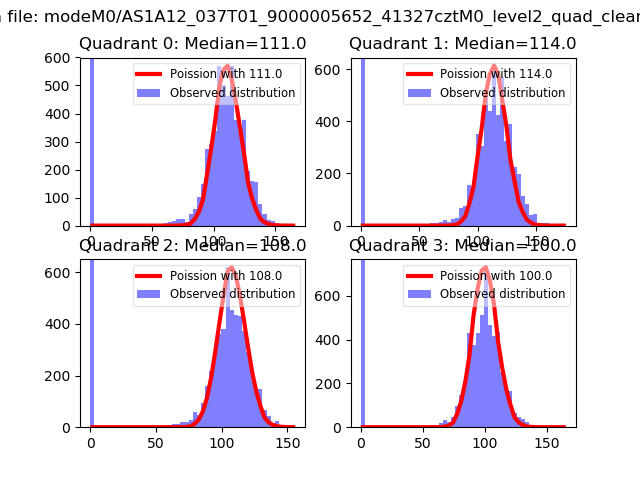 |
 |
| Quadrant-wise count rates Data is divided into 100 sec bins |
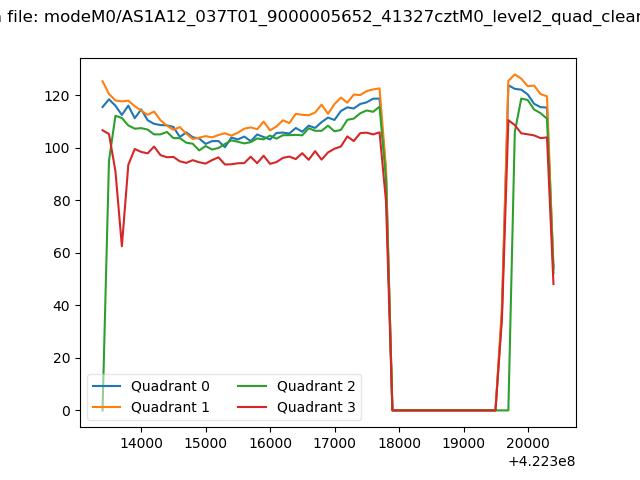 |
|
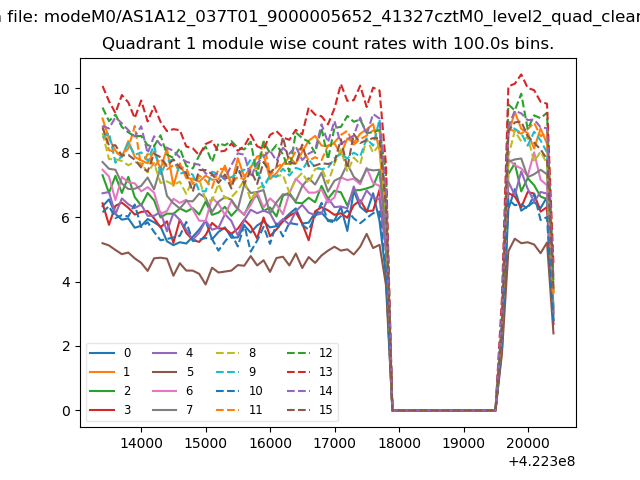
| Module-wise count rates for Quadrant A Data is divided into 100 sec bins |
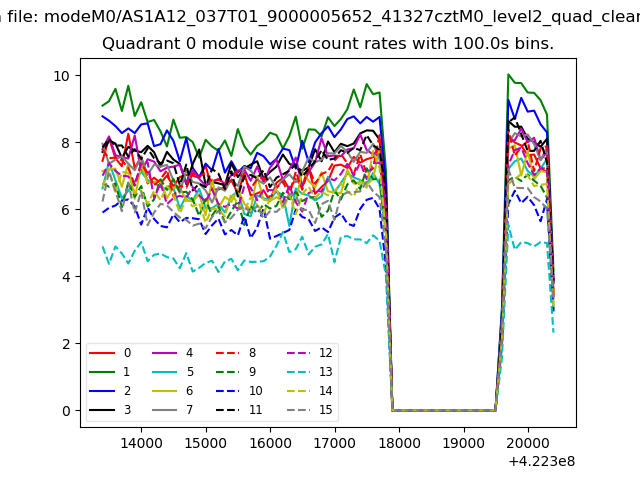 |
 |
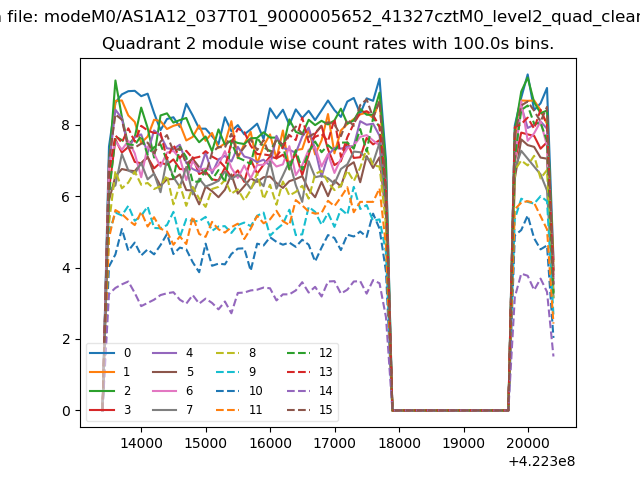
| Module-wise count rates for Quadrant B Data is divided into 100 sec bins |
 |
 |
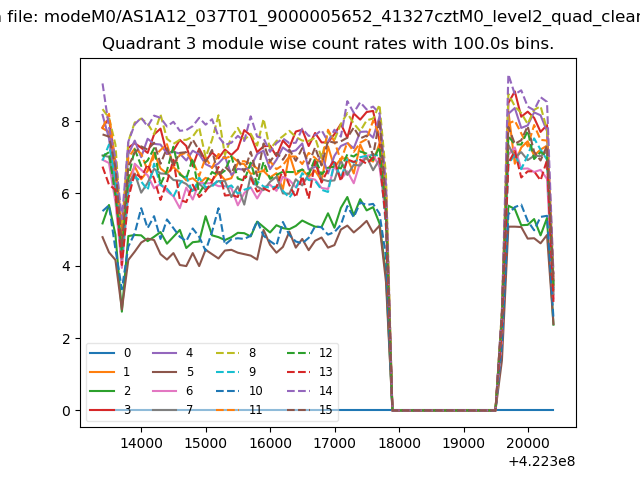
| Module-wise count rates for Quadrant C Data is divided into 100 sec bins |
 |
 |
| Module-wise count rates for Quadrant D Data is divided into 100 sec bins |
 |
 |
| Parameter | Plot |
|---|---|
| CZT HV Monitor | 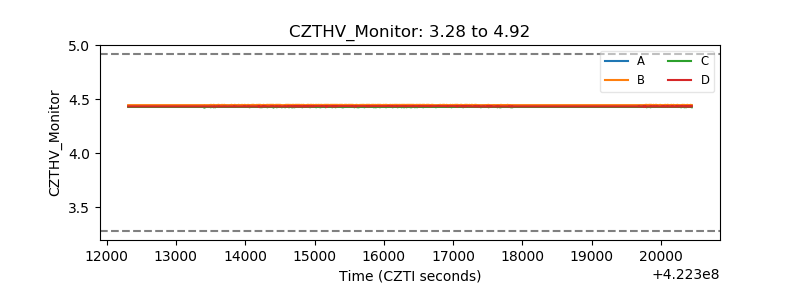 |
| D_VDD | 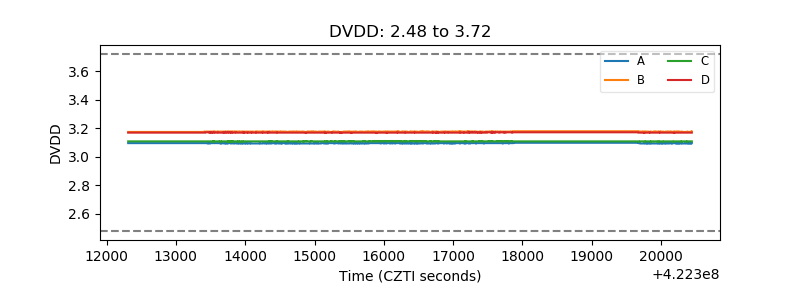 |
| Temperature 1 | 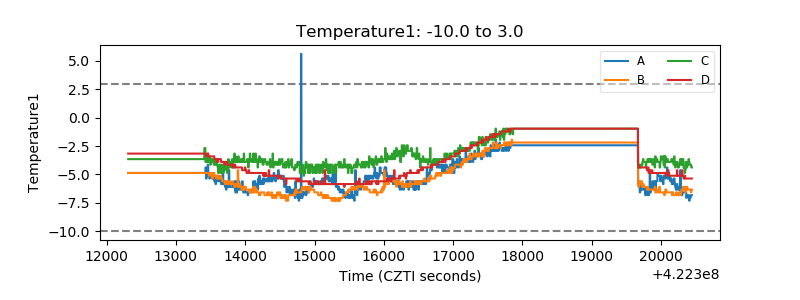 |
| Veto HV Monitor | 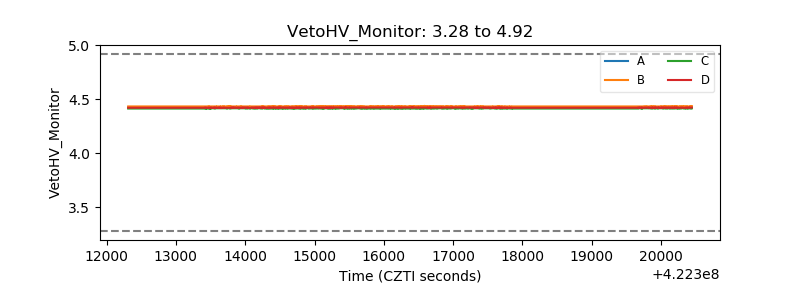 |
| Veto LLD | 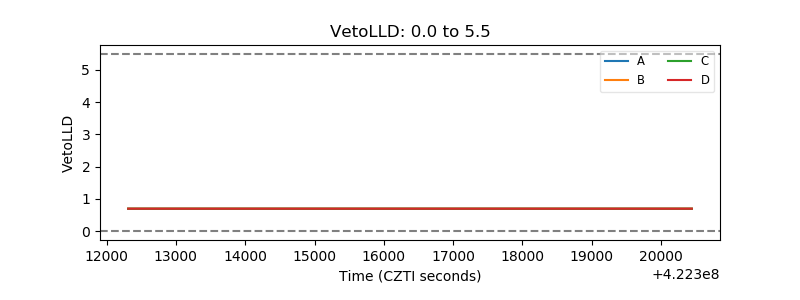 |
| Alpha Counter | 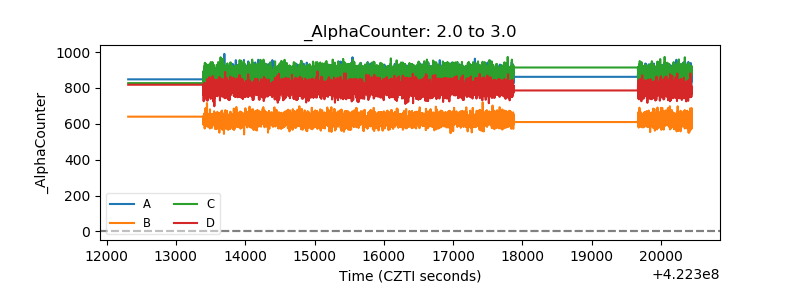 |
| _CPM_Rate | 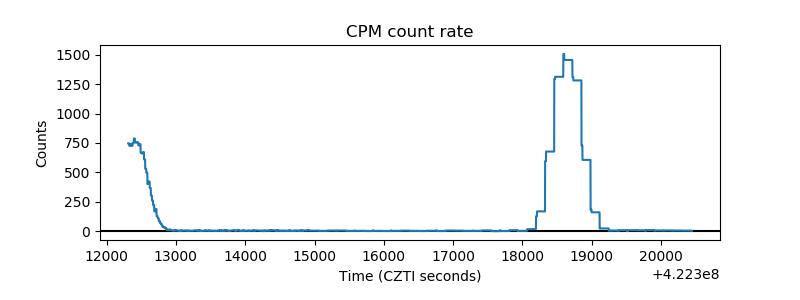 |
| CZT Counter | 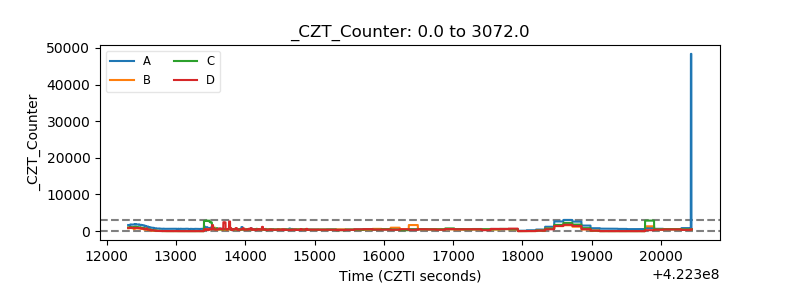 |
| +2.5 Volts monitor | 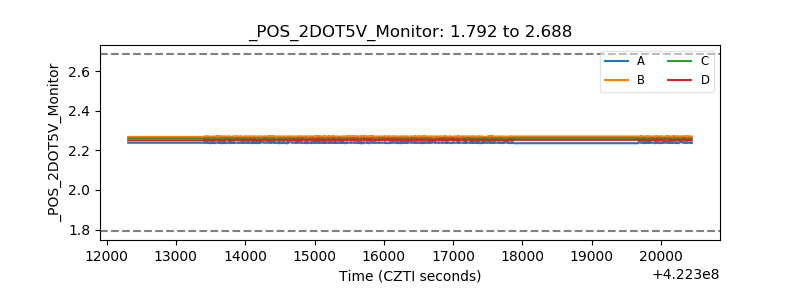 |
| +5 Volts monitor | 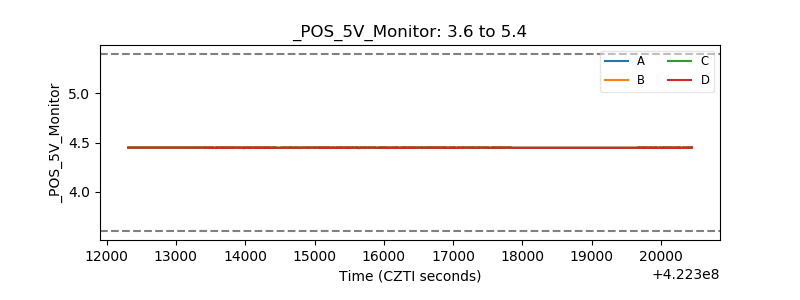 |
| _ROLL_ROT | 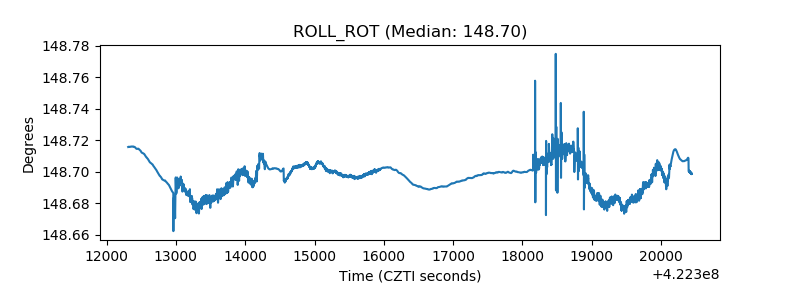 |
| _Roll_DEC | 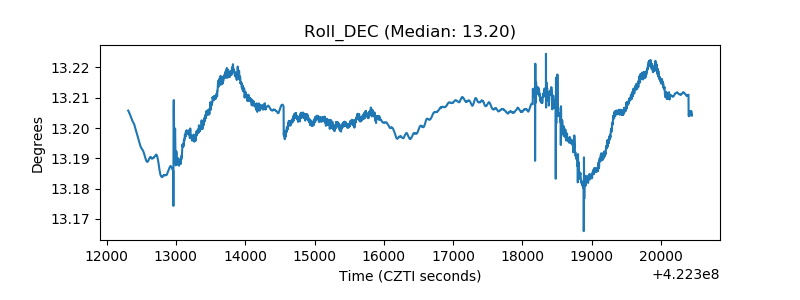 |
| _Roll_RA | 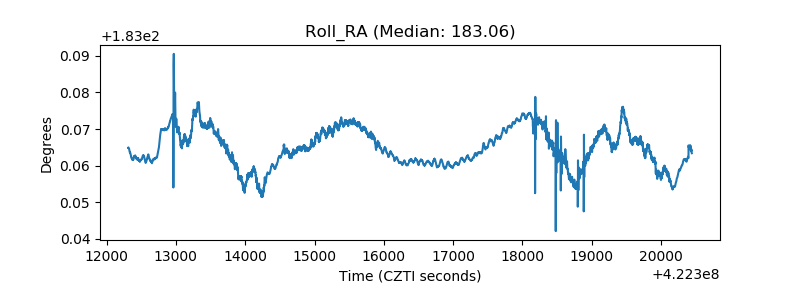 |
| Veto Counter | 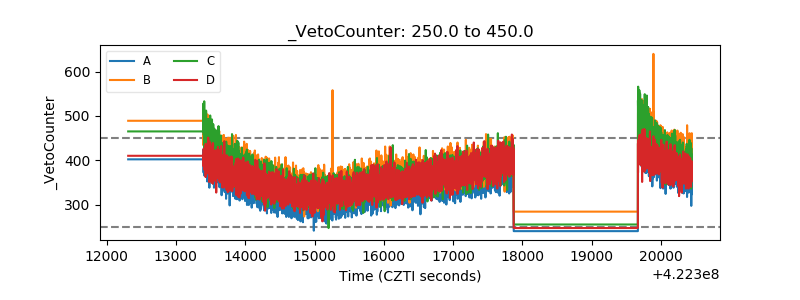 |