| Param | Original file | Final file |
|---|---|---|
| Filename | modeM0/AS1A12_037T01_9000005652_41328cztM0_level2.fits | modeM0/AS1A12_037T01_9000005652_41328cztM0_level2_quad_clean.evt |
| Size (bytes) | 331,300,800 | 87,488,640 |
| Size | 316.0 MB | 83.4 MB |
| Events in quadrant A | 2,793,550 | 597,281 |
| Events in quadrant B | 2,509,339 | 615,657 |
| Events in quadrant C | 3,219,292 | 546,764 |
| Events in quadrant D | 3,337,162 | 526,358 |
| Mode SS | |||
|---|---|---|---|
| Quadrant | BADHDUFLAG | Total packets | Discarded packets |
| A | 0 | 106 | 0 |
| B | 0 | 106 | 0 |
| C | 0 | 106 | 0 |
| D | 0 | 106 | 0 |
| Mode M9 | |||
|---|---|---|---|
| Quadrant | BADHDUFLAG | Total packets | Discarded packets |
| A | 0 | 38 | 0 |
| B | 0 | 38 | 0 |
| C | 0 | 38 | 0 |
| D | 0 | 38 | 0 |
| Mode M0 | |||
|---|---|---|---|
| Quadrant | BADHDUFLAG | Total packets | Discarded packets |
| A | 0 | 11331 | 3 |
| B | 0 | 10902 | 2 |
| C | 0 | 12625 | 2 |
| D | 0 | 13522 | 2 |
| Quadrant | Total seconds | Saturated seconds | Saturation percentage |
|---|---|---|---|
| A | 5190 | 13 | 0.250482% |
| B | 5190 | 14 | 0.269750% |
| C | 5190 | 277 | 5.337187% |
| D | 5190 | 114 | 2.196532% |
Noise dominated data is calculated using 1-second bins in cleaned event files. If a bin has >2000 counts, and if more than 50% of those come from <1% of pixels, then it is considered to be noise-dominated and hence unusable.
| Quadrant | # 1 sec bins | Bins with >0 counts | Bins with >2000 counts | High rate bins dominated by noise | Noise dominated (total time) | Noise dominated (detector-on time) | Marked lightcurve |
|---|---|---|---|---|---|---|---|
| A | 8929 | 5192 | 5 | 5 | 0.06% | 0.10% | 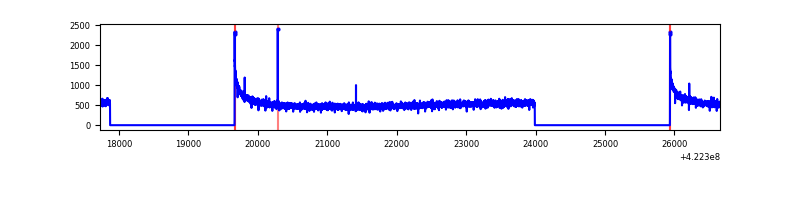 |
| B | 8929 | 5192 | 6 | 6 | 0.07% | 0.12% | 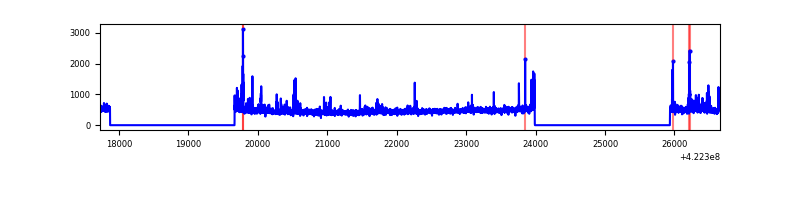 |
| C | 8929 | 5192 | 273 | 273 | 3.06% | 5.26% | 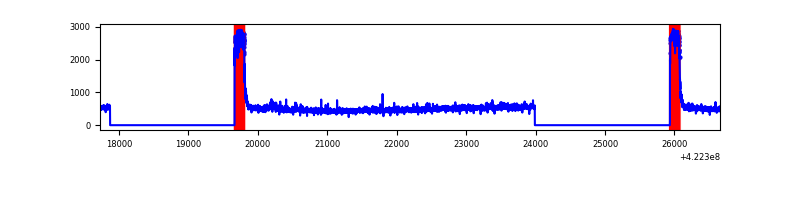 |
| D | 8929 | 5192 | 97 | 97 | 1.09% | 1.87% | 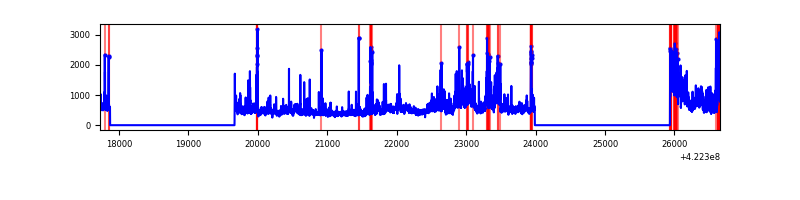 |
Top three noisy pixels from each quadrant. If the there are fewer than three noisy pixels in the level2.evt file, extra rows are filled as -1
| Pixel properties | Quadrant properties | ||||||
|---|---|---|---|---|---|---|---|
| Quadrant | DetID | PixID | Counts | Sigma | Mean | Median | Sigma |
| A | 10 | 83 | 499077 | 4153.5 | 588 | 577 | 120.0 |
| A | 12 | 189 | 13108 | 104.41 | 588 | 577 | 120.0 |
| A | 13 | 6 | 7638 | 58.83 | 588 | 577 | 120.0 |
| B | 5 | 255 | 104327 | 907.41 | 586 | 571 | 114.3 |
| B | 0 | 190 | 85095 | 739.22 | 586 | 571 | 114.3 |
| B | 12 | 111 | 14897 | 125.29 | 586 | 571 | 114.3 |
| C | 0 | 10 | 825967 | 6336.46 | 551 | 555 | 130.3 |
| C | 15 | 214 | 215571 | 1650.62 | 551 | 555 | 130.3 |
| C | 9 | 54 | 25609 | 192.33 | 551 | 555 | 130.3 |
| D | 2 | 120 | 422465 | 3035.63 | 562 | 545 | 139.0 |
| D | 1 | 52 | 316425 | 2272.7 | 562 | 545 | 139.0 |
| D | 13 | 249 | 169628 | 1216.52 | 562 | 545 | 139.0 |
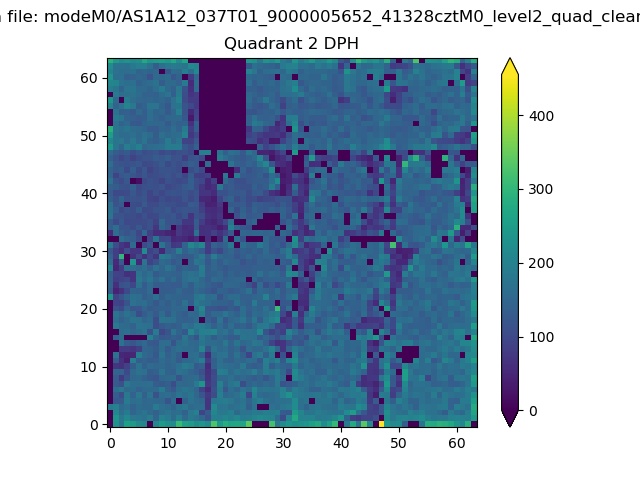
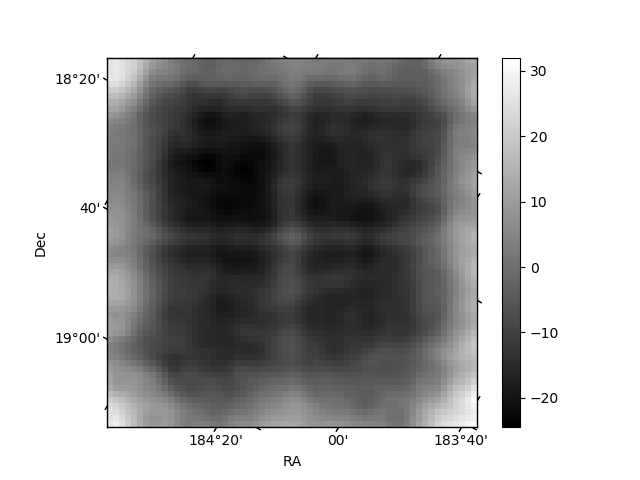
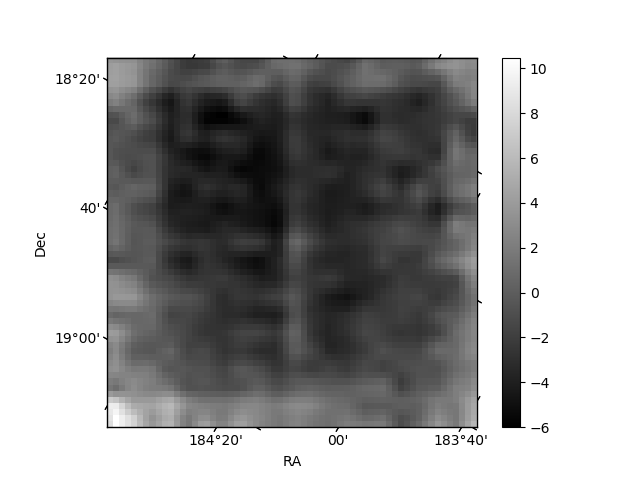
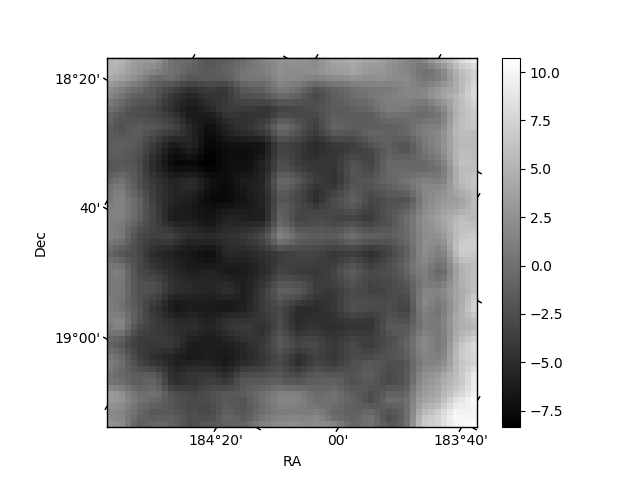
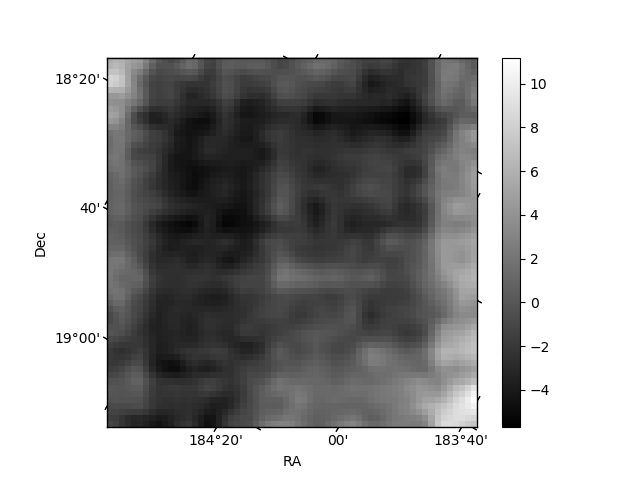
Histogram calculated using DETX and DETY for each event in the final _common_clean file
| Quadrant A | 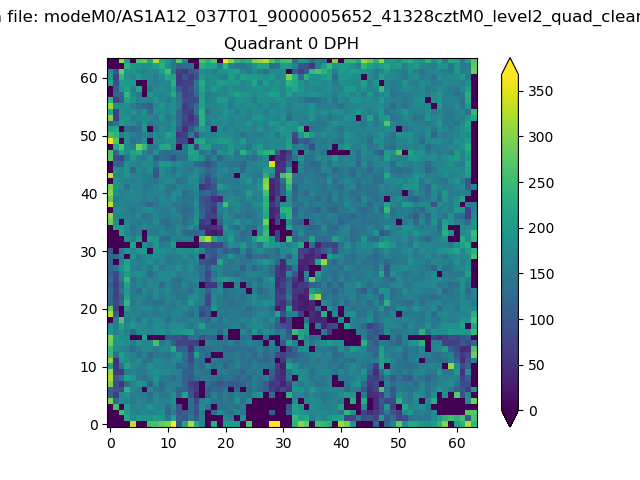 |
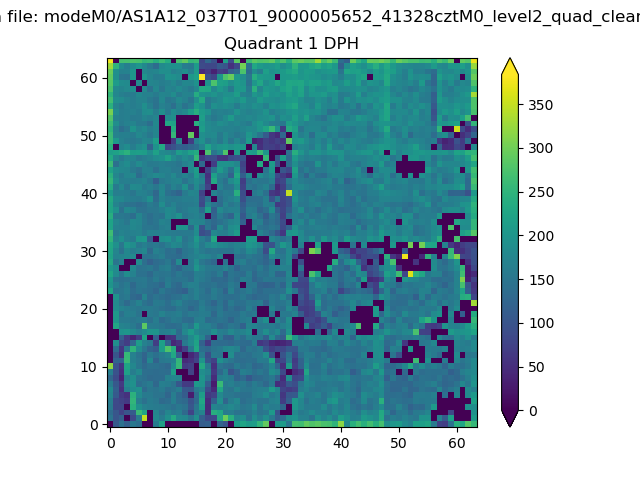 |
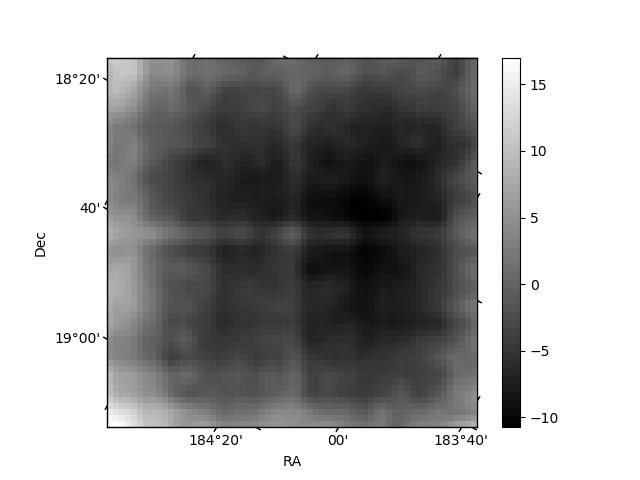
Quadrant B |
|---|---|---|---|
| Quadrant D | 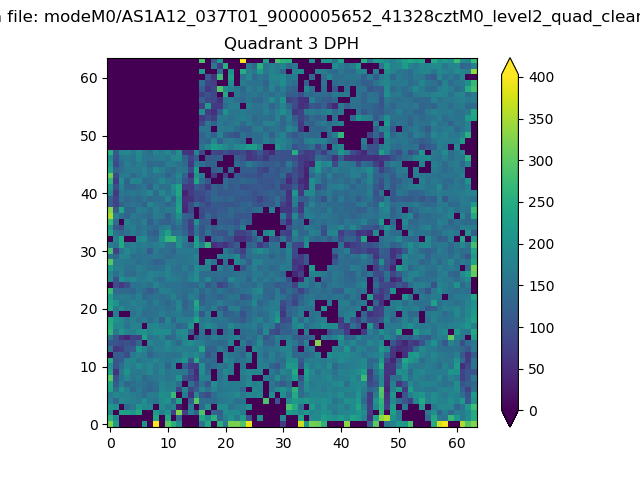 |
 |
Quadrant C |
| Plot type | Count rate plots | Images |
|---|---|---|
| Comparison with Poisson distribution Blue bars denote a histogram of data divided into 1 sec bins. Red curve is a Poisson curve with rate = median count rate of data. |
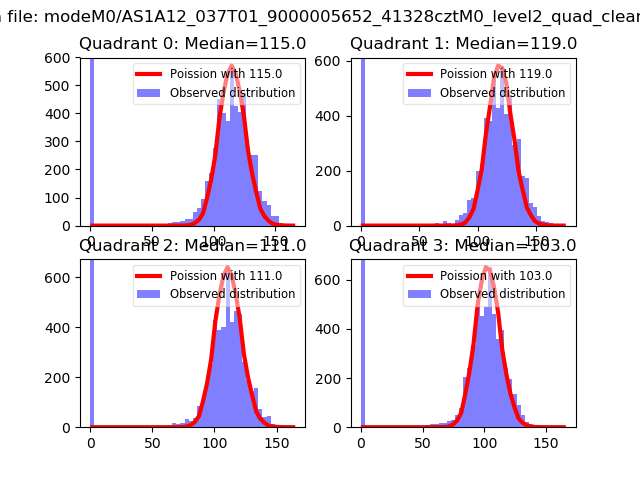 |
 |
| Quadrant-wise count rates Data is divided into 100 sec bins |
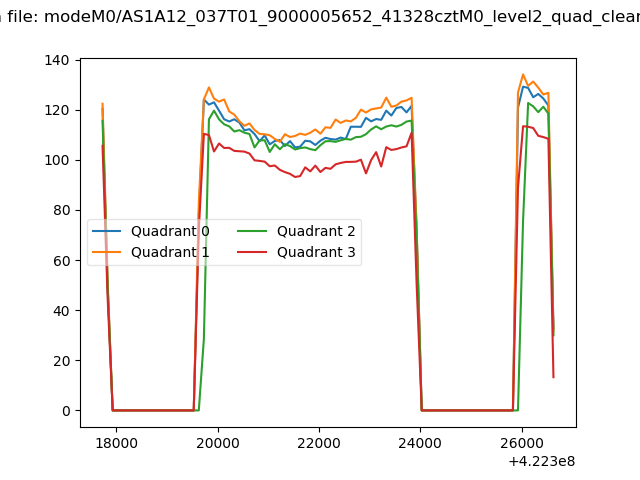 |
|
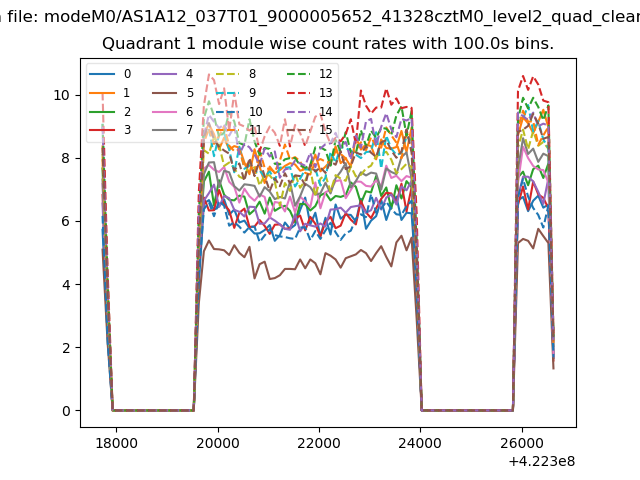
| Module-wise count rates for Quadrant A Data is divided into 100 sec bins |
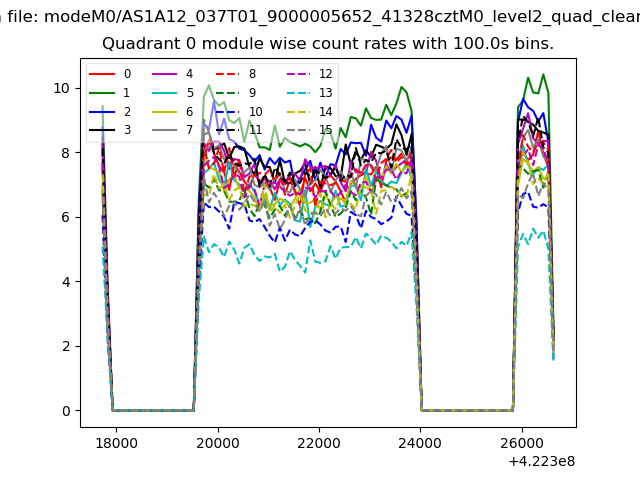 |
 |
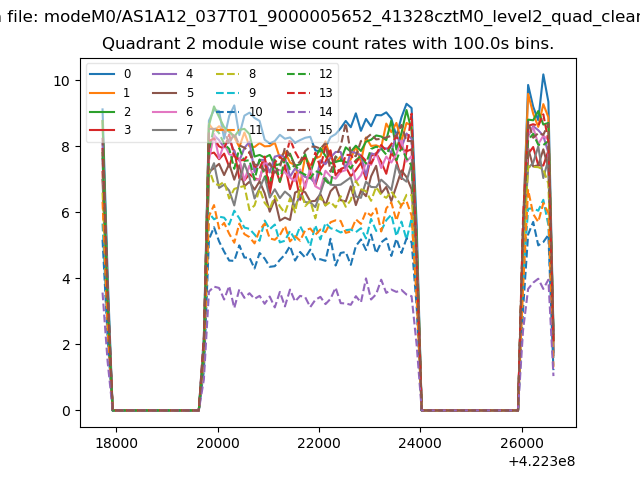
| Module-wise count rates for Quadrant B Data is divided into 100 sec bins |
 |
 |
| Module-wise count rates for Quadrant C Data is divided into 100 sec bins |
 |
 |
| Module-wise count rates for Quadrant D Data is divided into 100 sec bins |
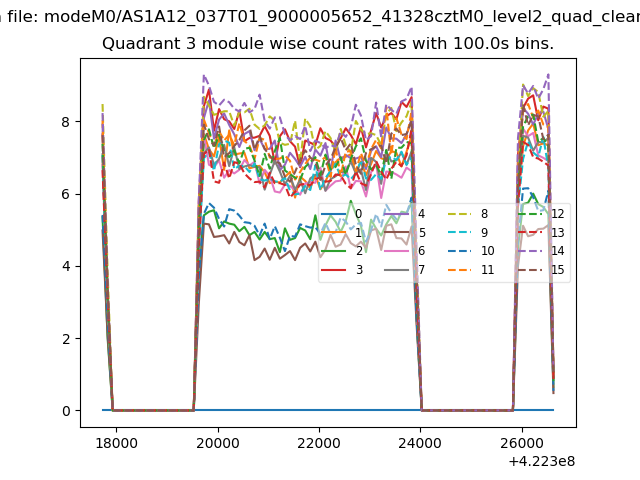 |
 |
| Parameter | Plot |
|---|---|
| CZT HV Monitor | 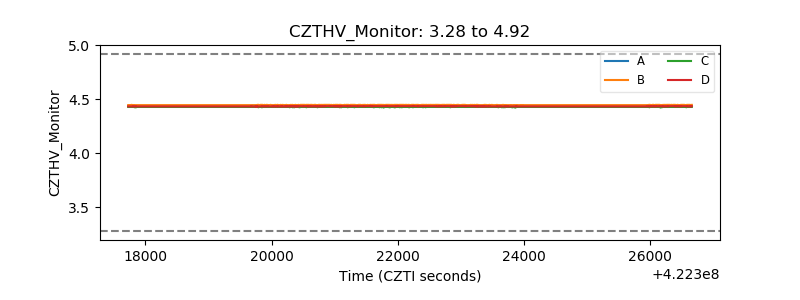 |
| D_VDD | 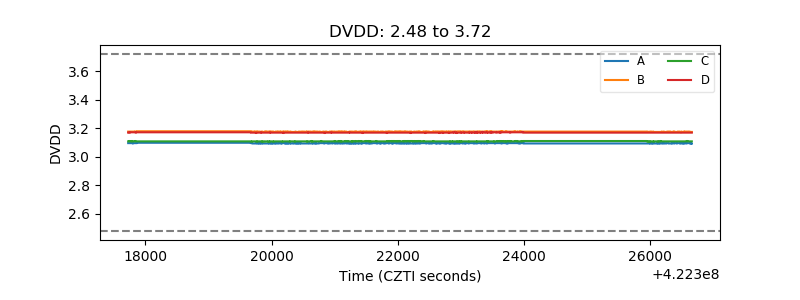 |
| Temperature 1 | 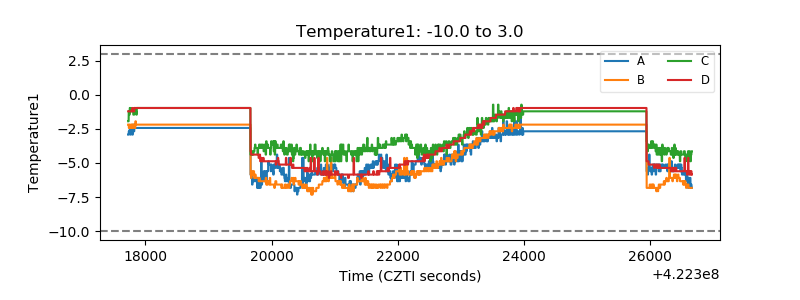 |
| Veto HV Monitor | 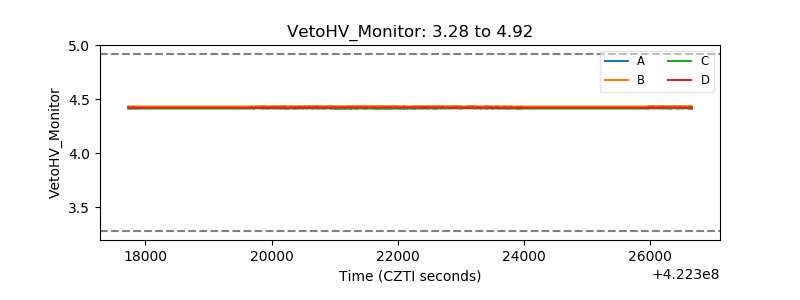 |
| Veto LLD | 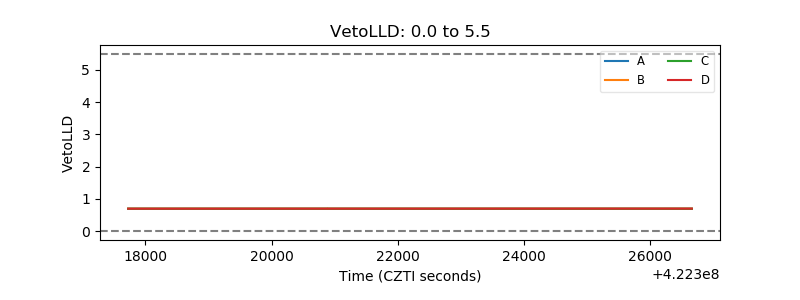 |
| Alpha Counter | 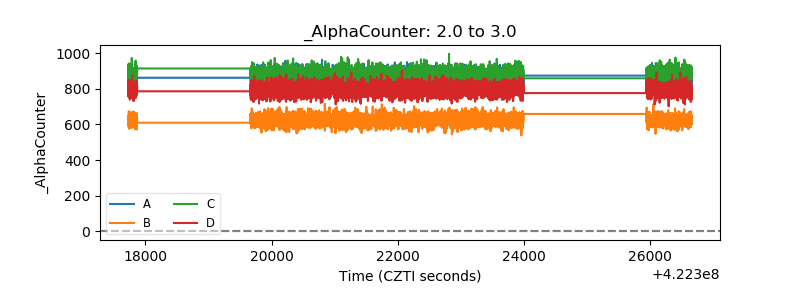 |
| _CPM_Rate | 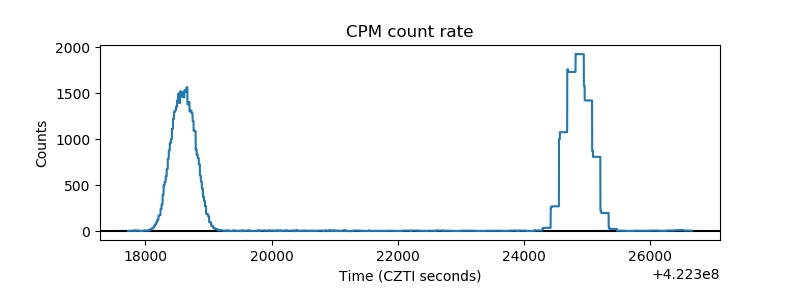 |
| CZT Counter | 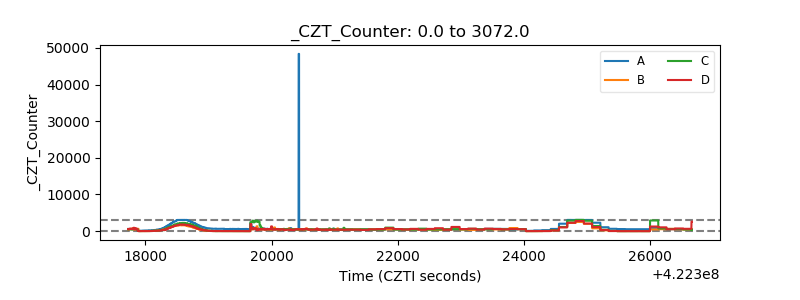 |
| +2.5 Volts monitor | 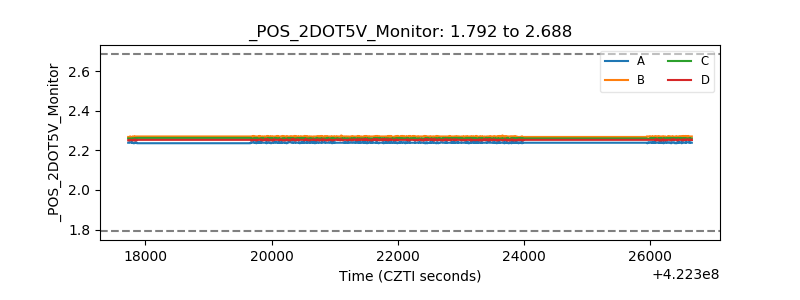 |
| +5 Volts monitor | 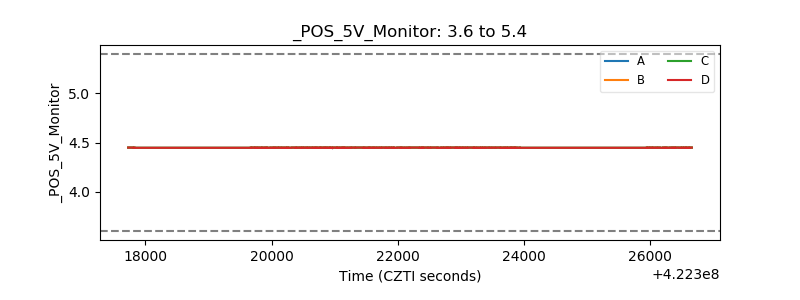 |
| _ROLL_ROT | 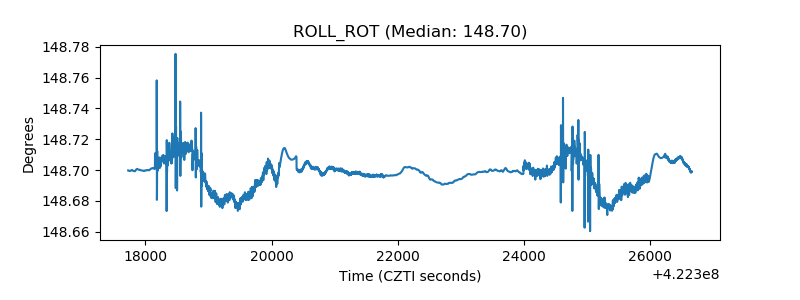 |
| _Roll_DEC | 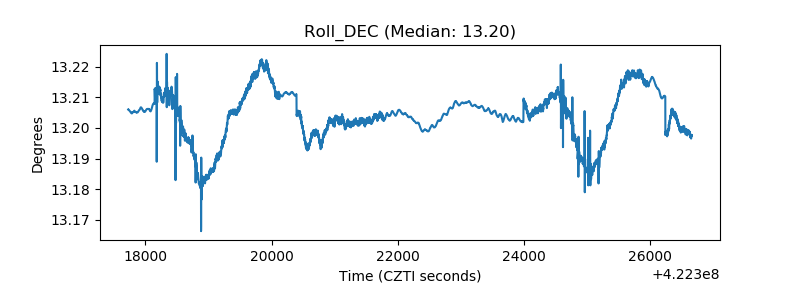 |
| _Roll_RA | 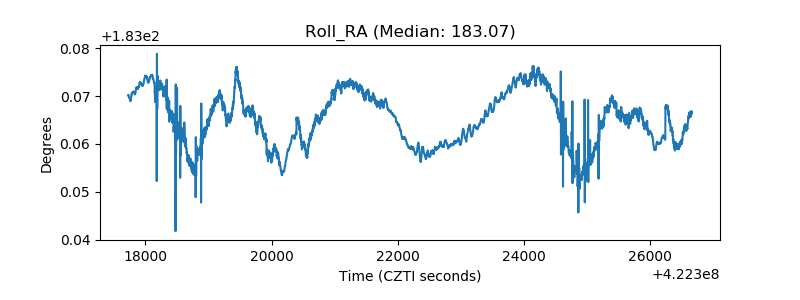 |
| Veto Counter | 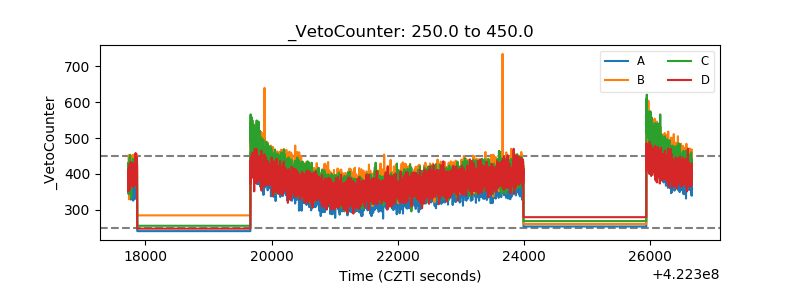 |