| Param | Original file | Final file |
|---|---|---|
| Filename | modeM0/AS1A12_037T01_9000005652_41329cztM0_level2.fits | modeM0/AS1A12_037T01_9000005652_41329cztM0_level2_quad_clean.evt |
| Size (bytes) | 340,387,200 | 86,230,080 |
| Size | 324.6 MB | 82.2 MB |
| Events in quadrant A | 2,801,636 | 594,085 |
| Events in quadrant B | 2,537,185 | 615,268 |
| Events in quadrant C | 3,204,336 | 540,548 |
| Events in quadrant D | 3,666,907 | 510,361 |
| Mode SS | |||
|---|---|---|---|
| Quadrant | BADHDUFLAG | Total packets | Discarded packets |
| A | 0 | 104 | 0 |
| B | 0 | 104 | 0 |
| C | 0 | 104 | 0 |
| D | 0 | 104 | 0 |
| Mode M9 | |||
|---|---|---|---|
| Quadrant | BADHDUFLAG | Total packets | Discarded packets |
| A | 0 | 40 | 0 |
| B | 0 | 40 | 0 |
| C | 0 | 40 | 0 |
| D | 0 | 40 | 0 |
| Mode M0 | |||
|---|---|---|---|
| Quadrant | BADHDUFLAG | Total packets | Discarded packets |
| A | 0 | 11229 | 3 |
| B | 0 | 10707 | 2 |
| C | 0 | 12352 | 2 |
| D | 0 | 14304 | 2 |
| Quadrant | Total seconds | Saturated seconds | Saturation percentage |
|---|---|---|---|
| A | 5006 | 10 | 0.199760% |
| B | 5006 | 19 | 0.379545% |
| C | 5006 | 284 | 5.673192% |
| D | 5006 | 215 | 4.294846% |
Noise dominated data is calculated using 1-second bins in cleaned event files. If a bin has >2000 counts, and if more than 50% of those come from <1% of pixels, then it is considered to be noise-dominated and hence unusable.
| Quadrant | # 1 sec bins | Bins with >0 counts | Bins with >2000 counts | High rate bins dominated by noise | Noise dominated (total time) | Noise dominated (detector-on time) | Marked lightcurve |
|---|---|---|---|---|---|---|---|
| A | 8983 | 5008 | 7 | 7 | 0.08% | 0.14% | 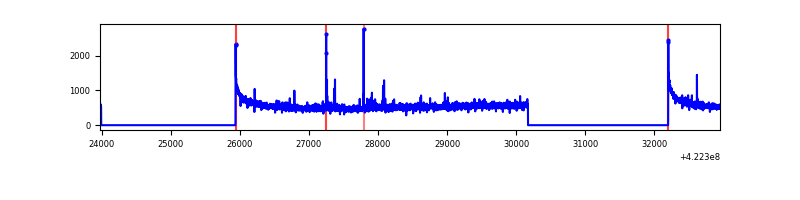 |
| B | 8983 | 5008 | 14 | 14 | 0.16% | 0.28% | 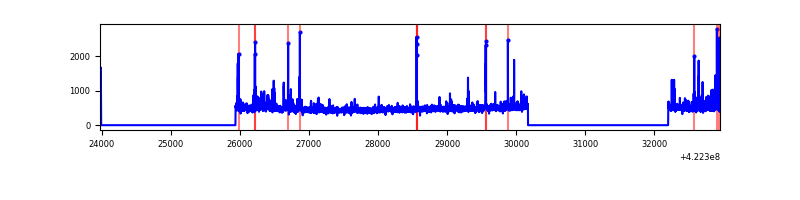 |
| C | 8983 | 5008 | 280 | 280 | 3.12% | 5.59% | 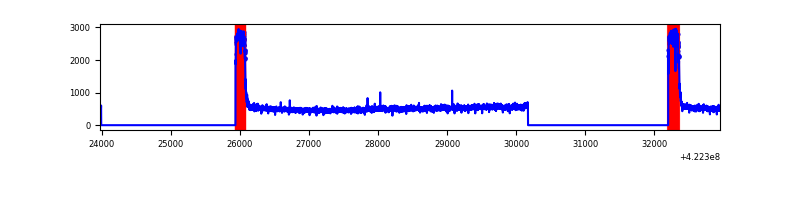 |
| D | 8983 | 5008 | 212 | 212 | 2.36% | 4.23% | 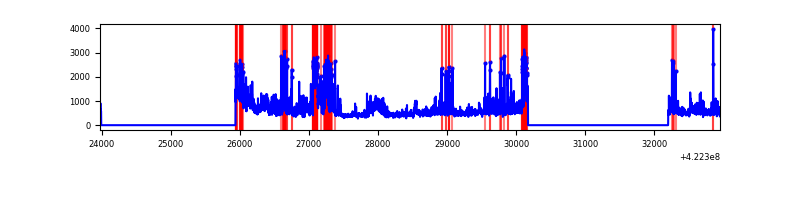 |
Top three noisy pixels from each quadrant. If the there are fewer than three noisy pixels in the level2.evt file, extra rows are filled as -1
| Pixel properties | Quadrant properties | ||||||
|---|---|---|---|---|---|---|---|
| Quadrant | DetID | PixID | Counts | Sigma | Mean | Median | Sigma |
| A | 10 | 83 | 493248 | 4125.17 | 581 | 571 | 119.4 |
| A | 2 | 79 | 54544 | 451.91 | 581 | 571 | 119.4 |
| A | 3 | 137 | 6496 | 49.61 | 581 | 571 | 119.4 |
| B | 5 | 255 | 140115 | 1252.26 | 578 | 563 | 111.4 |
| B | 0 | 190 | 94835 | 845.94 | 578 | 563 | 111.4 |
| B | 0 | 229 | 15614 | 135.06 | 578 | 563 | 111.4 |
| C | 0 | 10 | 890575 | 7008.0 | 540 | 543 | 127.0 |
| C | 15 | 214 | 207059 | 1626.08 | 540 | 543 | 127.0 |
| C | 13 | 61 | 3669 | 24.61 | 540 | 543 | 127.0 |
| D | 2 | 120 | 511772 | 3732.77 | 551 | 536 | 137.0 |
| D | 1 | 52 | 487022 | 3552.06 | 551 | 536 | 137.0 |
| D | 13 | 249 | 273937 | 1996.23 | 551 | 536 | 137.0 |
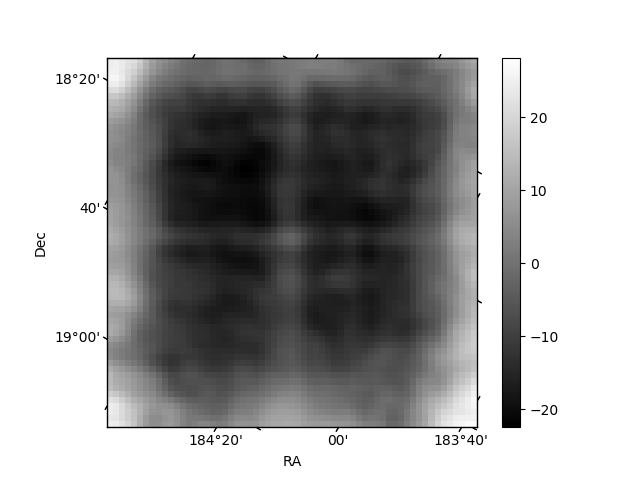
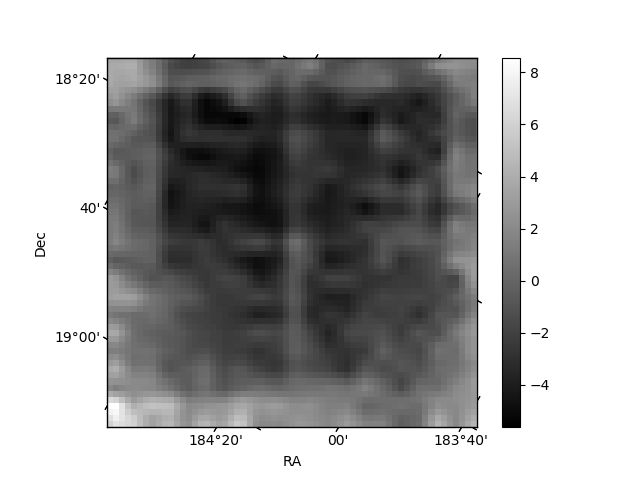
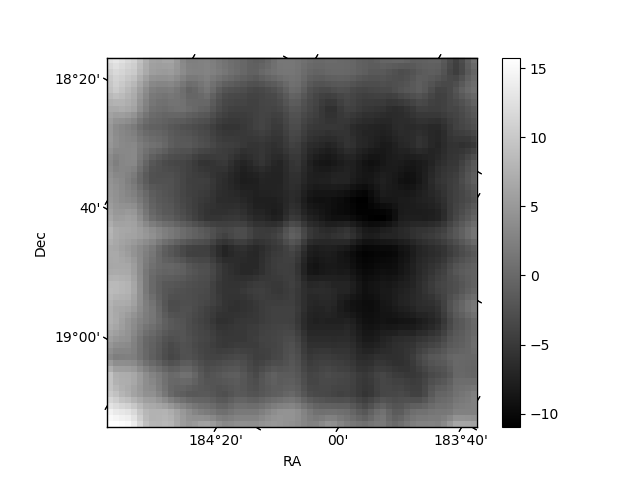
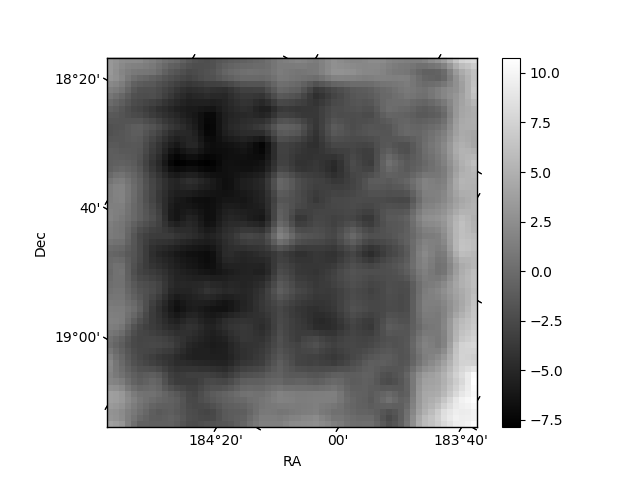
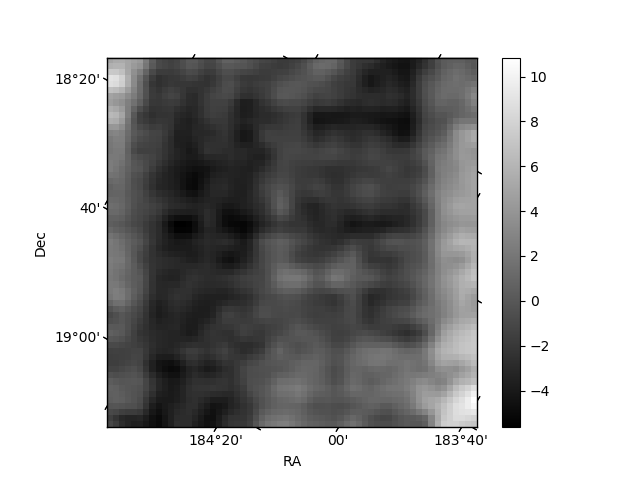
Histogram calculated using DETX and DETY for each event in the final _common_clean file
| Quadrant A | 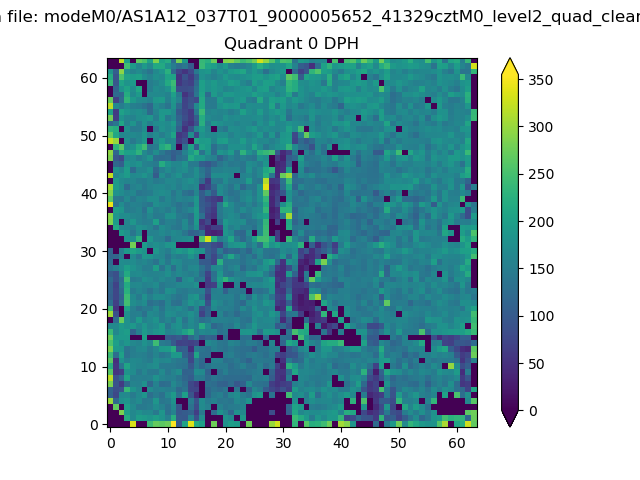 |
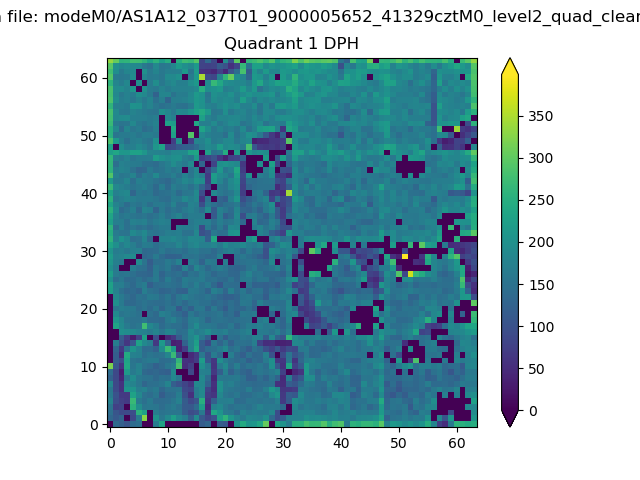 |
Quadrant B |
|---|---|---|---|
| Quadrant D | 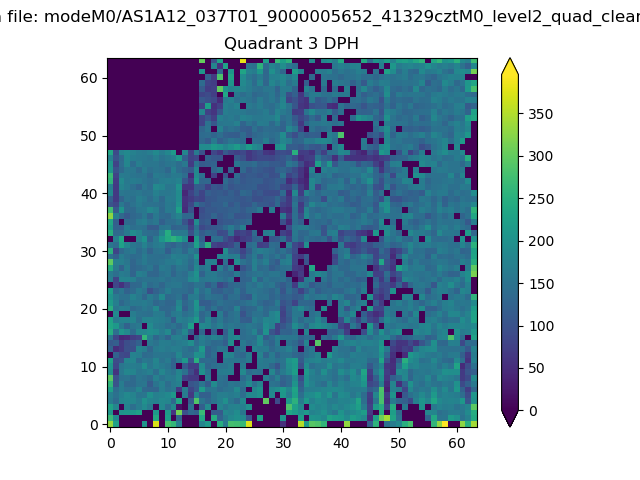 |
 |
Quadrant C |
| Plot type | Count rate plots | Images |
|---|---|---|
| Comparison with Poisson distribution Blue bars denote a histogram of data divided into 1 sec bins. Red curve is a Poisson curve with rate = median count rate of data. |
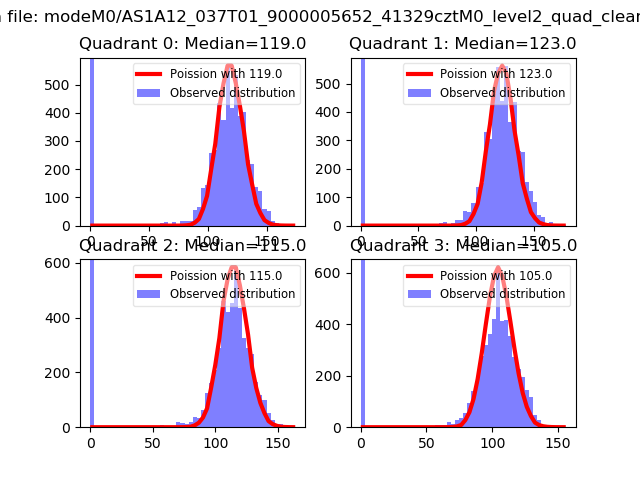 |
 |
| Quadrant-wise count rates Data is divided into 100 sec bins |
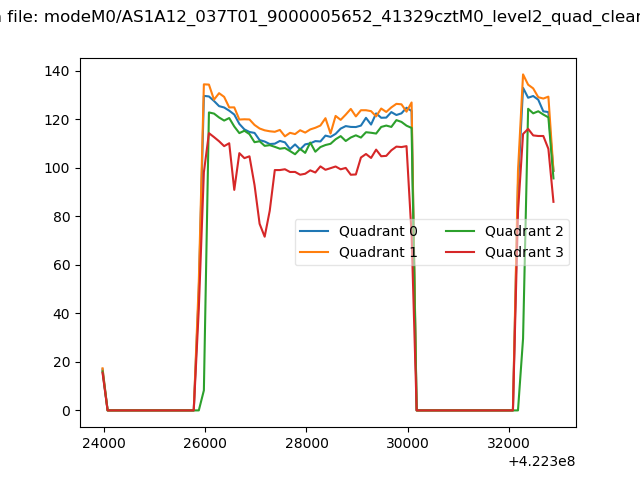 |
|
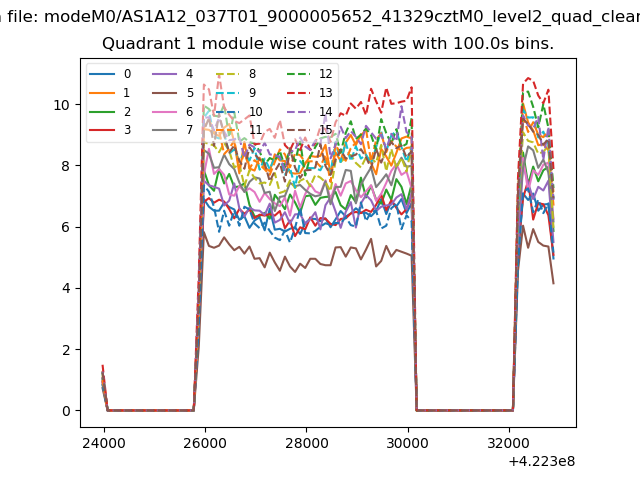
| Module-wise count rates for Quadrant A Data is divided into 100 sec bins |
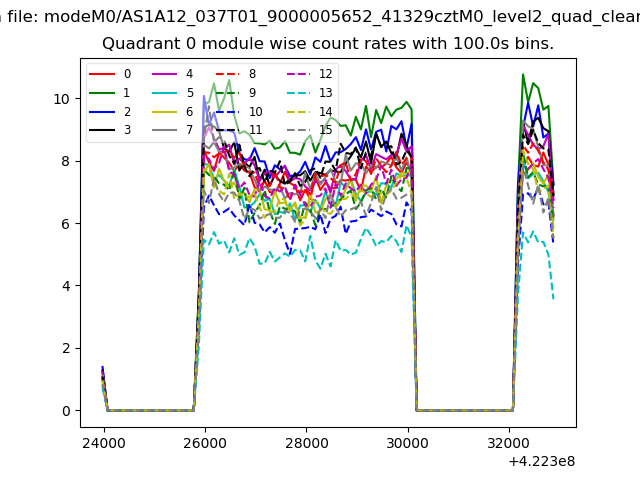 |
 |
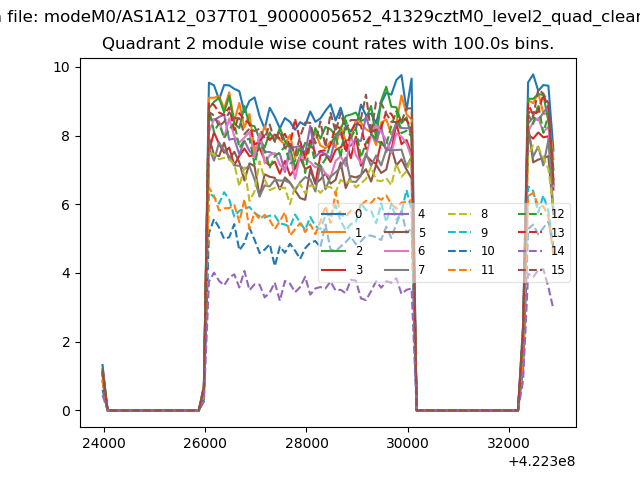
| Module-wise count rates for Quadrant B Data is divided into 100 sec bins |
 |
 |
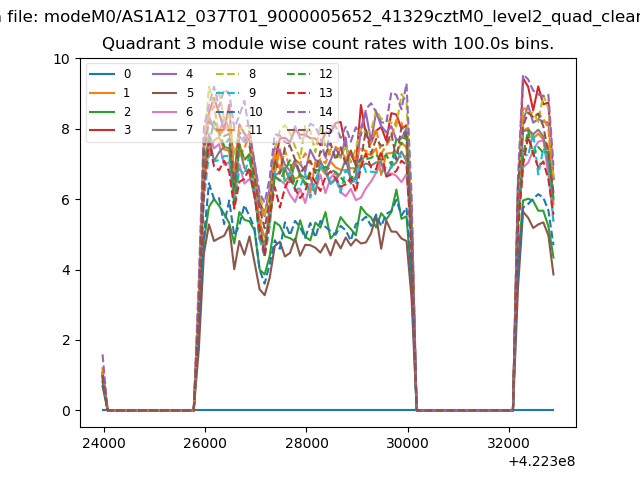
| Module-wise count rates for Quadrant C Data is divided into 100 sec bins |
 |
 |
| Module-wise count rates for Quadrant D Data is divided into 100 sec bins |
 |
 |
| Parameter | Plot |
|---|---|
| CZT HV Monitor | 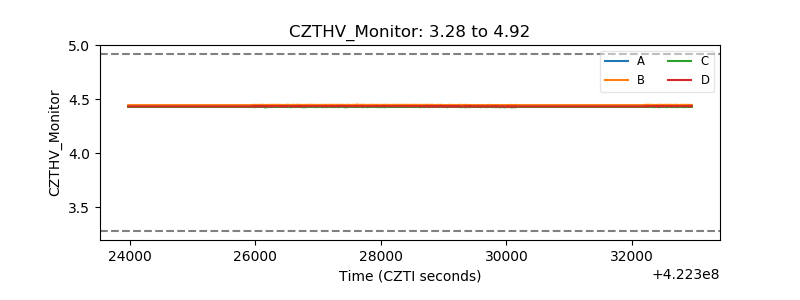 |
| D_VDD | 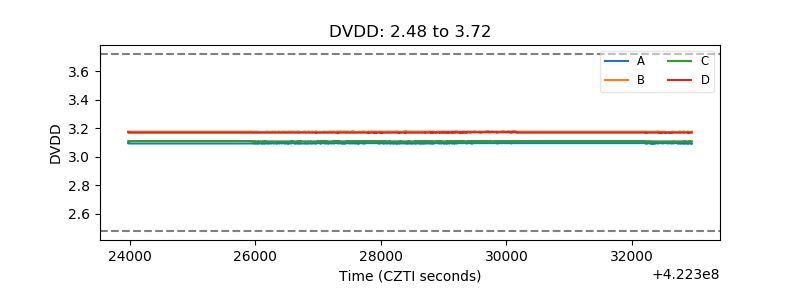 |
| Temperature 1 | 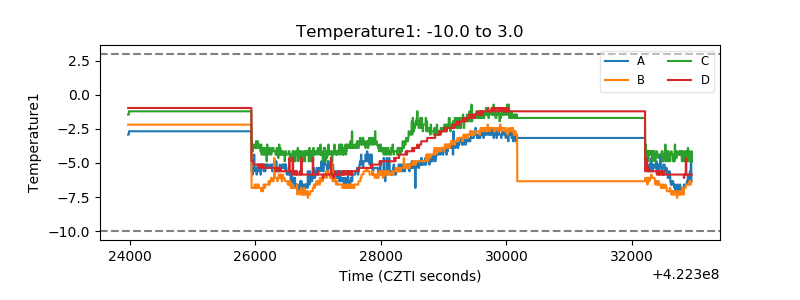 |
| Veto HV Monitor | 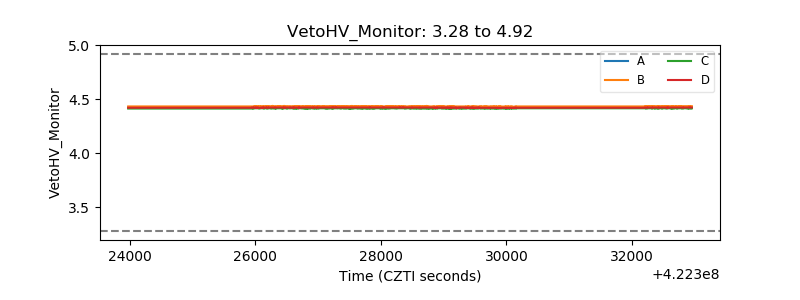 |
| Veto LLD | 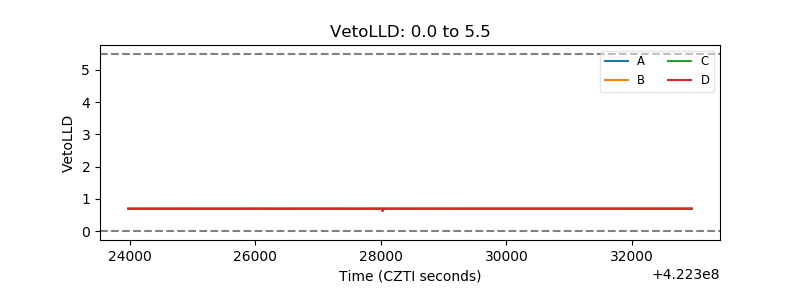 |
| Alpha Counter | 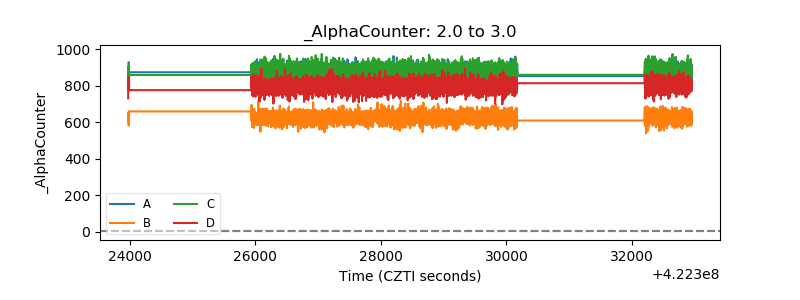 |
| _CPM_Rate | 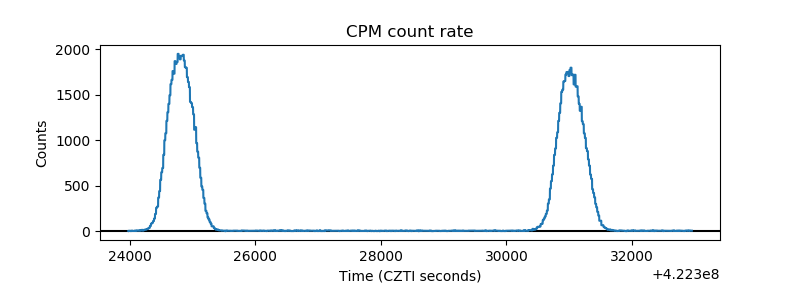 |
| CZT Counter | 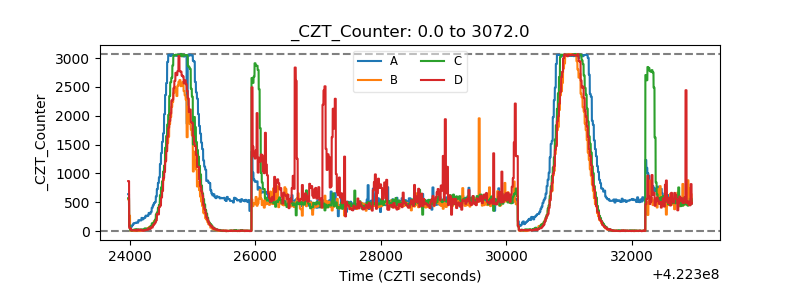 |
| +2.5 Volts monitor | 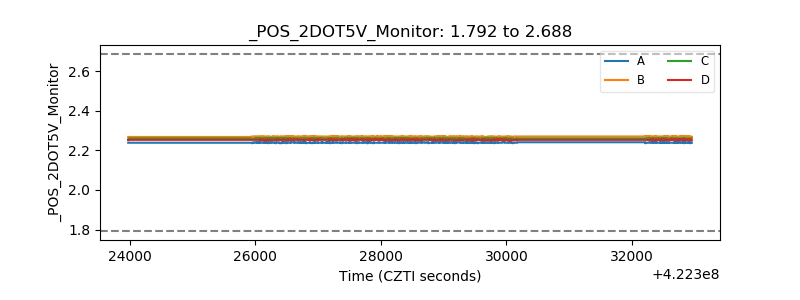 |
| +5 Volts monitor | 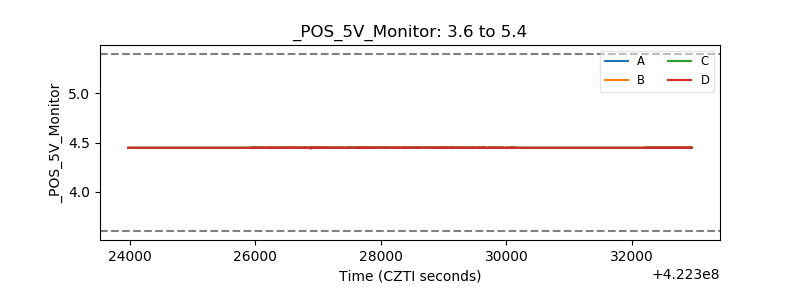 |
| _ROLL_ROT | 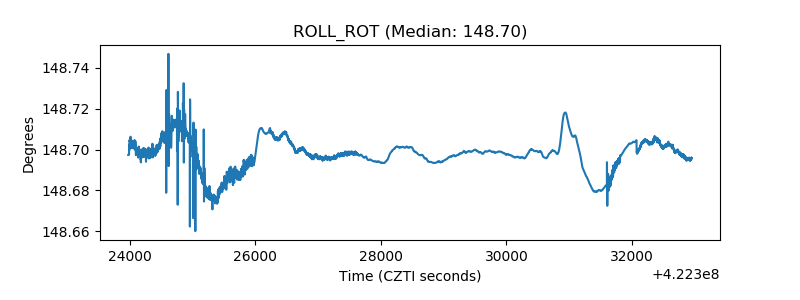 |
| _Roll_DEC | 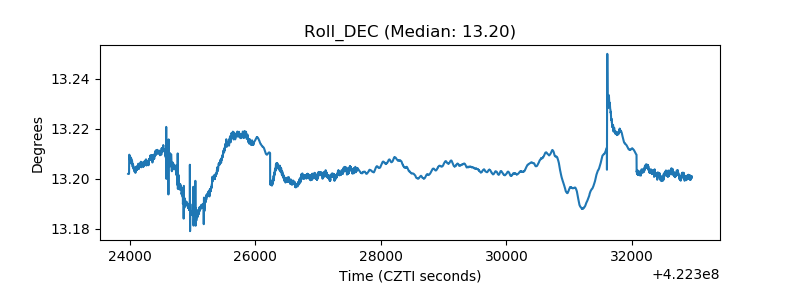 |
| _Roll_RA | 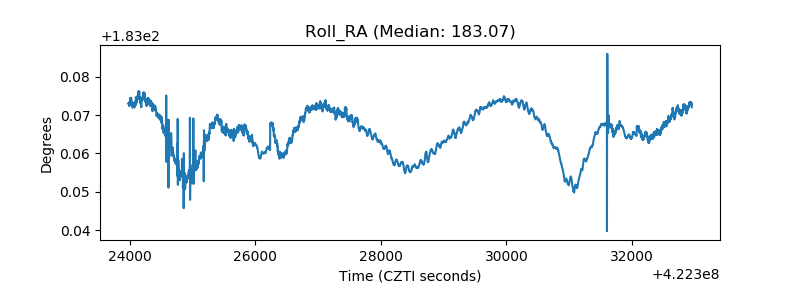 |
| Veto Counter | 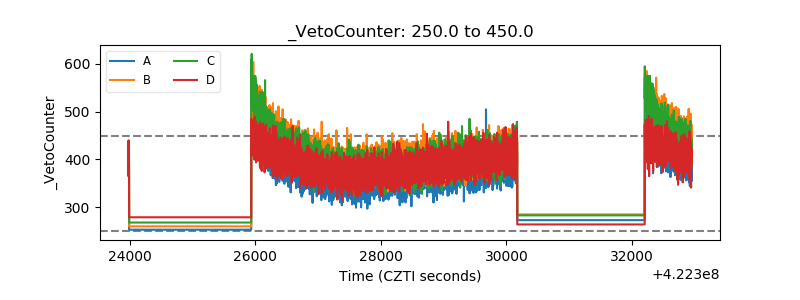 |