| Param | Original file | Final file |
|---|---|---|
| Filename | modeM0/AS1A12_037T01_9000005652_41330cztM0_level2.fits | modeM0/AS1A12_037T01_9000005652_41330cztM0_level2_quad_clean.evt |
| Size (bytes) | 326,396,160 | 84,435,840 |
| Size | 311.3 MB | 80.5 MB |
| Events in quadrant A | 2,718,070 | 579,958 |
| Events in quadrant B | 2,810,427 | 602,005 |
| Events in quadrant C | 3,141,205 | 526,543 |
| Events in quadrant D | 3,033,608 | 507,126 |
| Mode SS | |||
|---|---|---|---|
| Quadrant | BADHDUFLAG | Total packets | Discarded packets |
| A | 0 | 100 | 0 |
| B | 0 | 100 | 0 |
| C | 0 | 100 | 0 |
| D | 0 | 100 | 0 |
| Mode M9 | |||
|---|---|---|---|
| Quadrant | BADHDUFLAG | Total packets | Discarded packets |
| A | 0 | 34 | 0 |
| B | 0 | 34 | 0 |
| C | 0 | 34 | 0 |
| D | 0 | 35 | 0 |
| Mode M0 | |||
|---|---|---|---|
| Quadrant | BADHDUFLAG | Total packets | Discarded packets |
| A | 0 | 10823 | 3 |
| B | 0 | 11423 | 2 |
| C | 0 | 12019 | 2 |
| D | 0 | 12235 | 2 |
| Quadrant | Total seconds | Saturated seconds | Saturation percentage |
|---|---|---|---|
| A | 4864 | 9 | 0.185033% |
| B | 4864 | 61 | 1.254112% |
| C | 4864 | 296 | 6.085526% |
| D | 4864 | 108 | 2.220395% |
Noise dominated data is calculated using 1-second bins in cleaned event files. If a bin has >2000 counts, and if more than 50% of those come from <1% of pixels, then it is considered to be noise-dominated and hence unusable.
| Quadrant | # 1 sec bins | Bins with >0 counts | Bins with >2000 counts | High rate bins dominated by noise | Noise dominated (total time) | Noise dominated (detector-on time) | Marked lightcurve |
|---|---|---|---|---|---|---|---|
| A | 6986 | 4865 | 4 | 4 | 0.06% | 0.08% | 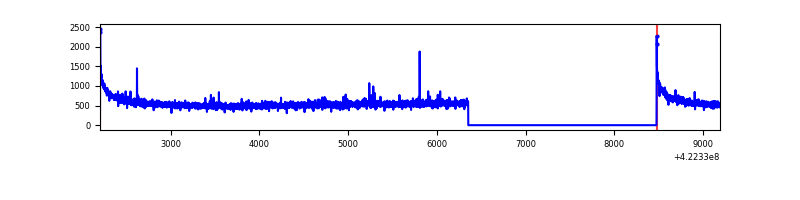 |
| B | 6986 | 4865 | 41 | 41 | 0.59% | 0.84% | 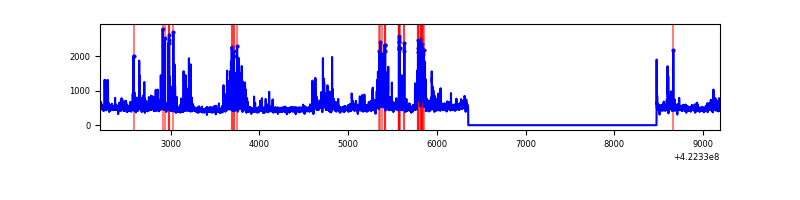 |
| C | 6986 | 4865 | 294 | 294 | 4.21% | 6.04% | 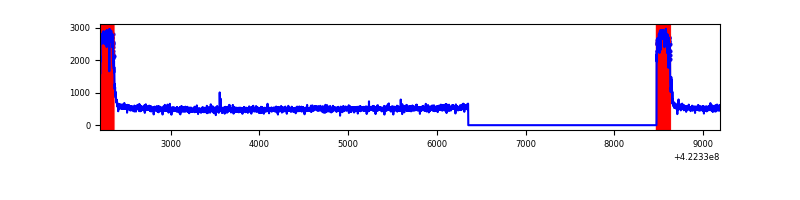 |
| D | 6986 | 4865 | 105 | 105 | 1.50% | 2.16% | 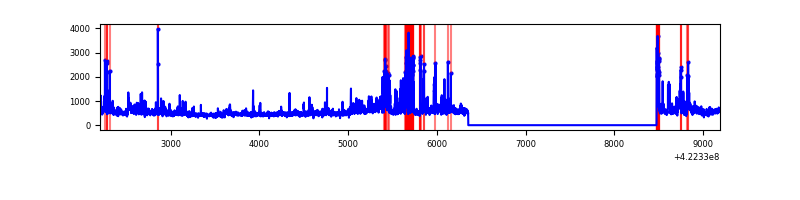 |
Top three noisy pixels from each quadrant. If the there are fewer than three noisy pixels in the level2.evt file, extra rows are filled as -1
| Pixel properties | Quadrant properties | ||||||
|---|---|---|---|---|---|---|---|
| Quadrant | DetID | PixID | Counts | Sigma | Mean | Median | Sigma |
| A | 10 | 83 | 493548 | 4234.23 | 567 | 556 | 116.4 |
| A | 2 | 79 | 22254 | 186.36 | 567 | 556 | 116.4 |
| A | 13 | 6 | 6412 | 50.3 | 567 | 556 | 116.4 |
| B | 5 | 255 | 494857 | 4567.15 | 565 | 551 | 108.2 |
| B | 0 | 190 | 80838 | 741.81 | 565 | 551 | 108.2 |
| B | 12 | 111 | 13849 | 122.86 | 565 | 551 | 108.2 |
| C | 0 | 10 | 886909 | 7184.9 | 525 | 528 | 123.4 |
| C | 15 | 214 | 203242 | 1643.18 | 525 | 528 | 123.4 |
| C | 15 | 159 | 5381 | 39.34 | 525 | 528 | 123.4 |
| D | 1 | 52 | 531075 | 3981.18 | 540 | 526 | 133.3 |
| D | 1 | 47 | 268310 | 2009.42 | 540 | 526 | 133.3 |
| D | 2 | 249 | 36943 | 273.27 | 540 | 526 | 133.3 |
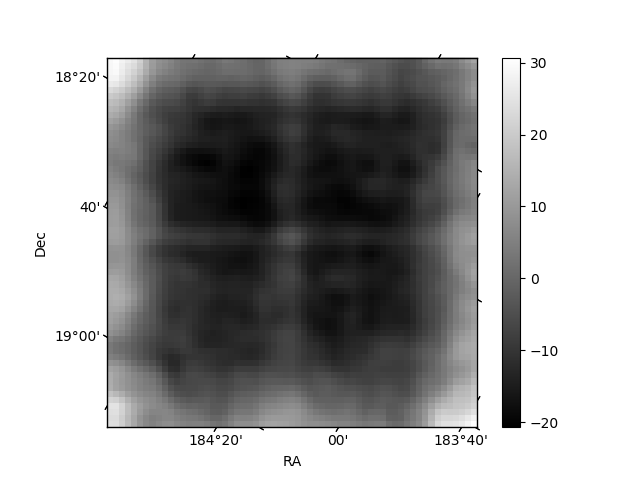
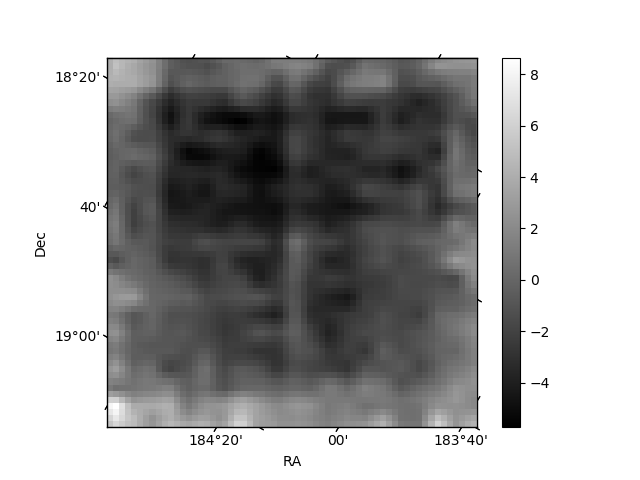
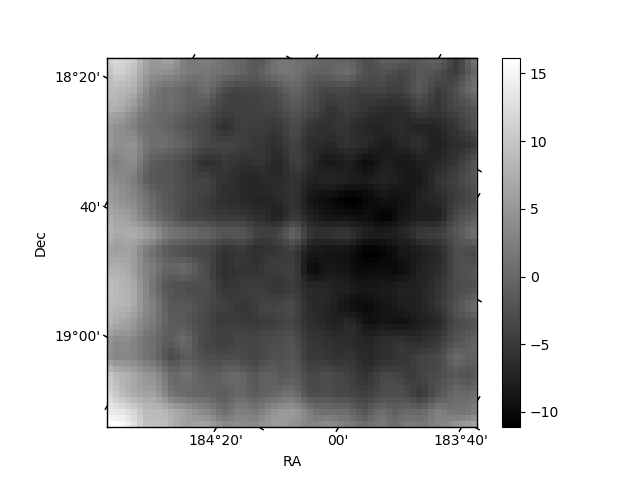
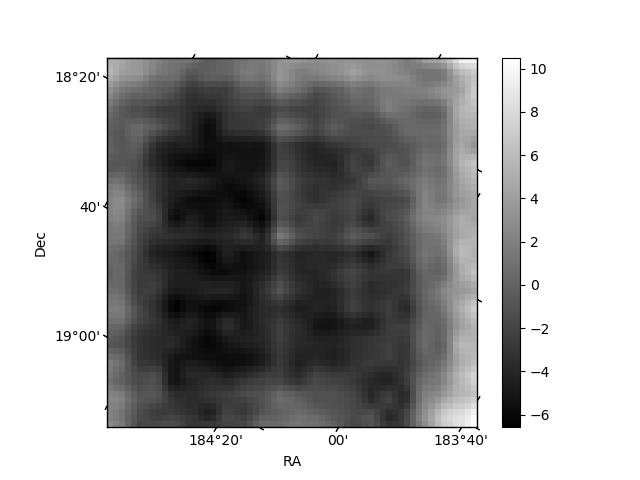
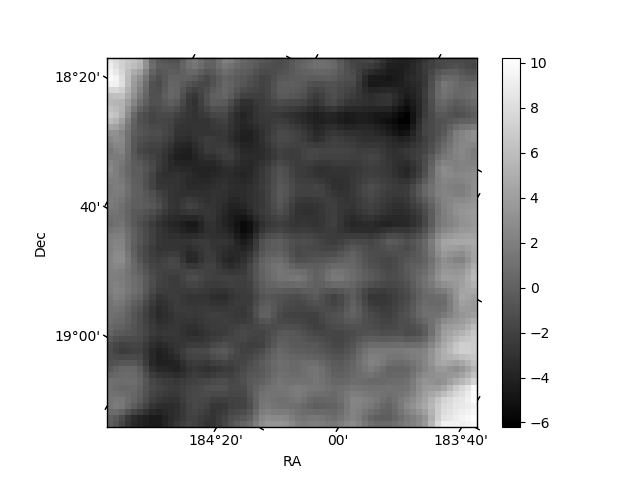
Histogram calculated using DETX and DETY for each event in the final _common_clean file
| Quadrant A | 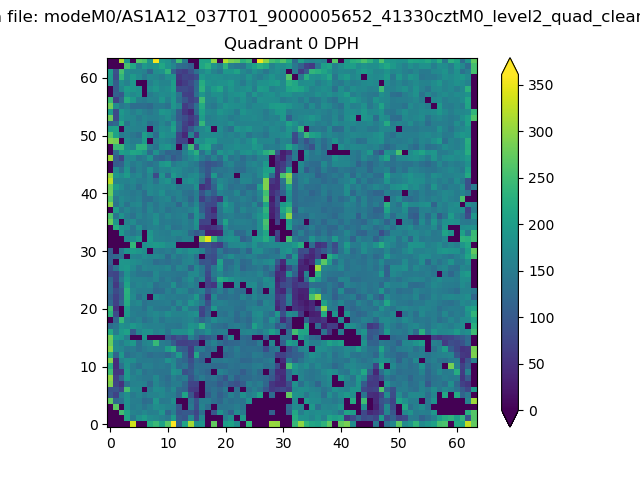 |
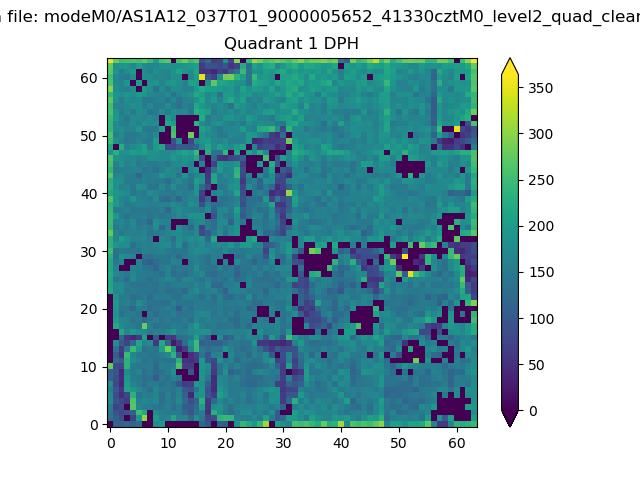 |
Quadrant B |
|---|---|---|---|
| Quadrant D | 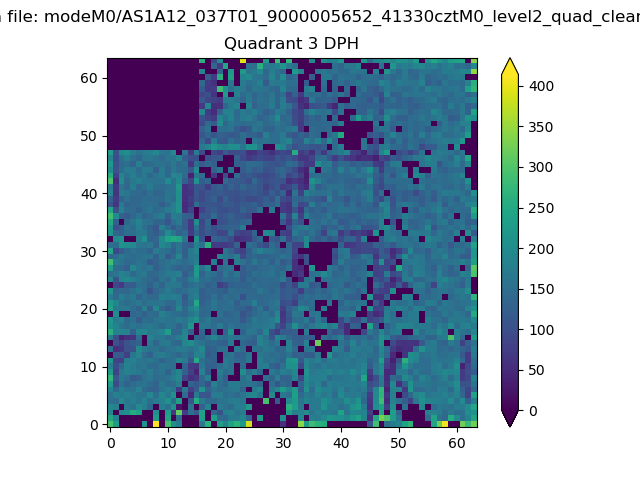 |
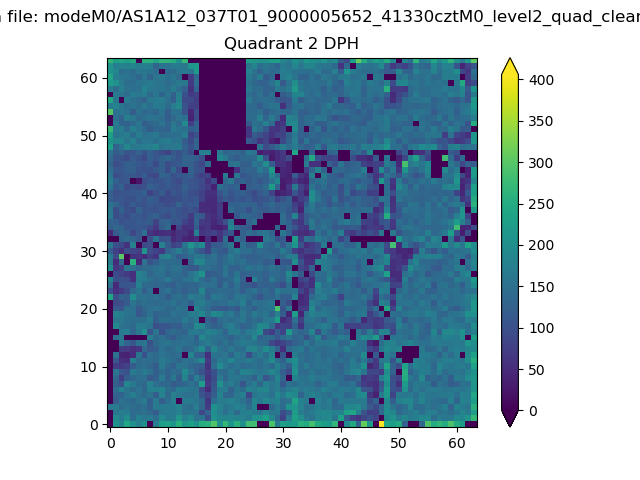 |
Quadrant C |
| Plot type | Count rate plots | Images |
|---|---|---|
| Comparison with Poisson distribution Blue bars denote a histogram of data divided into 1 sec bins. Red curve is a Poisson curve with rate = median count rate of data. |
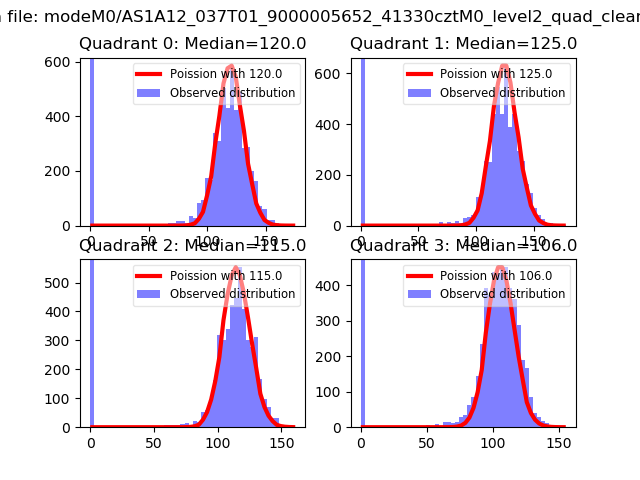 |
 |
| Quadrant-wise count rates Data is divided into 100 sec bins |
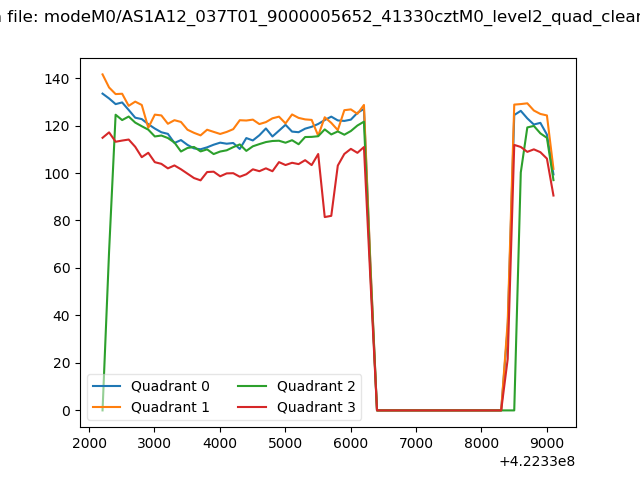 |
|
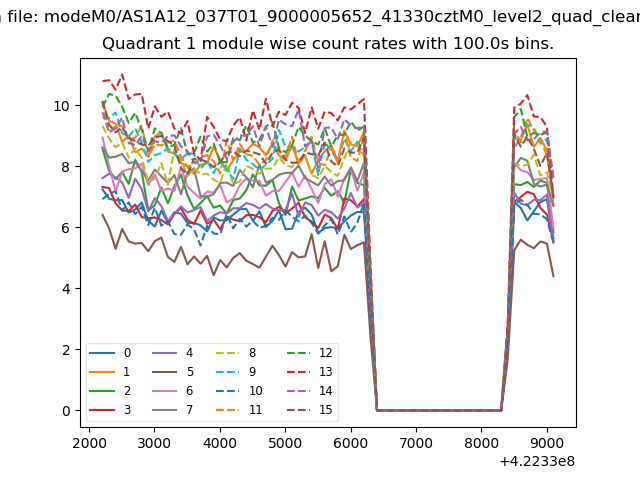
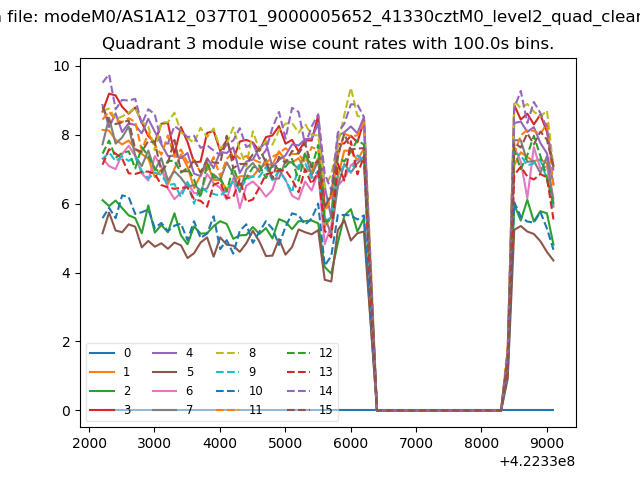
| Module-wise count rates for Quadrant A Data is divided into 100 sec bins |
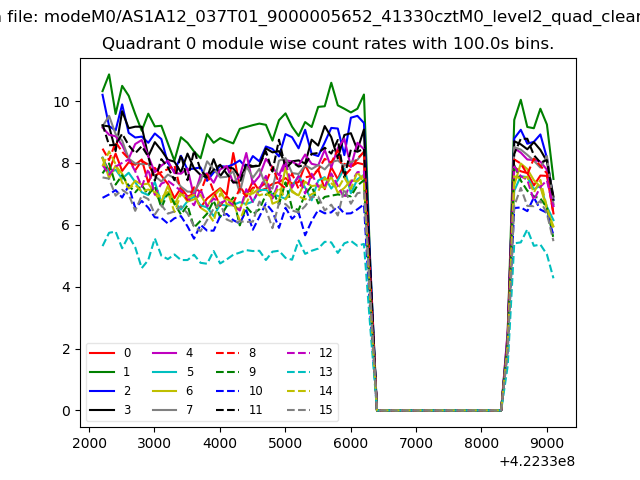 |
 |
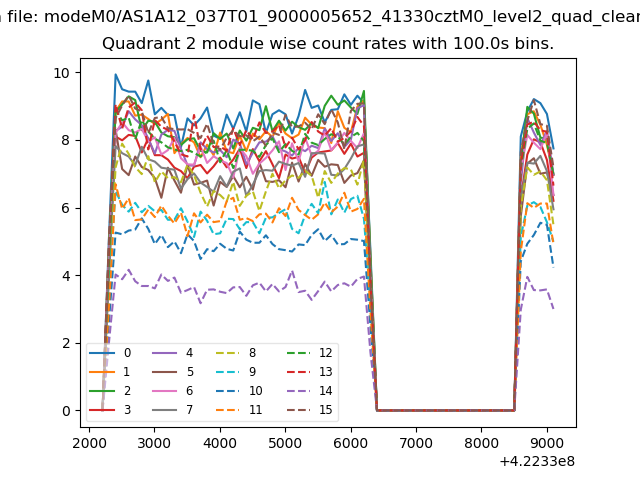
| Module-wise count rates for Quadrant B Data is divided into 100 sec bins |
 |
 |
| Module-wise count rates for Quadrant C Data is divided into 100 sec bins |
 |
 |
| Module-wise count rates for Quadrant D Data is divided into 100 sec bins |
 |
 |
| Parameter | Plot |
|---|---|
| CZT HV Monitor | 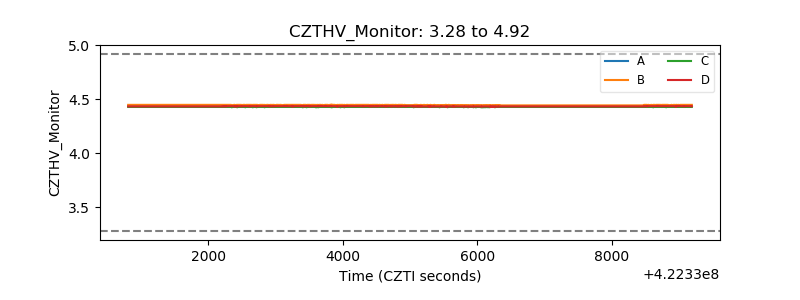 |
| D_VDD | 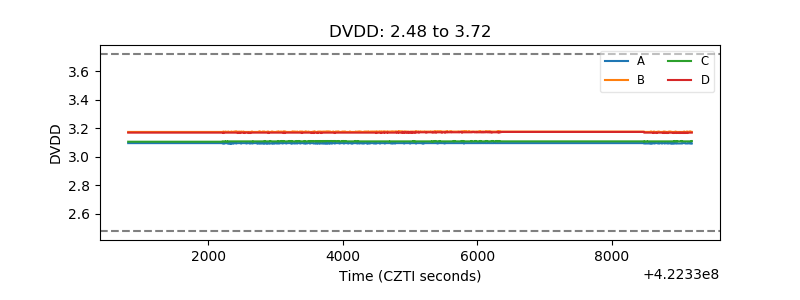 |
| Temperature 1 | 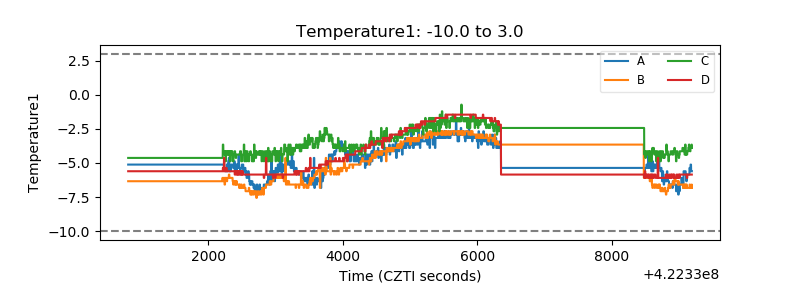 |
| Veto HV Monitor | 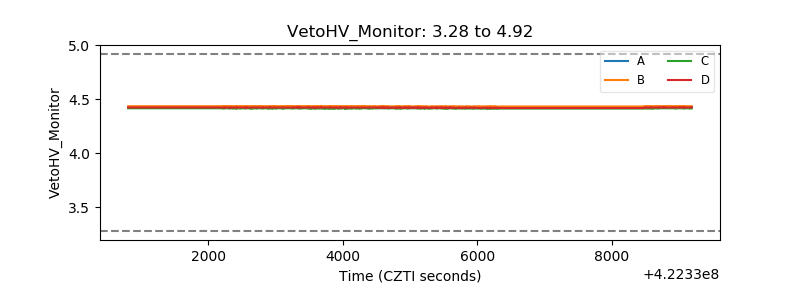 |
| Veto LLD | 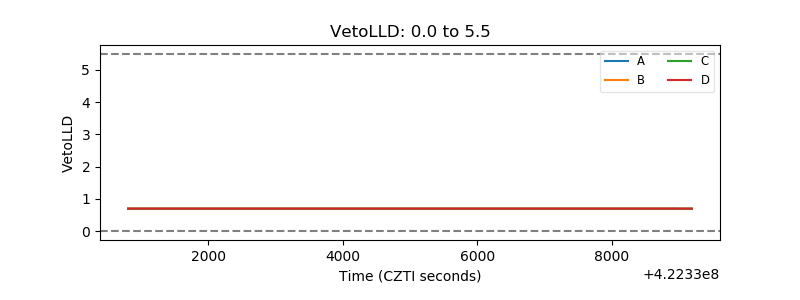 |
| Alpha Counter | 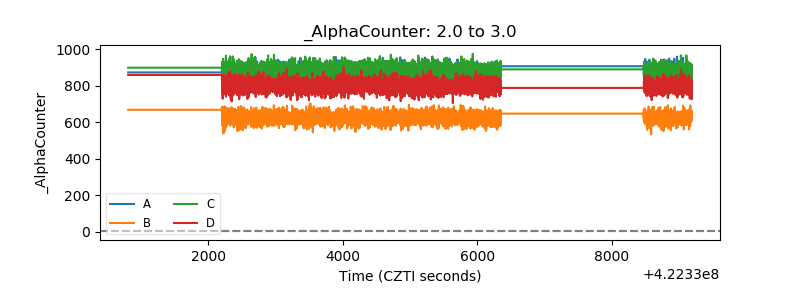 |
| _CPM_Rate |  |
| CZT Counter | 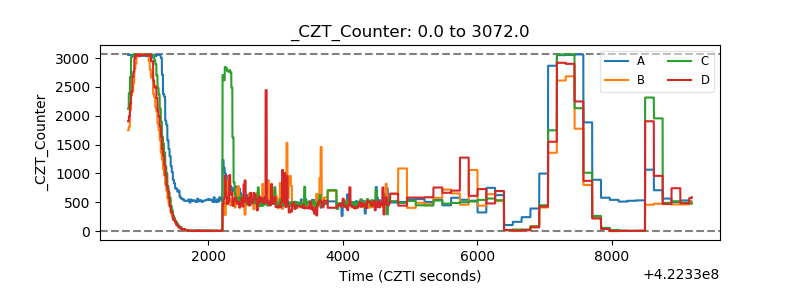 |
| +2.5 Volts monitor | 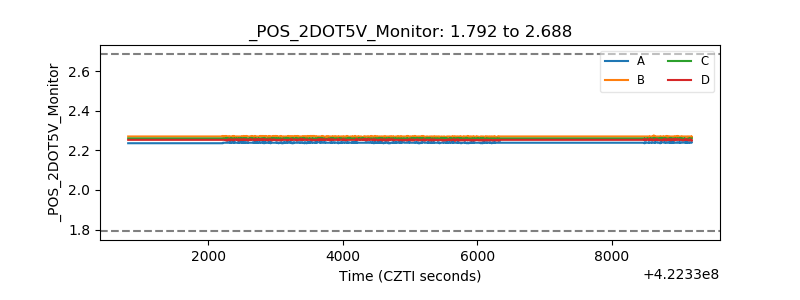 |
| +5 Volts monitor | 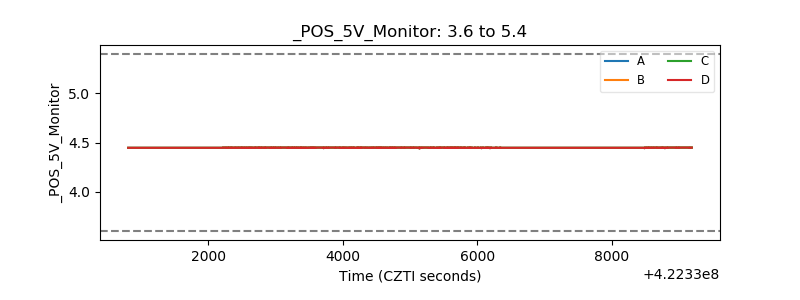 |
| _ROLL_ROT | 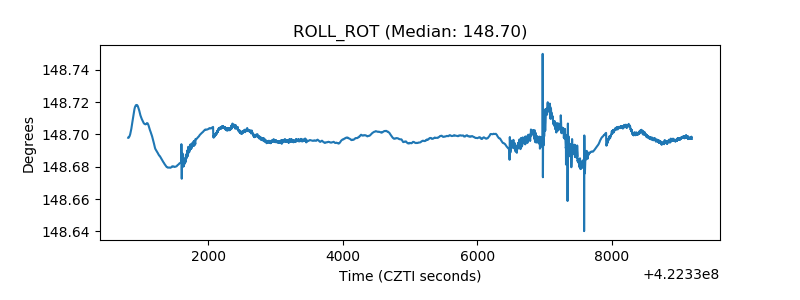 |
| _Roll_DEC | 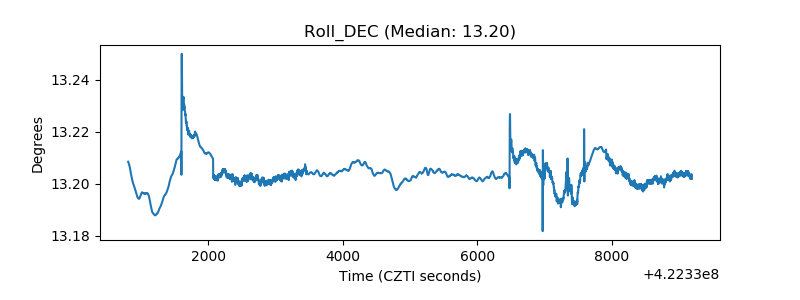 |
| _Roll_RA | 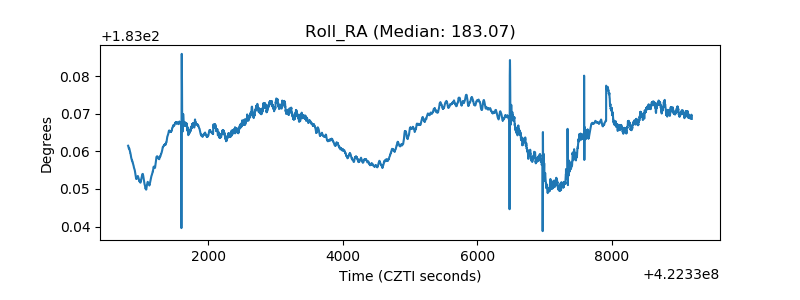 |
| Veto Counter | 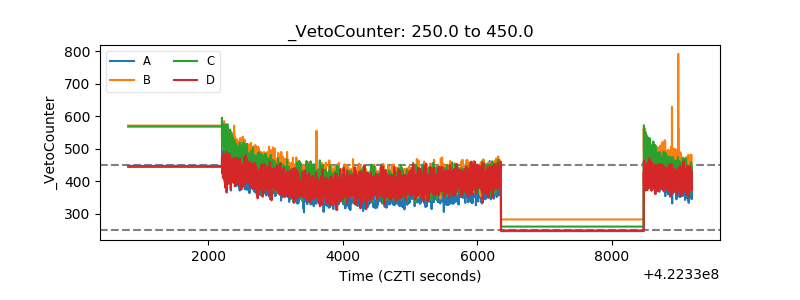 |