| Param | Original file | Final file |
|---|---|---|
| Filename | modeM0/AS1A12_037T01_9000005652_41331cztM0_level2.fits | modeM0/AS1A12_037T01_9000005652_41331cztM0_level2_quad_clean.evt |
| Size (bytes) | 351,109,440 | 87,148,800 |
| Size | 334.8 MB | 83.1 MB |
| Events in quadrant A | 2,802,246 | 596,951 |
| Events in quadrant B | 2,484,252 | 620,210 |
| Events in quadrant C | 3,225,298 | 547,493 |
| Events in quadrant D | 4,084,821 | 514,241 |
| Mode SS | |||
|---|---|---|---|
| Quadrant | BADHDUFLAG | Total packets | Discarded packets |
| A | 0 | 104 | 0 |
| B | 0 | 104 | 0 |
| C | 0 | 104 | 0 |
| D | 0 | 104 | 0 |
| Mode M9 | |||
|---|---|---|---|
| Quadrant | BADHDUFLAG | Total packets | Discarded packets |
| A | 0 | 33 | 0 |
| B | 0 | 33 | 0 |
| C | 0 | 33 | 0 |
| D | 0 | 34 | 0 |
| Mode M0 | |||
|---|---|---|---|
| Quadrant | BADHDUFLAG | Total packets | Discarded packets |
| A | 0 | 11219 | 3 |
| B | 0 | 10633 | 2 |
| C | 0 | 12422 | 2 |
| D | 0 | 15630 | 2 |
| Quadrant | Total seconds | Saturated seconds | Saturation percentage |
|---|---|---|---|
| A | 5142 | 9 | 0.175029% |
| B | 5142 | 9 | 0.175029% |
| C | 5142 | 278 | 5.406457% |
| D | 5142 | 228 | 4.434072% |
Noise dominated data is calculated using 1-second bins in cleaned event files. If a bin has >2000 counts, and if more than 50% of those come from <1% of pixels, then it is considered to be noise-dominated and hence unusable.
| Quadrant | # 1 sec bins | Bins with >0 counts | Bins with >2000 counts | High rate bins dominated by noise | Noise dominated (total time) | Noise dominated (detector-on time) | Marked lightcurve |
|---|---|---|---|---|---|---|---|
| A | 7294 | 5143 | 4 | 4 | 0.05% | 0.08% | 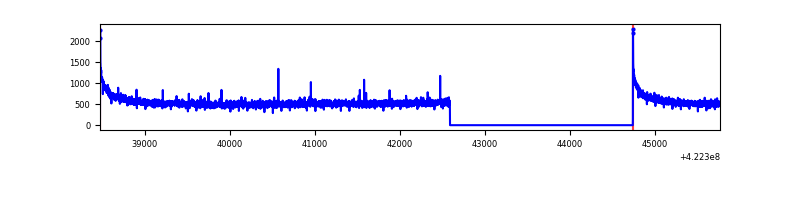 |
| B | 7294 | 5143 | 1 | 1 | 0.01% | 0.02% | 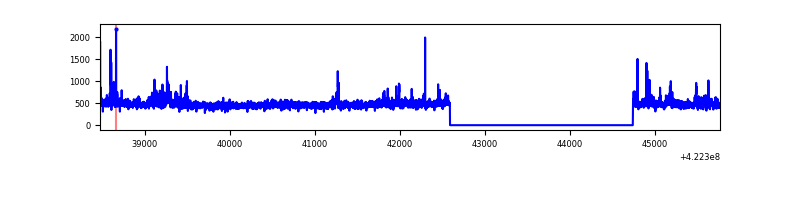 |
| C | 7294 | 5143 | 275 | 275 | 3.77% | 5.35% | 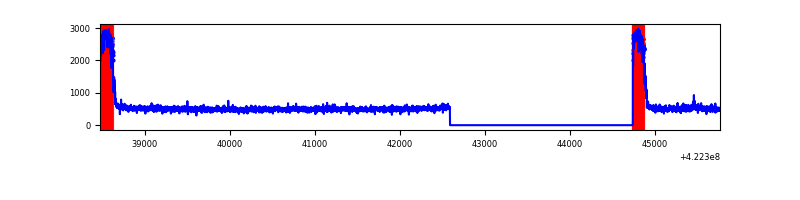 |
| D | 7294 | 5143 | 232 | 232 | 3.18% | 4.51% | 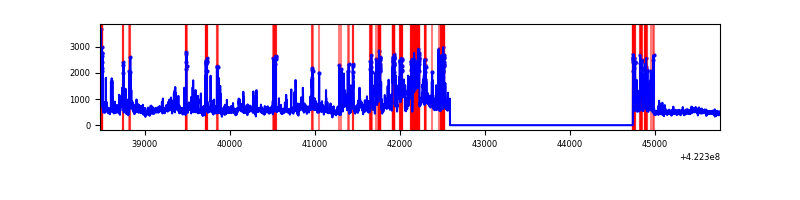 |
Top three noisy pixels from each quadrant. If the there are fewer than three noisy pixels in the level2.evt file, extra rows are filled as -1
| Pixel properties | Quadrant properties | ||||||
|---|---|---|---|---|---|---|---|
| Quadrant | DetID | PixID | Counts | Sigma | Mean | Median | Sigma |
| A | 10 | 83 | 493219 | 4060.73 | 593 | 583 | 121.3 |
| A | 2 | 79 | 15268 | 121.05 | 593 | 583 | 121.3 |
| A | 3 | 137 | 6542 | 49.12 | 593 | 583 | 121.3 |
| B | 5 | 255 | 72433 | 637.32 | 588 | 573 | 112.8 |
| B | 0 | 190 | 69205 | 608.69 | 588 | 573 | 112.8 |
| B | 12 | 111 | 14843 | 126.56 | 588 | 573 | 112.8 |
| C | 0 | 10 | 840096 | 6512.53 | 551 | 555 | 128.9 |
| C | 15 | 214 | 215305 | 1665.87 | 551 | 555 | 128.9 |
| C | 9 | 54 | 22898 | 173.32 | 551 | 555 | 128.9 |
| D | 1 | 52 | 1280888 | 9179.32 | 563 | 547 | 139.5 |
| D | 5 | 222 | 222558 | 1591.69 | 563 | 547 | 139.5 |
| D | 13 | 249 | 172477 | 1232.64 | 563 | 547 | 139.5 |
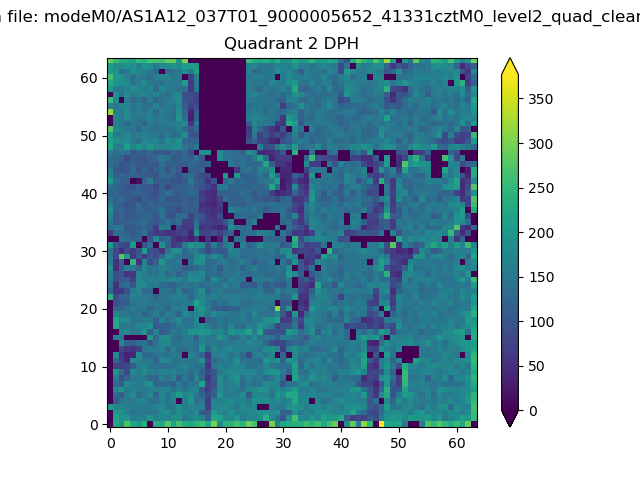
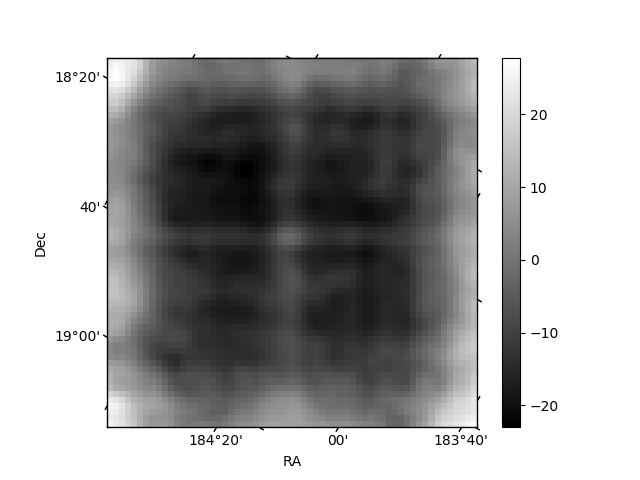
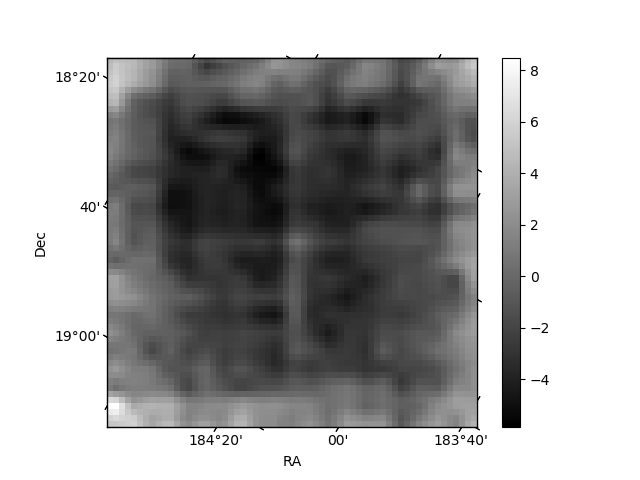
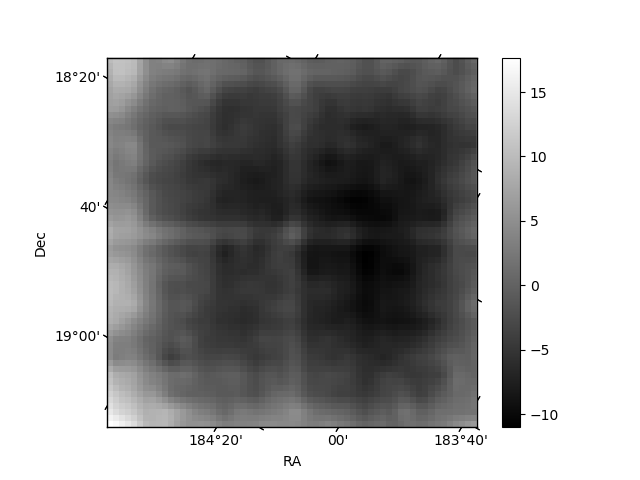
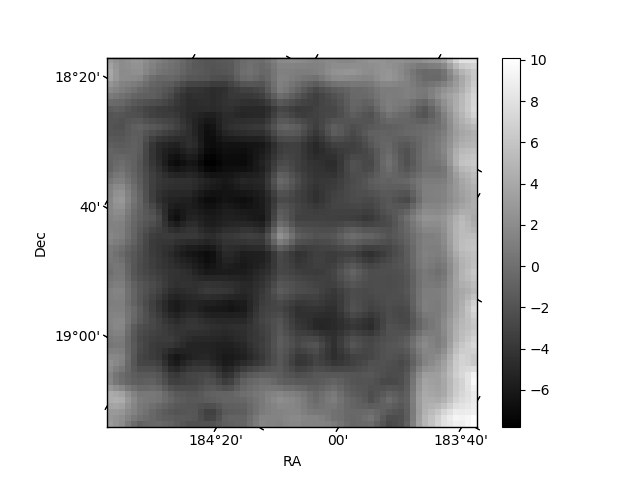
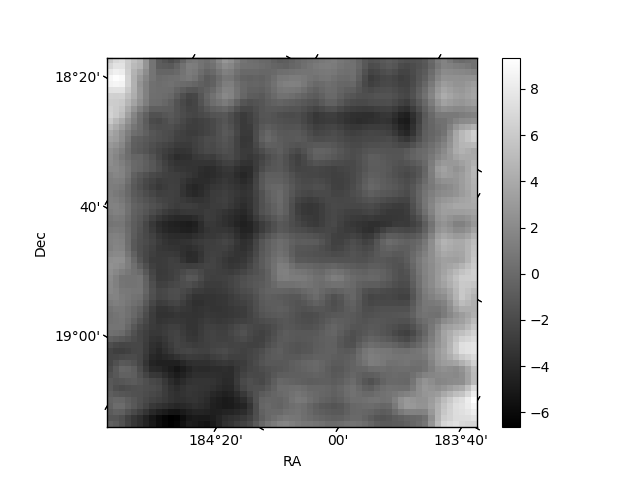
Histogram calculated using DETX and DETY for each event in the final _common_clean file
| Quadrant A | 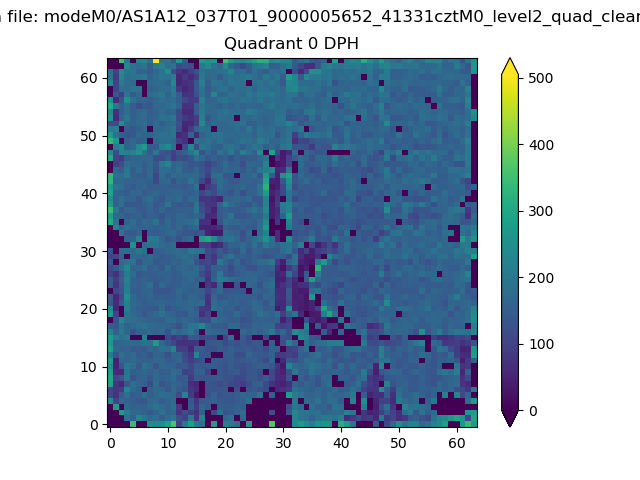 |
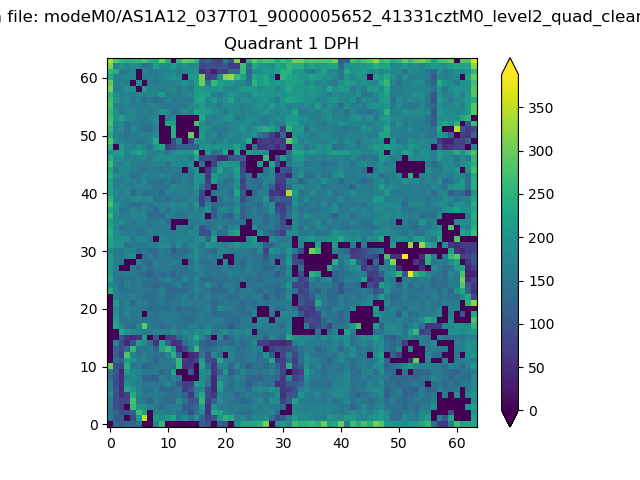 |
Quadrant B |
|---|---|---|---|
| Quadrant D | 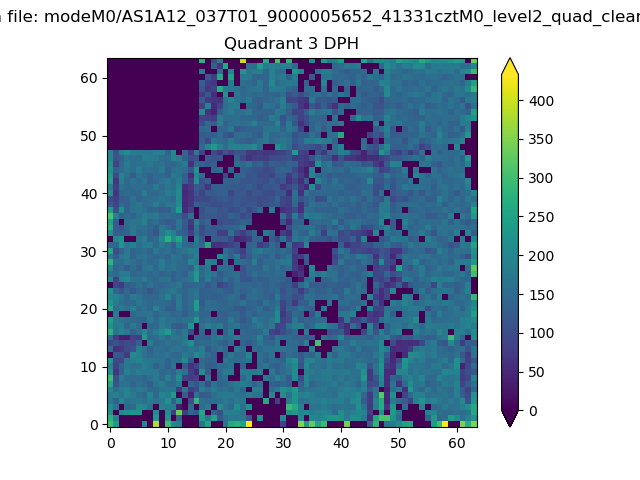 |
 |
Quadrant C |
| Plot type | Count rate plots | Images |
|---|---|---|
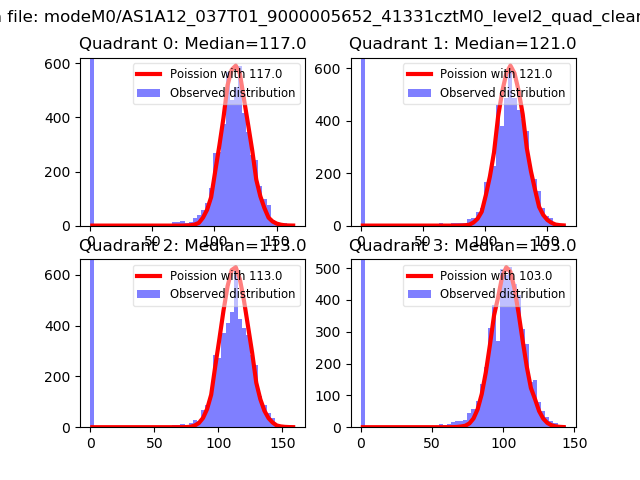
| Comparison with Poisson distribution Blue bars denote a histogram of data divided into 1 sec bins. Red curve is a Poisson curve with rate = median count rate of data. |
 |
 |
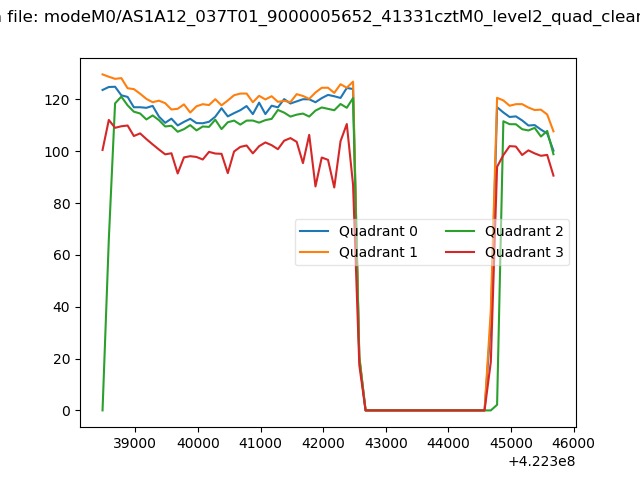
| Quadrant-wise count rates Data is divided into 100 sec bins |
 |
|
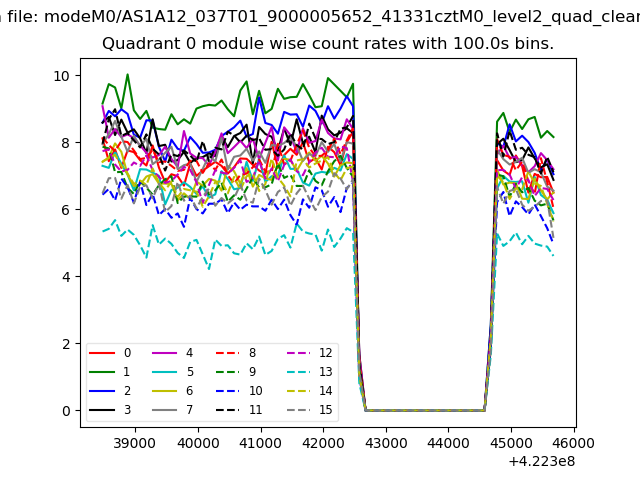
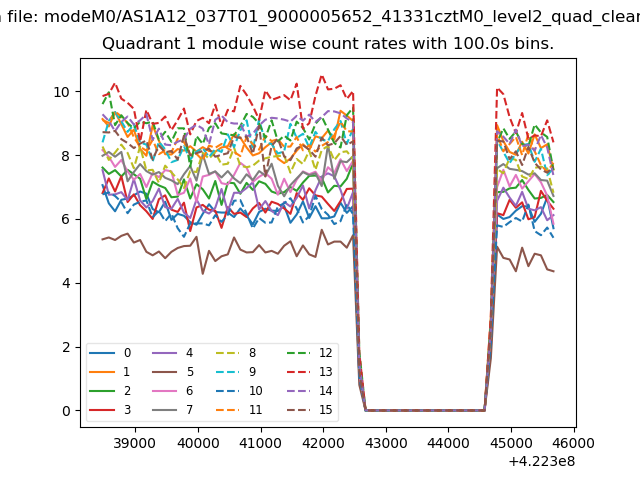
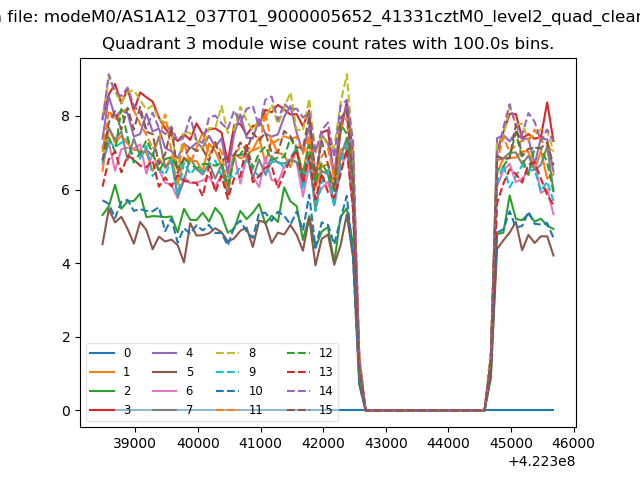
| Module-wise count rates for Quadrant A Data is divided into 100 sec bins |
 |
 |
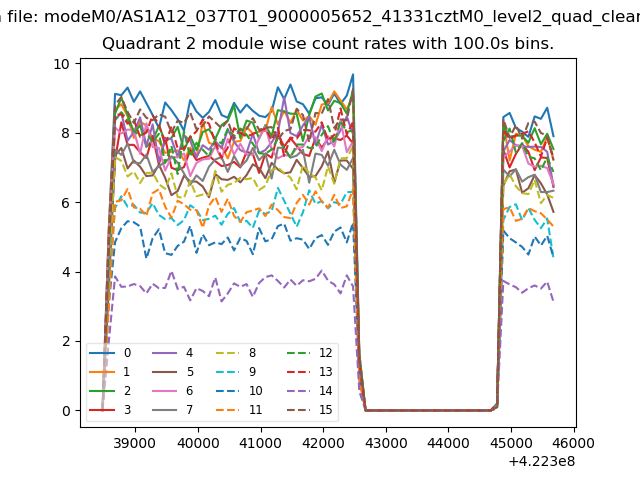
| Module-wise count rates for Quadrant B Data is divided into 100 sec bins |
 |
 |
| Module-wise count rates for Quadrant C Data is divided into 100 sec bins |
 |
 |
| Module-wise count rates for Quadrant D Data is divided into 100 sec bins |
 |
 |
| Parameter | Plot |
|---|---|
| CZT HV Monitor | 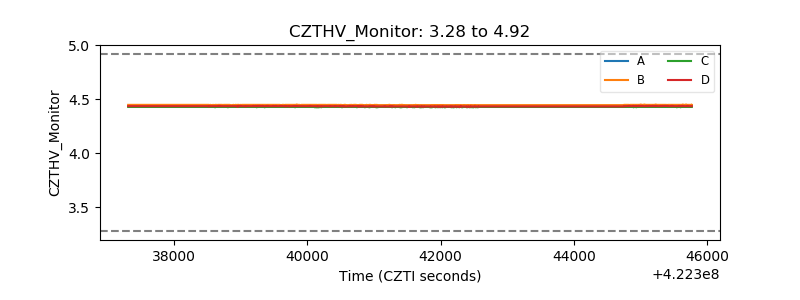 |
| D_VDD | 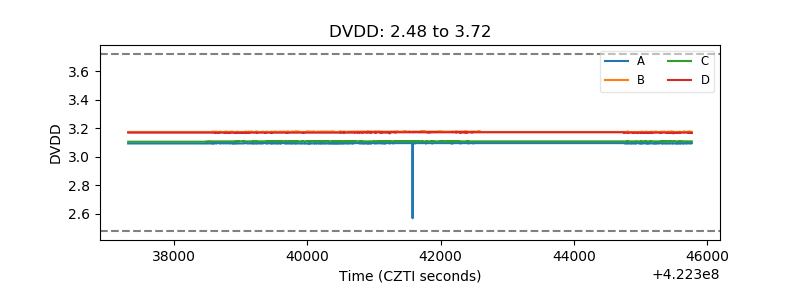 |
| Temperature 1 | 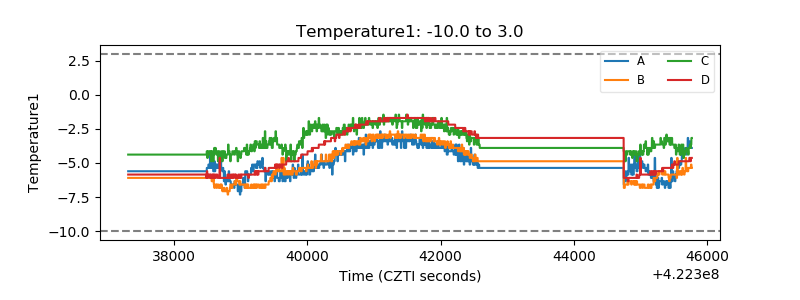 |
| Veto HV Monitor | 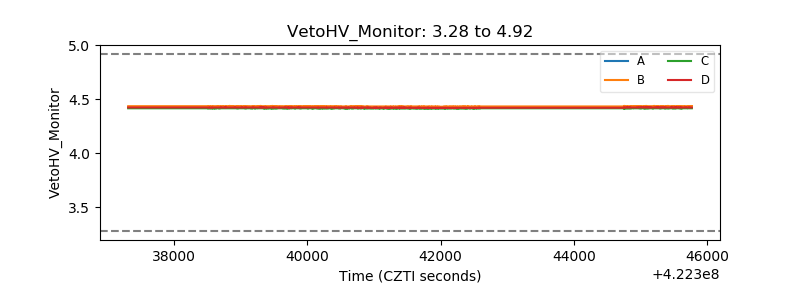 |
| Veto LLD | 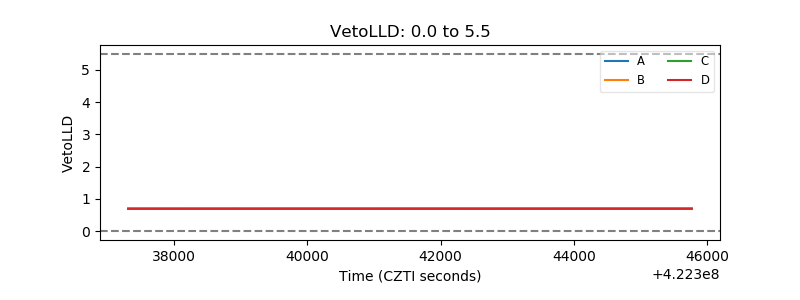 |
| Alpha Counter | 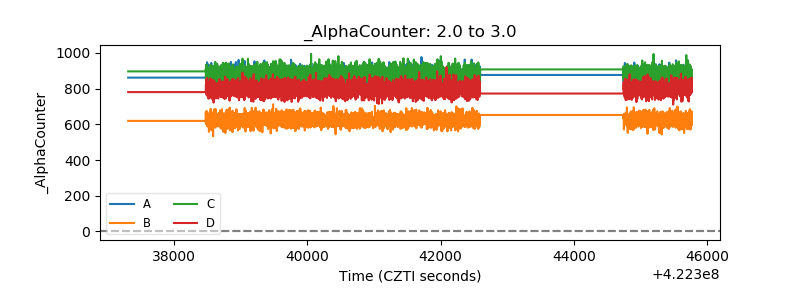 |
| _CPM_Rate | 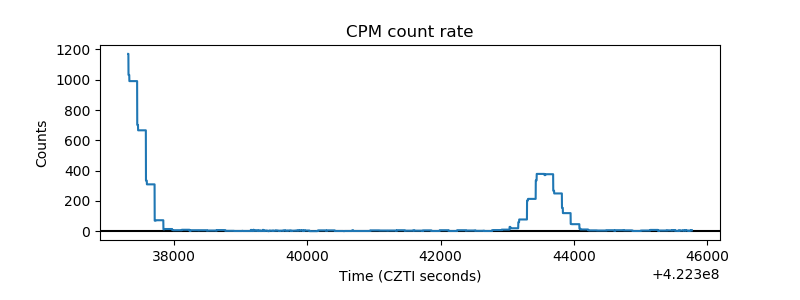 |
| CZT Counter | 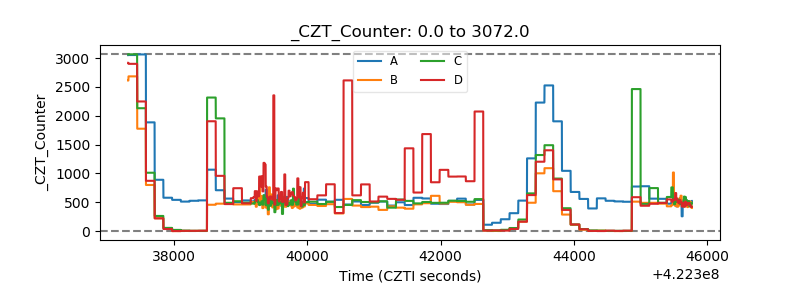 |
| +2.5 Volts monitor | 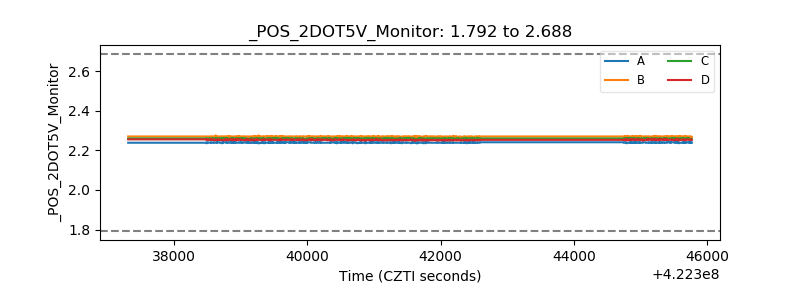 |
| +5 Volts monitor | 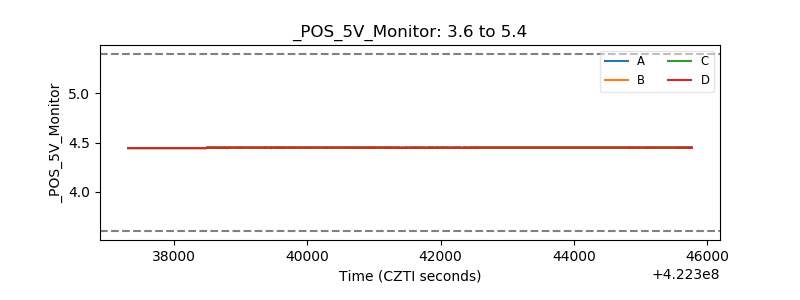 |
| _ROLL_ROT | 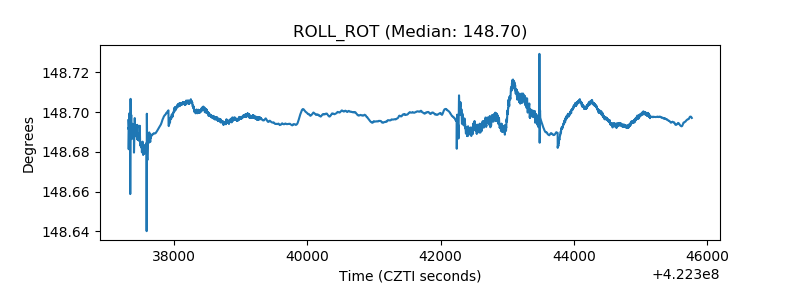 |
| _Roll_DEC | 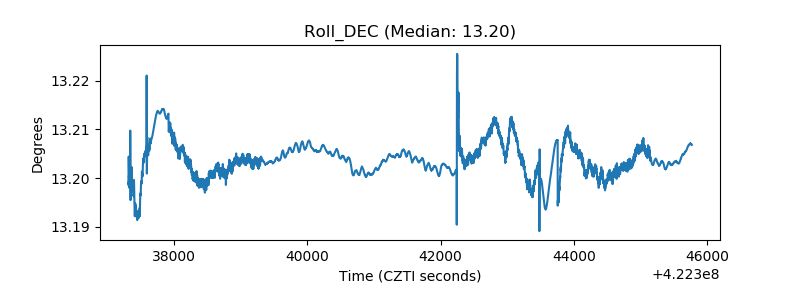 |
| _Roll_RA | 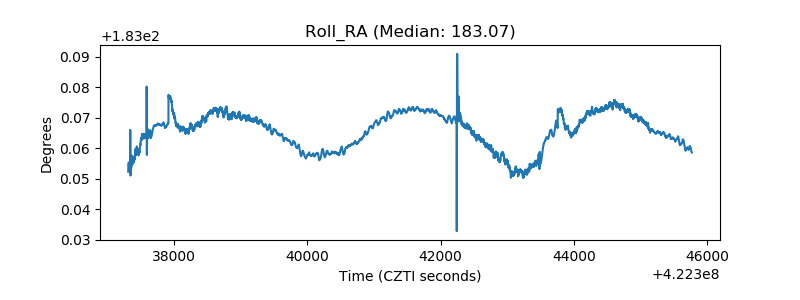 |
| Veto Counter | 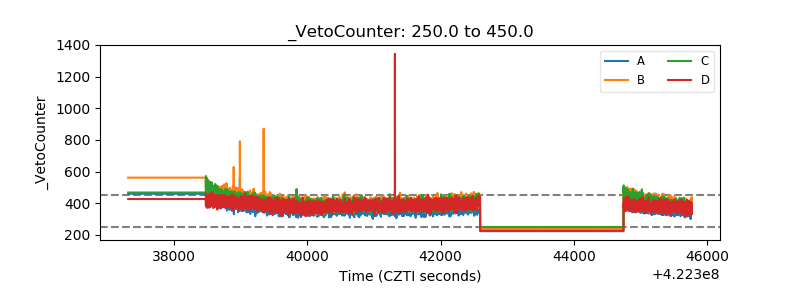 |