| Param | Original file | Final file |
|---|---|---|
| Filename | modeM0/AS1A12_037T01_9000005652_41332cztM0_level2.fits | modeM0/AS1A12_037T01_9000005652_41332cztM0_level2_quad_clean.evt |
| Size (bytes) | 350,199,360 | 90,135,360 |
| Size | 334.0 MB | 86.0 MB |
| Events in quadrant A | 2,975,532 | 614,240 |
| Events in quadrant B | 2,597,811 | 635,190 |
| Events in quadrant C | 3,244,747 | 565,255 |
| Events in quadrant D | 3,722,361 | 534,889 |
| Mode SS | |||
|---|---|---|---|
| Quadrant | BADHDUFLAG | Total packets | Discarded packets |
| A | 0 | 112 | 0 |
| B | 0 | 112 | 0 |
| C | 0 | 112 | 0 |
| D | 0 | 112 | 0 |
| Mode M9 | |||
|---|---|---|---|
| Quadrant | BADHDUFLAG | Total packets | Discarded packets |
| A | 0 | 42 | 0 |
| B | 0 | 42 | 0 |
| C | 0 | 42 | 0 |
| D | 0 | 42 | 0 |
| Mode M0 | |||
|---|---|---|---|
| Quadrant | BADHDUFLAG | Total packets | Discarded packets |
| A | 0 | 11925 | 3 |
| B | 0 | 11254 | 2 |
| C | 0 | 12818 | 2 |
| D | 0 | 14633 | 2 |
| Quadrant | Total seconds | Saturated seconds | Saturation percentage |
|---|---|---|---|
| A | 5429 | 10 | 0.184196% |
| B | 5429 | 11 | 0.202616% |
| C | 5429 | 262 | 4.825935% |
| D | 5429 | 163 | 3.002395% |
Noise dominated data is calculated using 1-second bins in cleaned event files. If a bin has >2000 counts, and if more than 50% of those come from <1% of pixels, then it is considered to be noise-dominated and hence unusable.
| Quadrant | # 1 sec bins | Bins with >0 counts | Bins with >2000 counts | High rate bins dominated by noise | Noise dominated (total time) | Noise dominated (detector-on time) | Marked lightcurve |
|---|---|---|---|---|---|---|---|
| A | 9583 | 5431 | 4 | 4 | 0.04% | 0.07% | 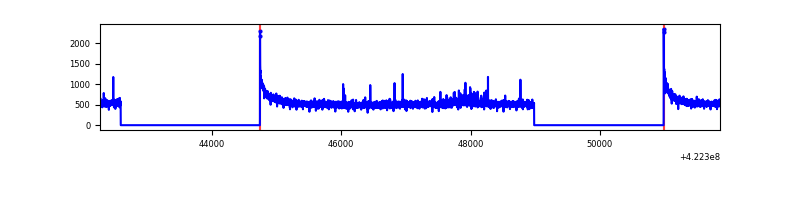 |
| B | 9583 | 5431 | 5 | 5 | 0.05% | 0.09% | 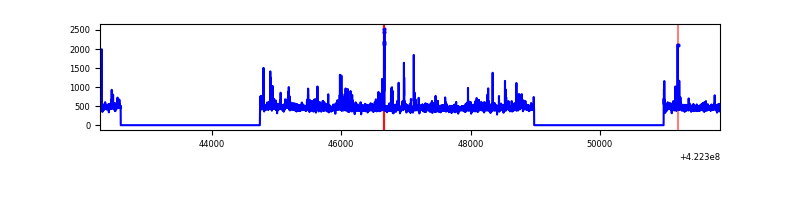 |
| C | 9583 | 5431 | 253 | 253 | 2.64% | 4.66% | 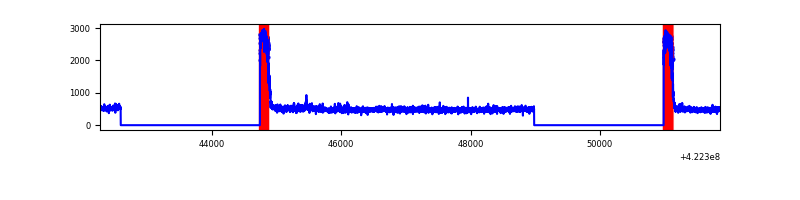 |
| D | 9583 | 5431 | 161 | 161 | 1.68% | 2.96% | 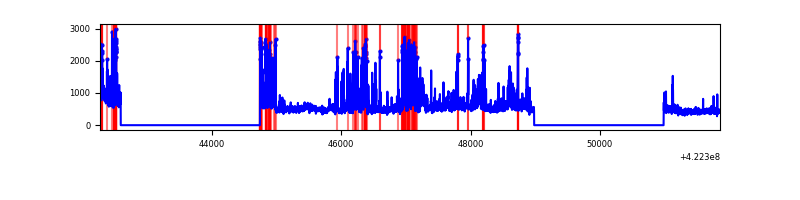 |
Top three noisy pixels from each quadrant. If the there are fewer than three noisy pixels in the level2.evt file, extra rows are filled as -1
| Pixel properties | Quadrant properties | ||||||
|---|---|---|---|---|---|---|---|
| Quadrant | DetID | PixID | Counts | Sigma | Mean | Median | Sigma |
| A | 10 | 83 | 532037 | 4185.33 | 617 | 604 | 127.0 |
| A | 2 | 79 | 54322 | 423.06 | 617 | 604 | 127.0 |
| A | 3 | 137 | 6728 | 48.23 | 617 | 604 | 127.0 |
| B | 0 | 190 | 117467 | 978.59 | 609 | 593 | 119.4 |
| B | 5 | 255 | 62988 | 522.44 | 609 | 593 | 119.4 |
| B | 0 | 155 | 17302 | 139.91 | 609 | 593 | 119.4 |
| C | 0 | 10 | 722335 | 5328.18 | 577 | 579 | 135.5 |
| C | 15 | 214 | 229345 | 1688.81 | 577 | 579 | 135.5 |
| C | 9 | 54 | 42650 | 310.58 | 577 | 579 | 135.5 |
| D | 5 | 222 | 530661 | 3658.37 | 590 | 574 | 144.9 |
| D | 1 | 52 | 445352 | 3069.61 | 590 | 574 | 144.9 |
| D | 13 | 249 | 282541 | 1945.98 | 590 | 574 | 144.9 |
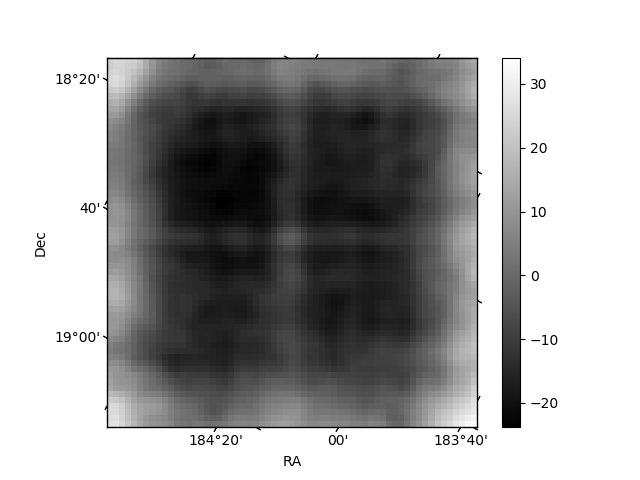
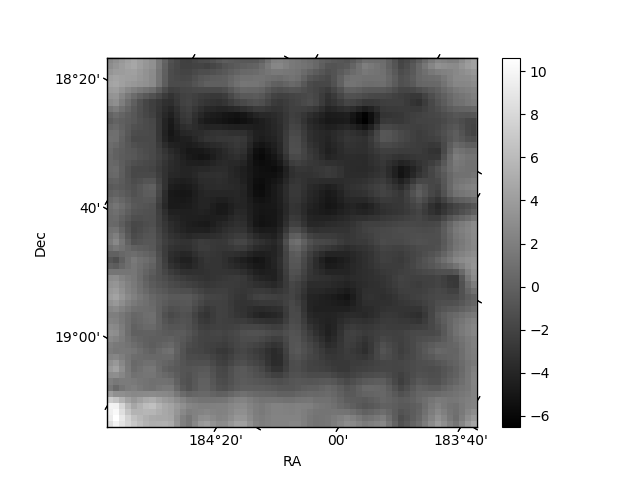
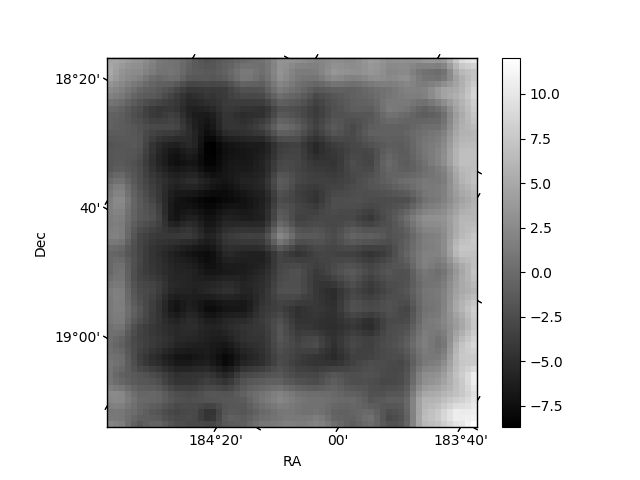
Histogram calculated using DETX and DETY for each event in the final _common_clean file
| Quadrant A | 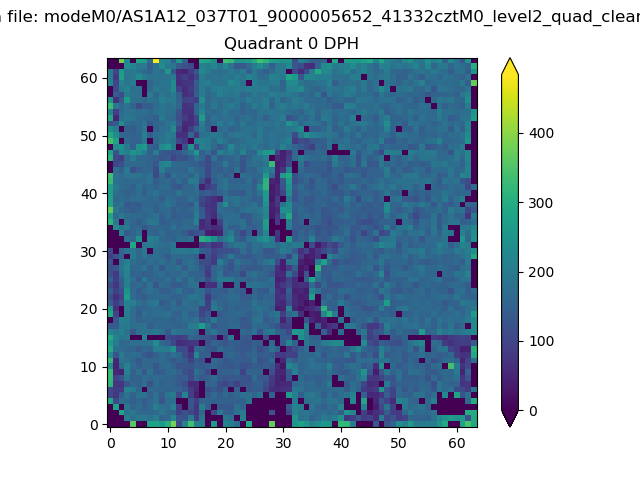 |
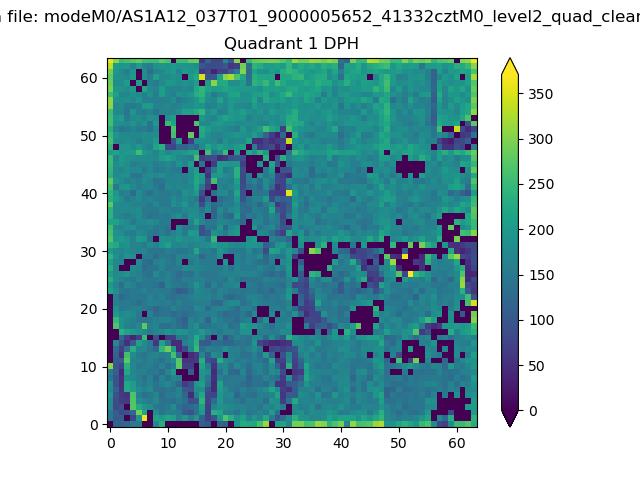 |
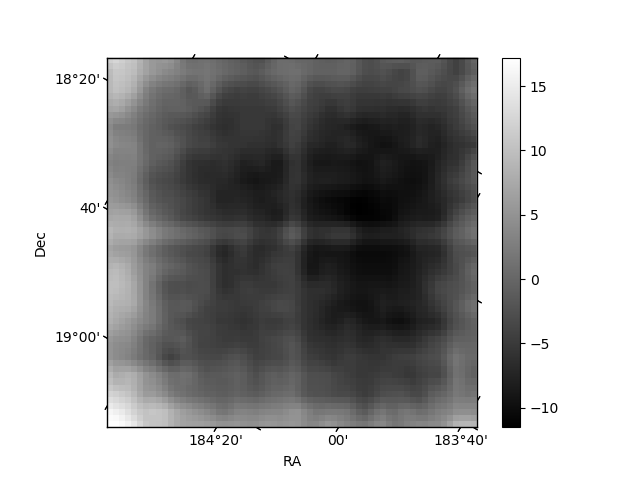
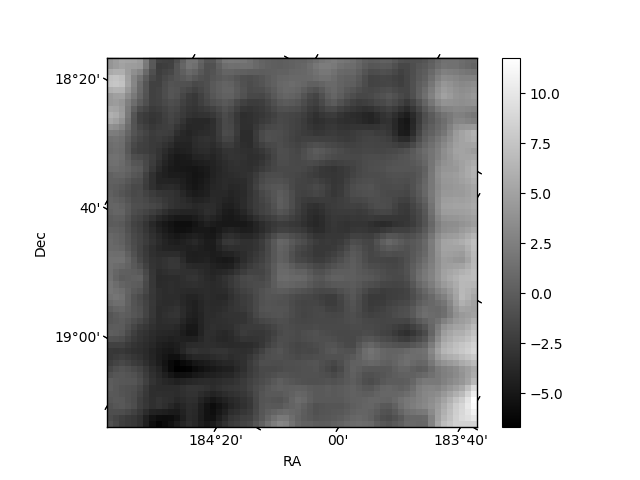
Quadrant B |
|---|---|---|---|
| Quadrant D | 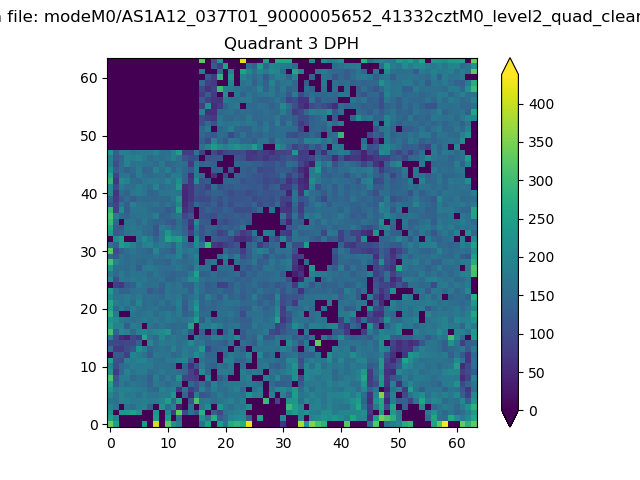 |
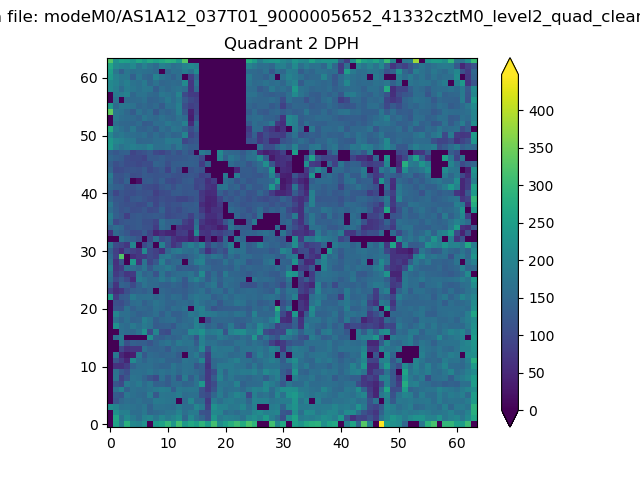 |
Quadrant C |
| Plot type | Count rate plots | Images |
|---|---|---|
| Comparison with Poisson distribution Blue bars denote a histogram of data divided into 1 sec bins. Red curve is a Poisson curve with rate = median count rate of data. |
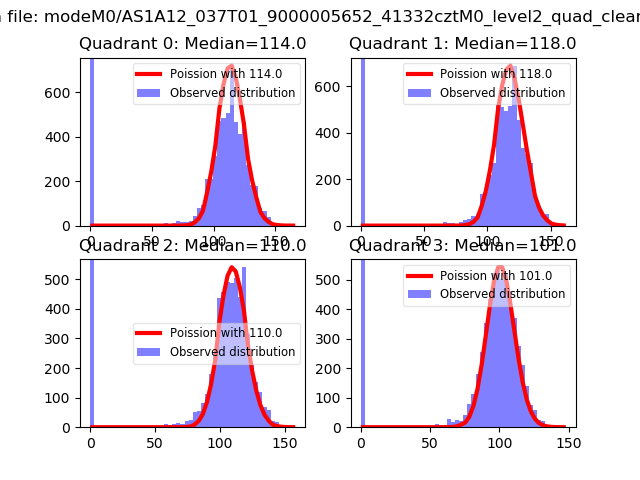 |
 |
| Quadrant-wise count rates Data is divided into 100 sec bins |
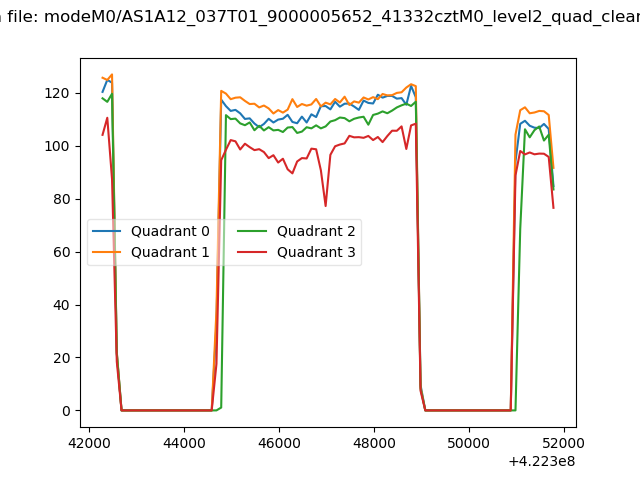 |
|
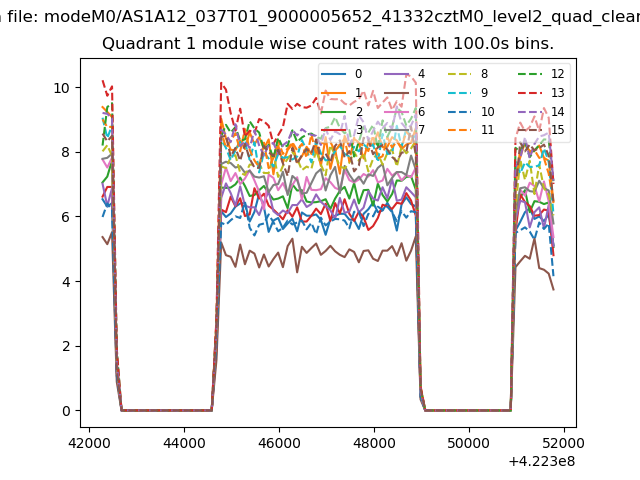
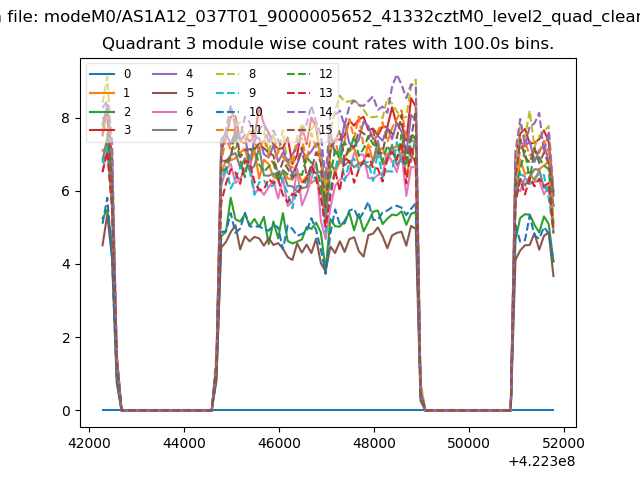
| Module-wise count rates for Quadrant A Data is divided into 100 sec bins |
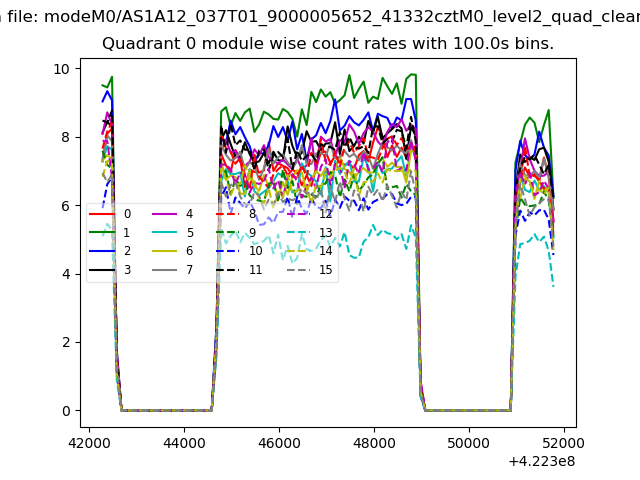 |
 |
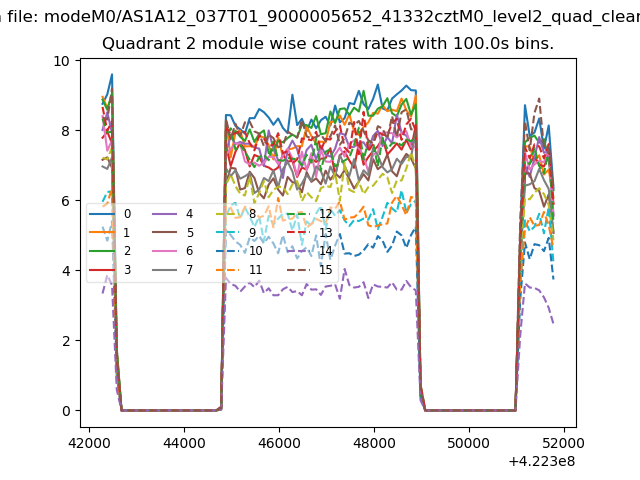
| Module-wise count rates for Quadrant B Data is divided into 100 sec bins |
 |
 |
| Module-wise count rates for Quadrant C Data is divided into 100 sec bins |
 |
 |
| Module-wise count rates for Quadrant D Data is divided into 100 sec bins |
 |
 |
| Parameter | Plot |
|---|---|
| CZT HV Monitor | 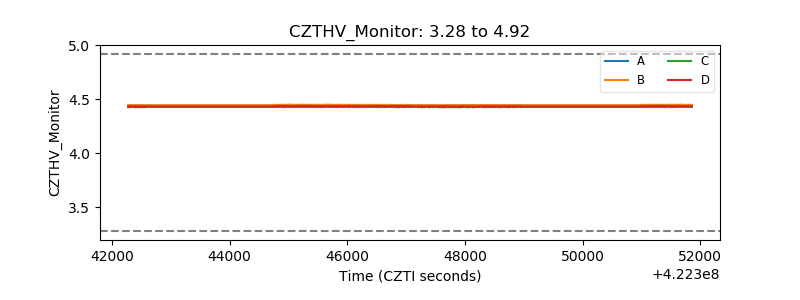 |
| D_VDD | 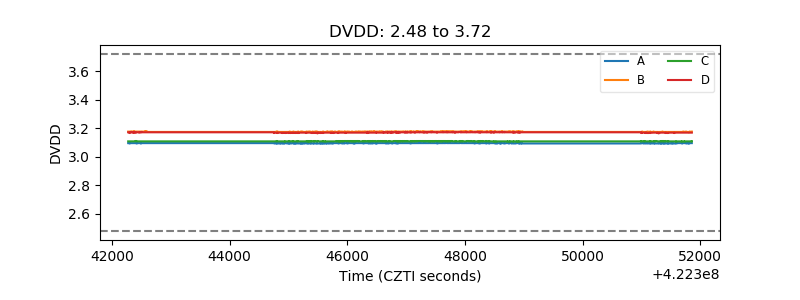 |
| Temperature 1 | 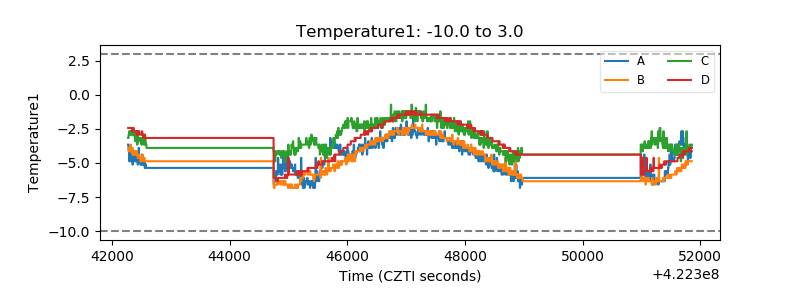 |
| Veto HV Monitor | 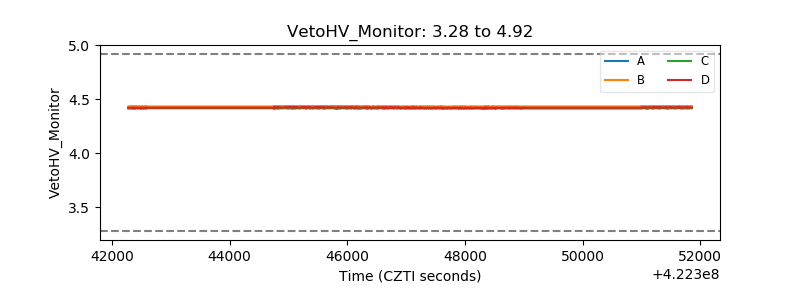 |
| Veto LLD | 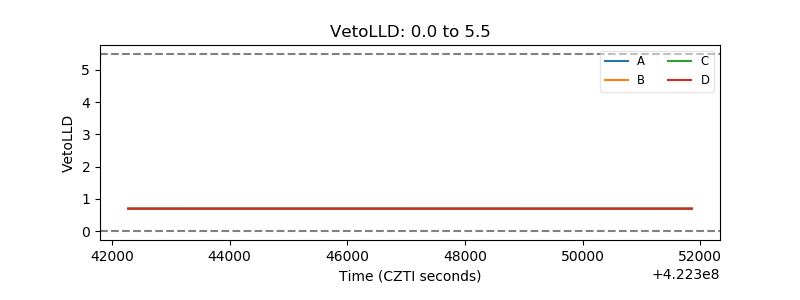 |
| Alpha Counter | 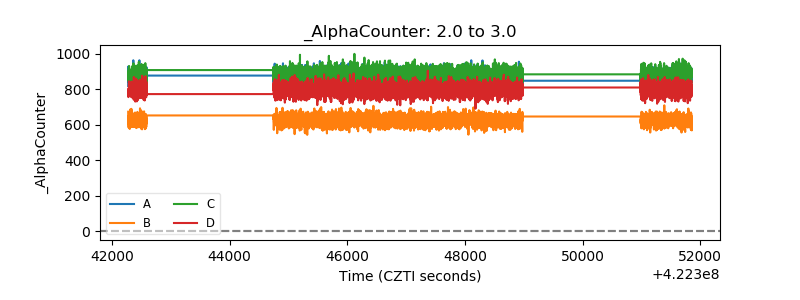 |
| _CPM_Rate |  |
| CZT Counter | 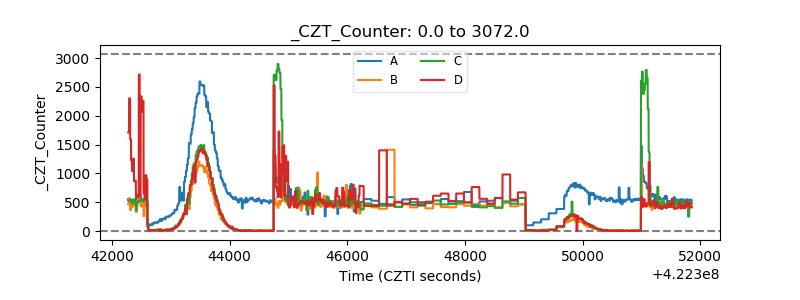 |
| +2.5 Volts monitor |  |
| +5 Volts monitor | 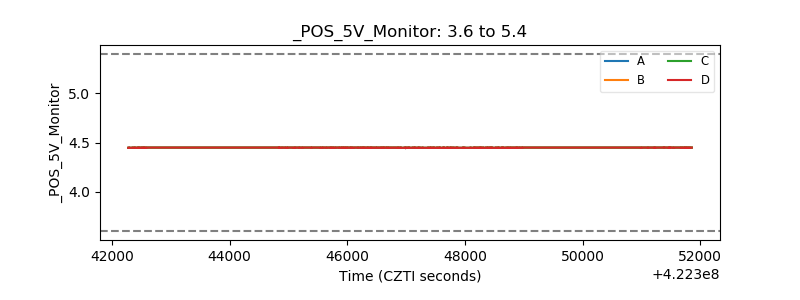 |
| _ROLL_ROT | 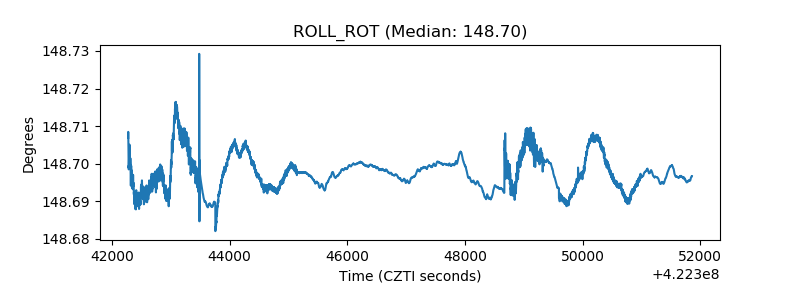 |
| _Roll_DEC | 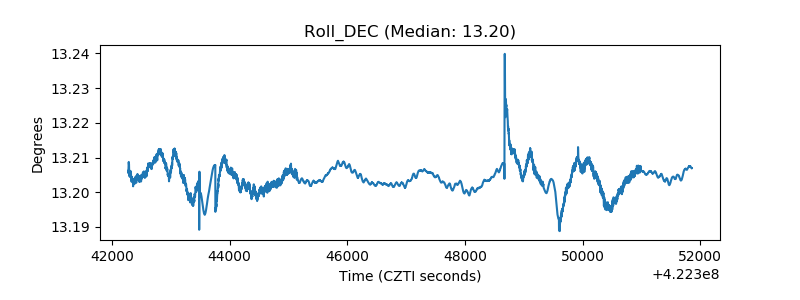 |
| _Roll_RA | 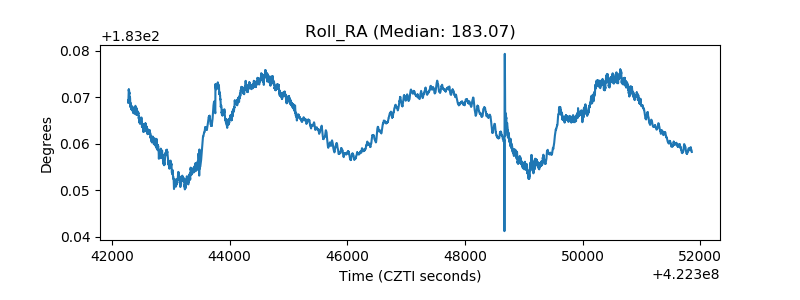 |
| Veto Counter | 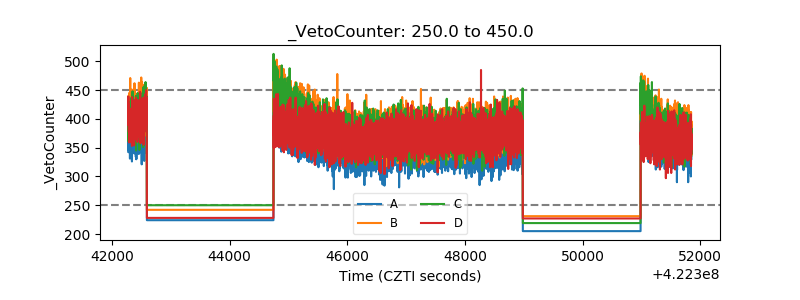 |