| Param | Original file | Final file |
|---|---|---|
| Filename | modeM0/AS1A12_037T01_9000005652_41333cztM0_level2.fits | modeM0/AS1A12_037T01_9000005652_41333cztM0_level2_quad_clean.evt |
| Size (bytes) | 325,016,640 | 88,133,760 |
| Size | 310.0 MB | 84.1 MB |
| Events in quadrant A | 2,893,087 | 594,850 |
| Events in quadrant B | 2,727,448 | 612,260 |
| Events in quadrant C | 3,159,838 | 551,692 |
| Events in quadrant D | 2,828,560 | 530,361 |
| Mode SS | |||
|---|---|---|---|
| Quadrant | BADHDUFLAG | Total packets | Discarded packets |
| A | 0 | 112 | 0 |
| B | 0 | 112 | 0 |
| C | 0 | 112 | 0 |
| D | 0 | 112 | 0 |
| Mode M9 | |||
|---|---|---|---|
| Quadrant | BADHDUFLAG | Total packets | Discarded packets |
| A | 0 | 29 | 0 |
| B | 0 | 29 | 0 |
| C | 0 | 29 | 0 |
| D | 0 | 30 | 0 |
| Mode M0 | |||
|---|---|---|---|
| Quadrant | BADHDUFLAG | Total packets | Discarded packets |
| A | 0 | 11704 | 3 |
| B | 0 | 11810 | 2 |
| C | 0 | 12656 | 2 |
| D | 0 | 12238 | 2 |
| Quadrant | Total seconds | Saturated seconds | Saturation percentage |
|---|---|---|---|
| A | 5417 | 13 | 0.239985% |
| B | 5417 | 40 | 0.738416% |
| C | 5417 | 249 | 4.596640% |
| D | 5417 | 38 | 0.701495% |
Noise dominated data is calculated using 1-second bins in cleaned event files. If a bin has >2000 counts, and if more than 50% of those come from <1% of pixels, then it is considered to be noise-dominated and hence unusable.
| Quadrant | # 1 sec bins | Bins with >0 counts | Bins with >2000 counts | High rate bins dominated by noise | Noise dominated (total time) | Noise dominated (detector-on time) | Marked lightcurve |
|---|---|---|---|---|---|---|---|
| A | 7150 | 5418 | 4 | 4 | 0.06% | 0.07% | 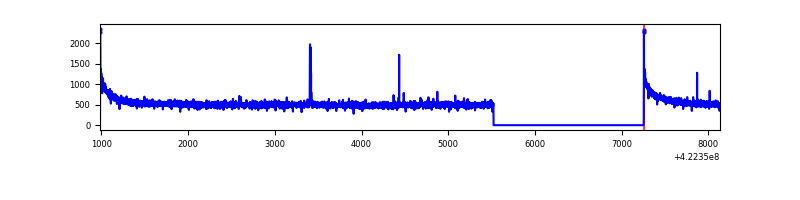 |
| B | 7150 | 5418 | 41 | 41 | 0.57% | 0.76% | 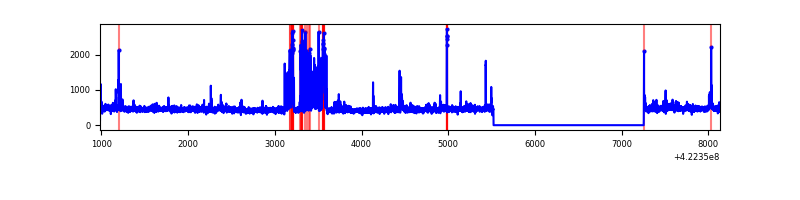 |
| C | 7150 | 5418 | 242 | 242 | 3.38% | 4.47% | 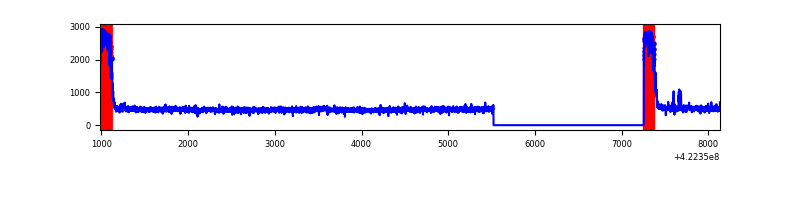 |
| D | 7150 | 5418 | 48 | 48 | 0.67% | 0.89% | 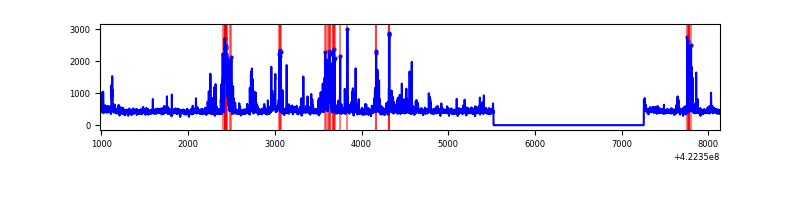 |
Top three noisy pixels from each quadrant. If the there are fewer than three noisy pixels in the level2.evt file, extra rows are filled as -1
| Pixel properties | Quadrant properties | ||||||
|---|---|---|---|---|---|---|---|
| Quadrant | DetID | PixID | Counts | Sigma | Mean | Median | Sigma |
| A | 10 | 83 | 529360 | 4257.16 | 601 | 588 | 124.2 |
| A | 13 | 248 | 16836 | 130.81 | 601 | 588 | 124.2 |
| A | 15 | 235 | 8938 | 67.23 | 601 | 588 | 124.2 |
| B | 5 | 255 | 313857 | 2686.76 | 594 | 577 | 116.6 |
| B | 0 | 190 | 53509 | 453.96 | 594 | 577 | 116.6 |
| B | 12 | 111 | 15150 | 124.98 | 594 | 577 | 116.6 |
| C | 0 | 10 | 708965 | 5297.09 | 567 | 570 | 133.7 |
| C | 15 | 214 | 228522 | 1704.53 | 567 | 570 | 133.7 |
| C | 9 | 54 | 14013 | 100.52 | 567 | 570 | 133.7 |
| D | 1 | 52 | 189864 | 1323.42 | 582 | 566 | 143.0 |
| D | 5 | 222 | 124609 | 867.21 | 582 | 566 | 143.0 |
| D | 13 | 249 | 123229 | 857.56 | 582 | 566 | 143.0 |
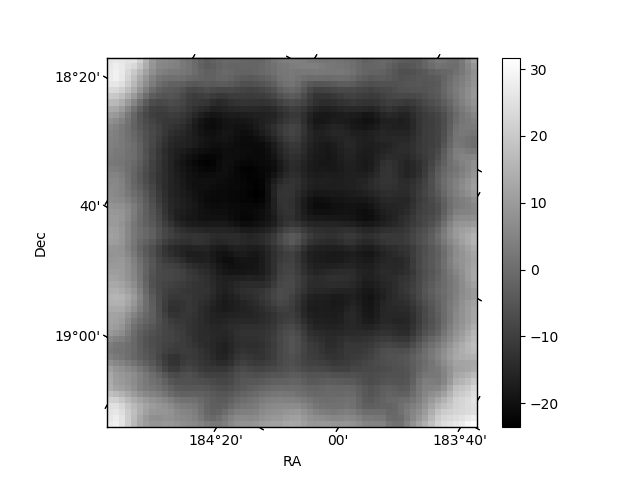
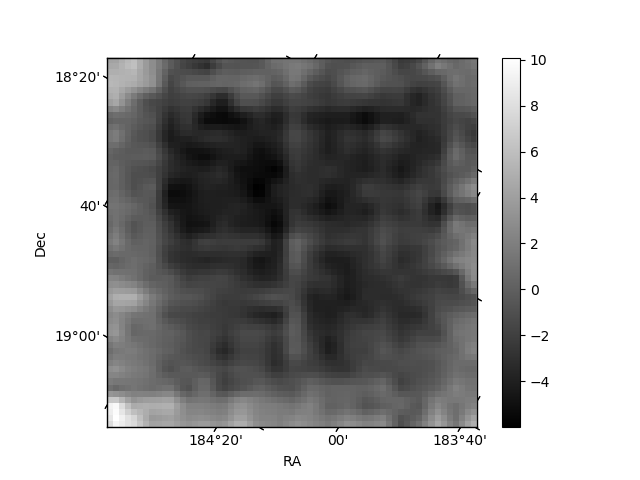
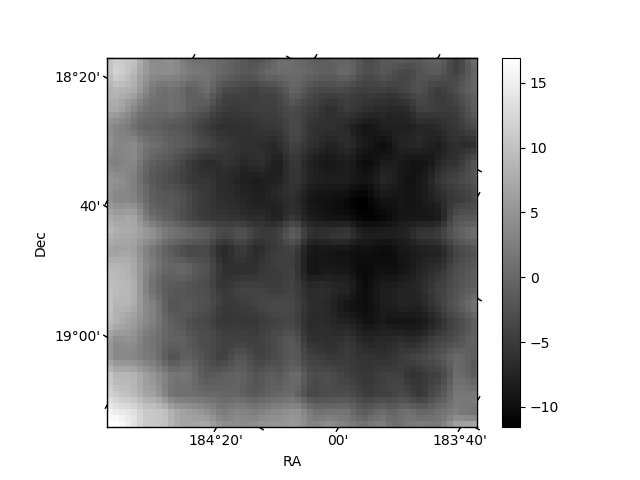
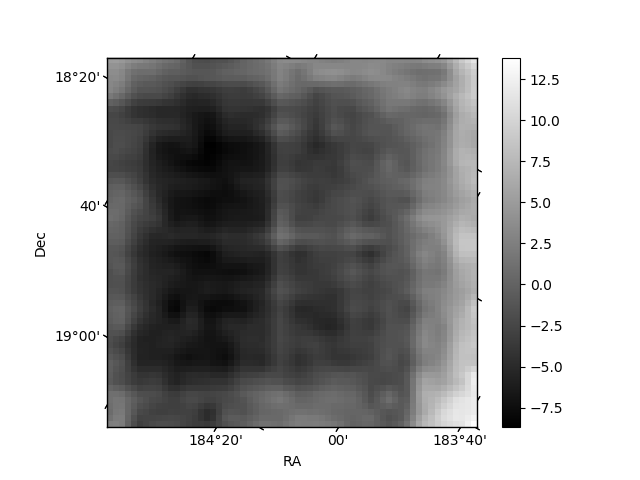
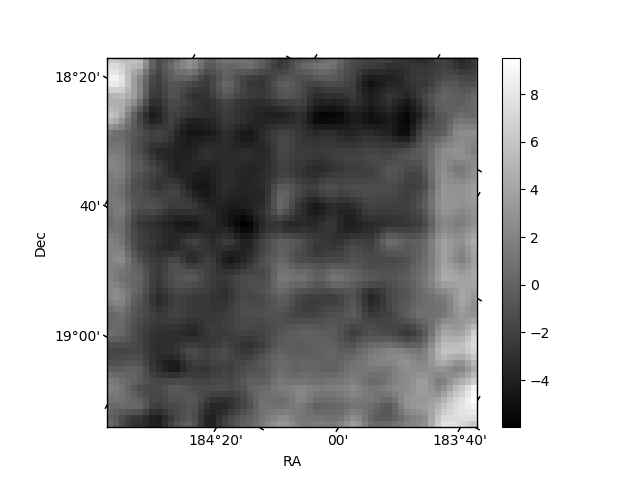
Histogram calculated using DETX and DETY for each event in the final _common_clean file
| Quadrant A | 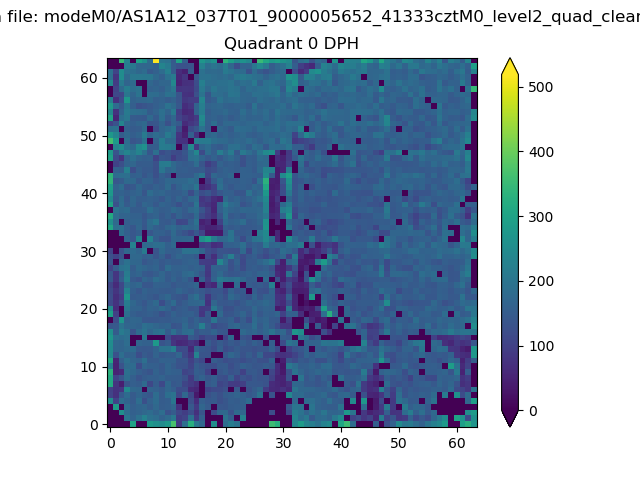 |
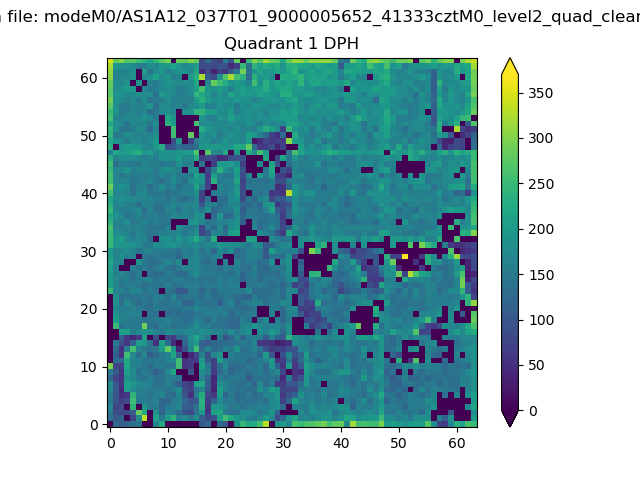 |
Quadrant B |
|---|---|---|---|
| Quadrant D | 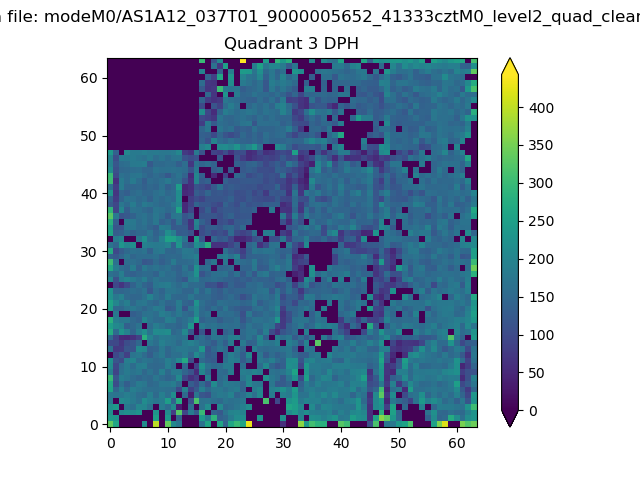 |
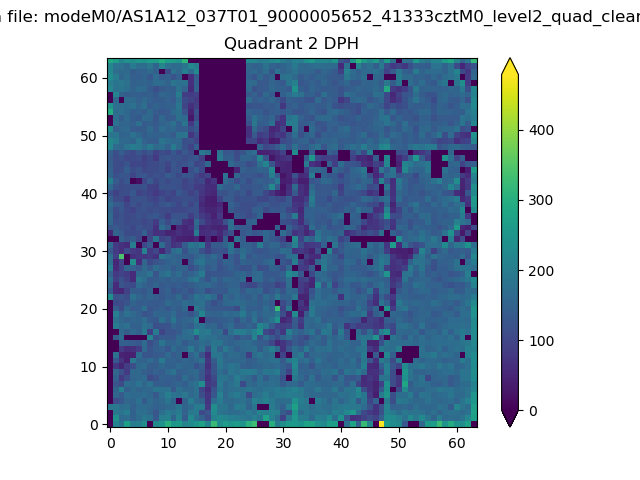 |
Quadrant C |
| Plot type | Count rate plots | Images |
|---|---|---|
| Comparison with Poisson distribution Blue bars denote a histogram of data divided into 1 sec bins. Red curve is a Poisson curve with rate = median count rate of data. |
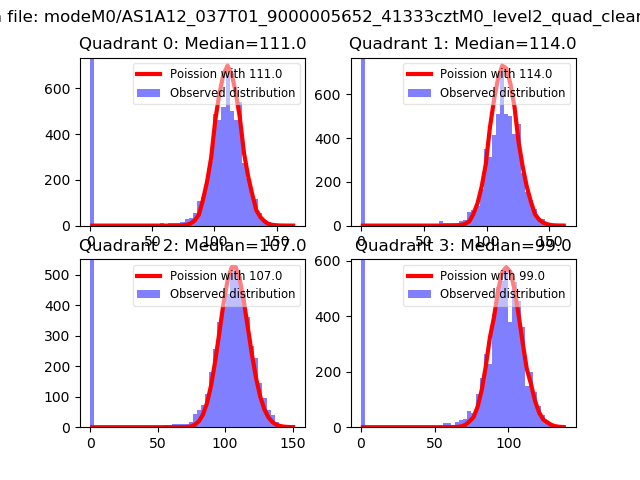 |
 |
| Quadrant-wise count rates Data is divided into 100 sec bins |
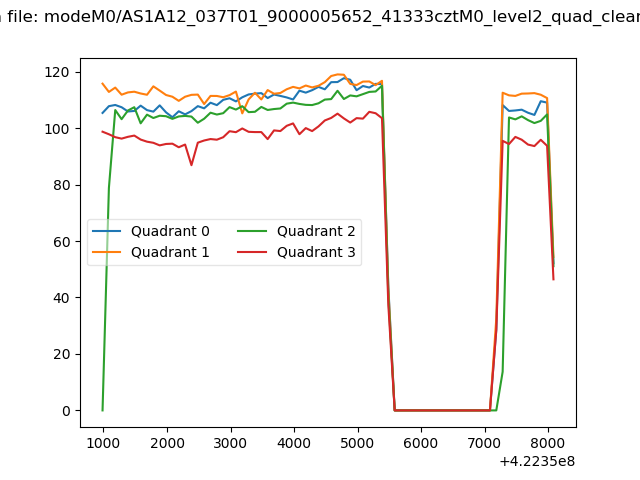 |
|
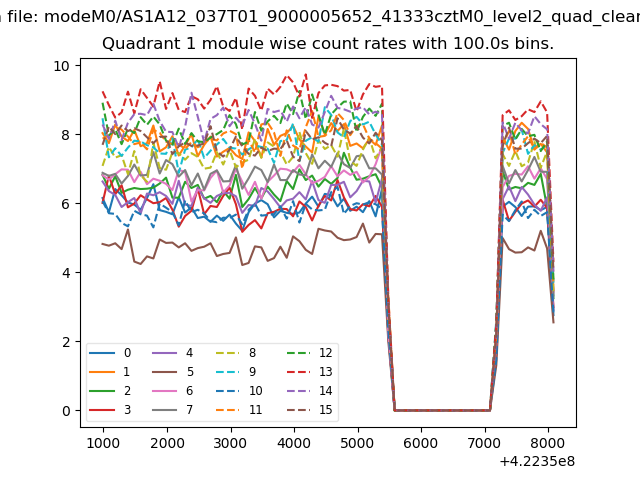
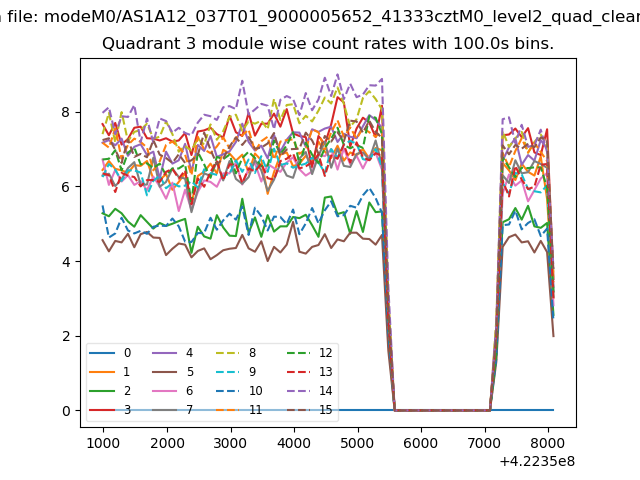
| Module-wise count rates for Quadrant A Data is divided into 100 sec bins |
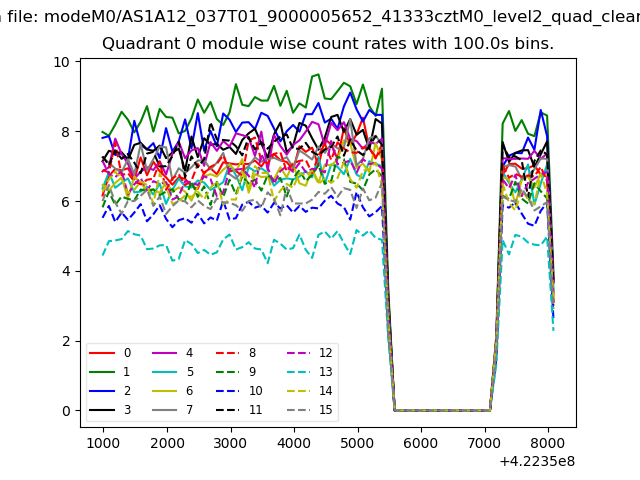 |
 |
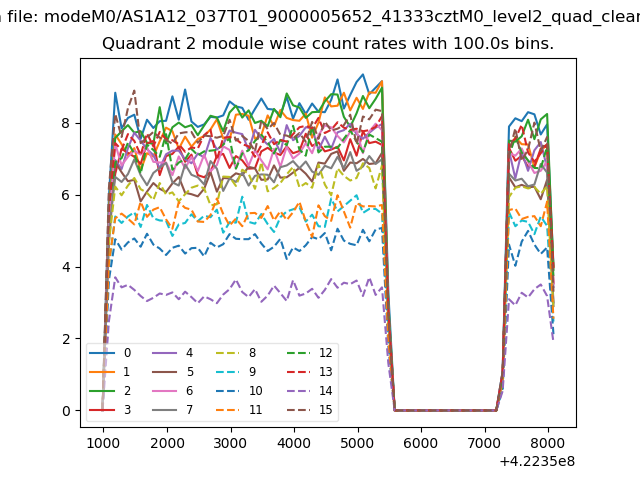
| Module-wise count rates for Quadrant B Data is divided into 100 sec bins |
 |
 |
| Module-wise count rates for Quadrant C Data is divided into 100 sec bins |
 |
 |
| Module-wise count rates for Quadrant D Data is divided into 100 sec bins |
 |
 |
| Parameter | Plot |
|---|---|
| CZT HV Monitor | 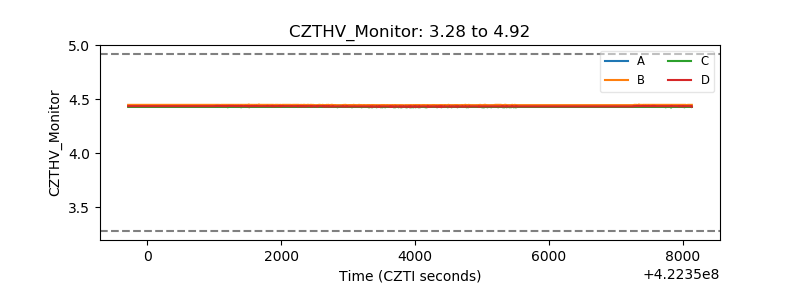 |
| D_VDD | 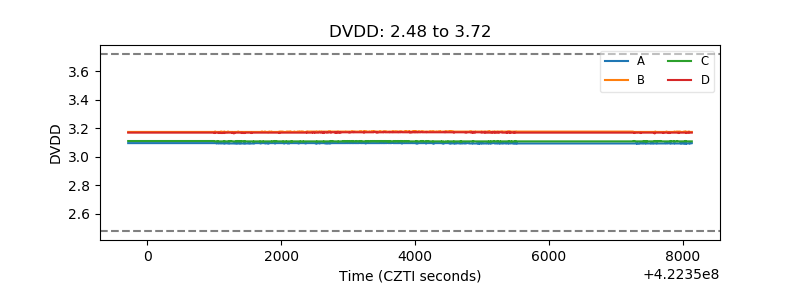 |
| Temperature 1 | 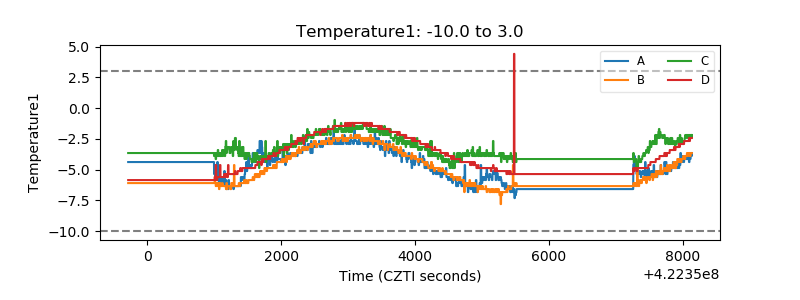 |
| Veto HV Monitor | 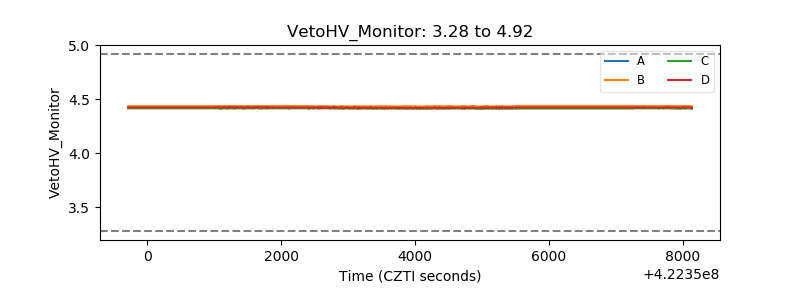 |
| Veto LLD | 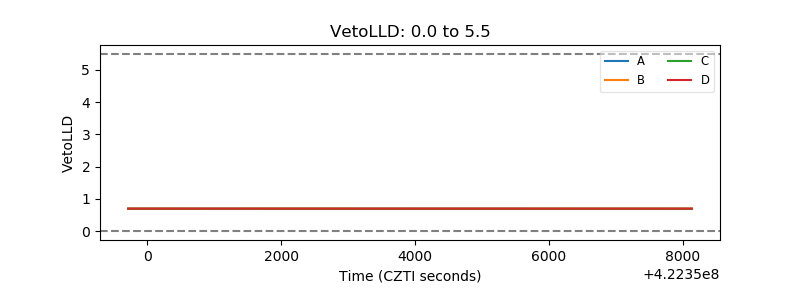 |
| Alpha Counter | 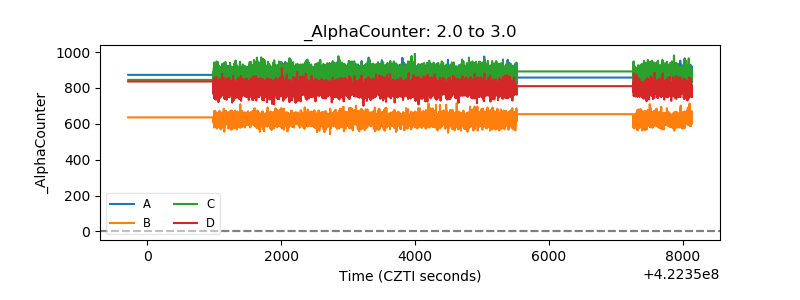 |
| _CPM_Rate | 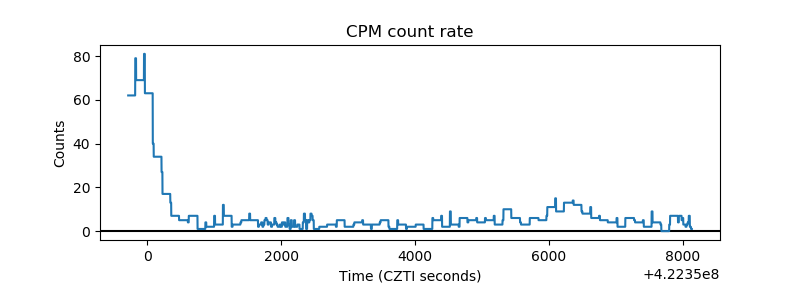 |
| CZT Counter | 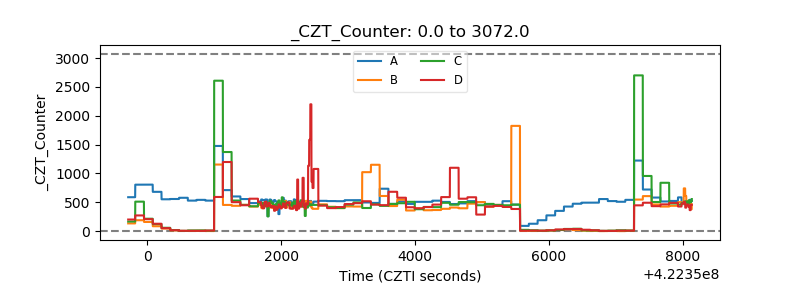 |
| +2.5 Volts monitor | 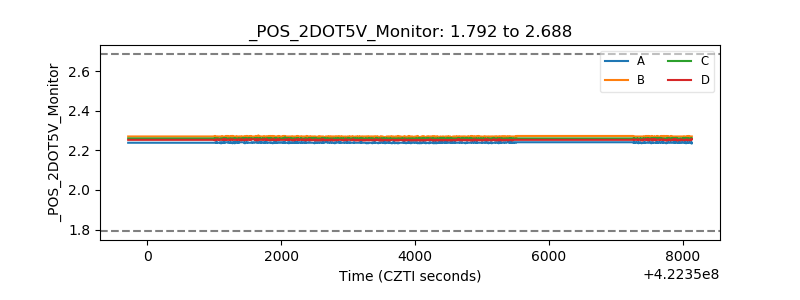 |
| +5 Volts monitor | 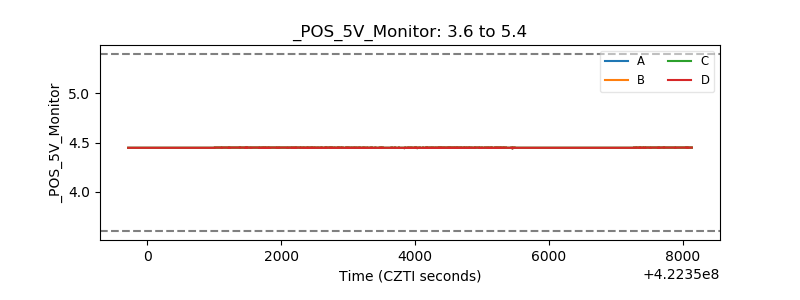 |
| _ROLL_ROT | 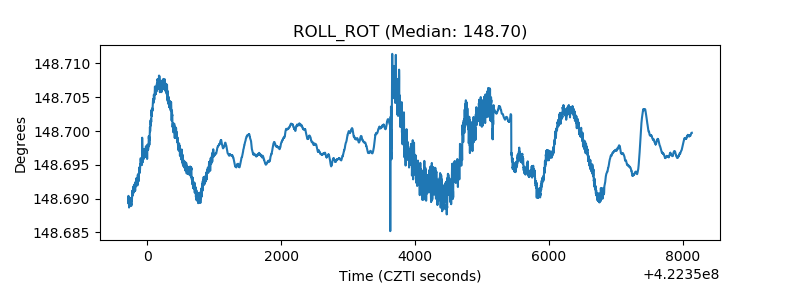 |
| _Roll_DEC | 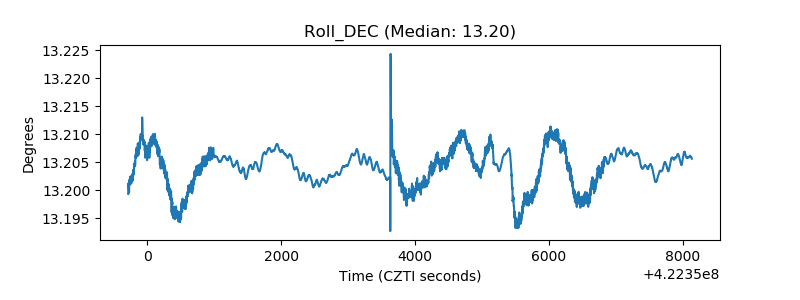 |
| _Roll_RA |  |
| Veto Counter | 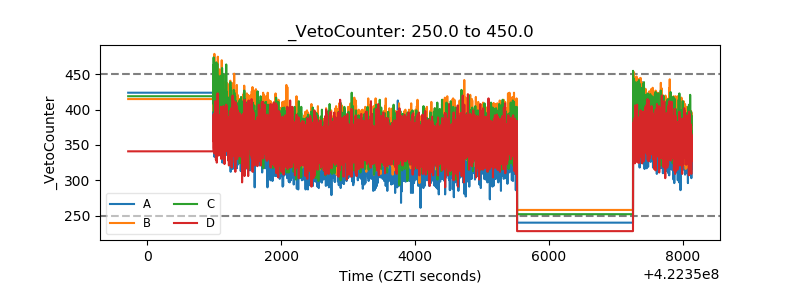 |