| Param | Original file | Final file |
|---|---|---|
| Filename | modeM0/AS1A12_037T03_9000005654_41334cztM0_level2.fits | modeM0/AS1A12_037T03_9000005654_41334cztM0_level2_quad_clean.evt |
| Size (bytes) | 145,244,160 | 30,925,440 |
| Size | 138.5 MB | 29.5 MB |
| Events in quadrant A | 1,095,735 | 214,335 |
| Events in quadrant B | 1,607,464 | 199,612 |
| Events in quadrant C | 1,373,970 | 193,382 |
| Events in quadrant D | 1,146,283 | 188,399 |
| Mode M9 | |||
|---|---|---|---|
| Quadrant | BADHDUFLAG | Total packets | Discarded packets |
| A | 0 | 15 | 0 |
| B | 0 | 15 | 0 |
| C | 0 | 15 | 0 |
| D | 0 | 15 | 0 |
| Mode M0 | |||
|---|---|---|---|
| Quadrant | BADHDUFLAG | Total packets | Discarded packets |
| A | 0 | 4392 | 2 |
| B | 0 | 6060 | 1 |
| C | 0 | 5230 | 1 |
| D | 0 | 4721 | 1 |
| Mode SS | |||
|---|---|---|---|
| Quadrant | BADHDUFLAG | Total packets | Discarded packets |
| A | 0 | 40 | 0 |
| B | 0 | 40 | 0 |
| C | 0 | 40 | 0 |
| D | 0 | 40 | 0 |
| Quadrant | Total seconds | Saturated seconds | Saturation percentage |
|---|---|---|---|
| A | 1936 | 5 | 0.258264% |
| B | 1936 | 257 | 13.274793% |
| C | 1936 | 153 | 7.902893% |
| D | 1936 | 52 | 2.685950% |
Noise dominated data is calculated using 1-second bins in cleaned event files. If a bin has >2000 counts, and if more than 50% of those come from <1% of pixels, then it is considered to be noise-dominated and hence unusable.
| Quadrant | # 1 sec bins | Bins with >0 counts | Bins with >2000 counts | High rate bins dominated by noise | Noise dominated (total time) | Noise dominated (detector-on time) | Marked lightcurve |
|---|---|---|---|---|---|---|---|
| A | 3369 | 1937 | 2 | 2 | 0.06% | 0.10% | 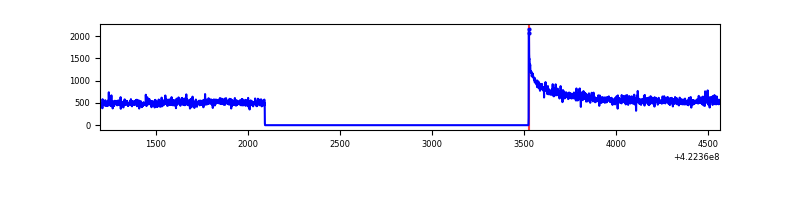 |
| B | 3369 | 1936 | 200 | 200 | 5.94% | 10.33% | 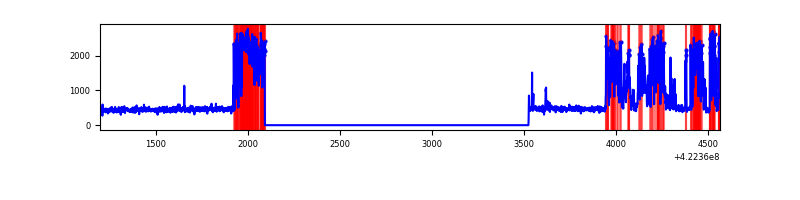 |
| C | 3369 | 1937 | 156 | 156 | 4.63% | 8.05% | 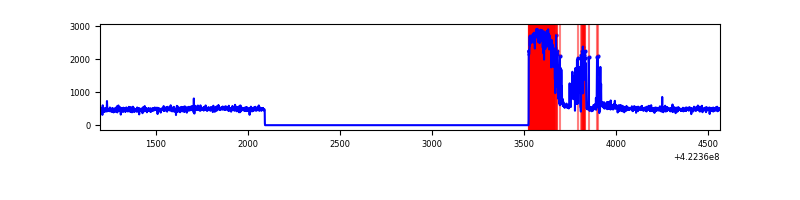 |
| D | 3369 | 1937 | 40 | 40 | 1.19% | 2.07% | 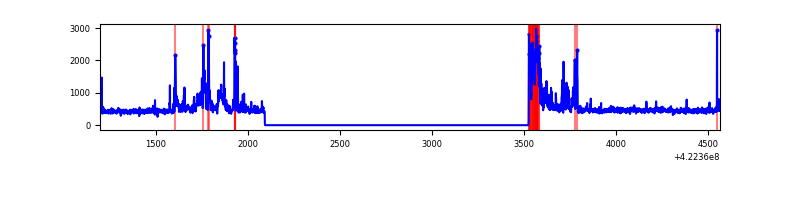 |
Top three noisy pixels from each quadrant. If the there are fewer than three noisy pixels in the level2.evt file, extra rows are filled as -1
| Pixel properties | Quadrant properties | ||||||
|---|---|---|---|---|---|---|---|
| Quadrant | DetID | PixID | Counts | Sigma | Mean | Median | Sigma |
| A | 10 | 83 | 210913 | 4423.25 | 222 | 217 | 47.6 |
| A | 2 | 79 | 21965 | 456.57 | 222 | 217 | 47.6 |
| A | 12 | 189 | 3514 | 69.22 | 222 | 217 | 47.6 |
| B | 5 | 255 | 748923 | 17120.02 | 212 | 206 | 43.7 |
| B | 0 | 190 | 18876 | 426.9 | 212 | 206 | 43.7 |
| B | 12 | 111 | 5493 | 120.89 | 212 | 206 | 43.7 |
| C | 0 | 10 | 292811 | 5858.18 | 205 | 206 | 49.9 |
| C | 9 | 54 | 200282 | 4005.68 | 205 | 206 | 49.9 |
| C | 15 | 214 | 80553 | 1608.61 | 205 | 206 | 49.9 |
| D | 13 | 249 | 257700 | 4730.83 | 212 | 206 | 54.4 |
| D | 1 | 52 | 31778 | 580.06 | 212 | 206 | 54.4 |
| D | 5 | 222 | 22310 | 406.11 | 212 | 206 | 54.4 |
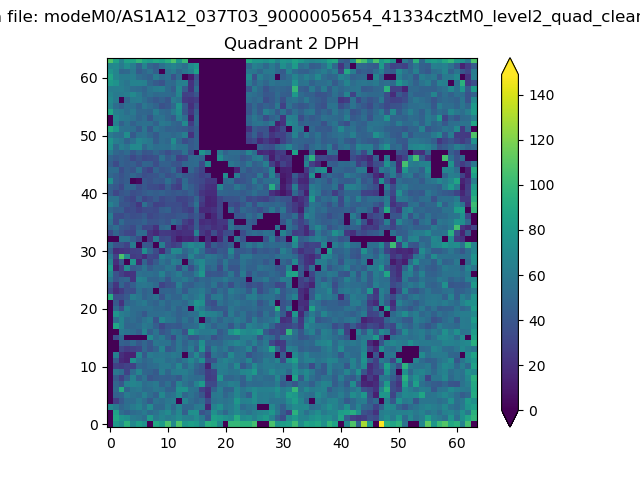
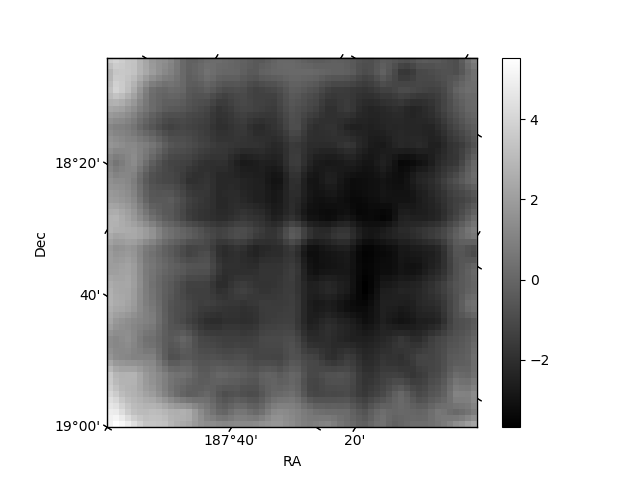
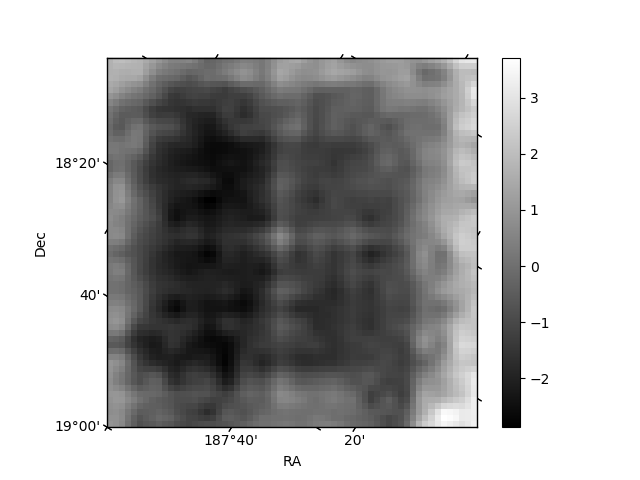
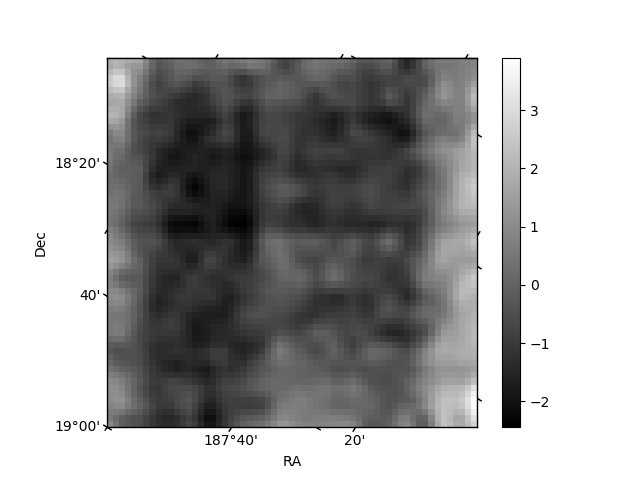
Histogram calculated using DETX and DETY for each event in the final _common_clean file
| Quadrant A | 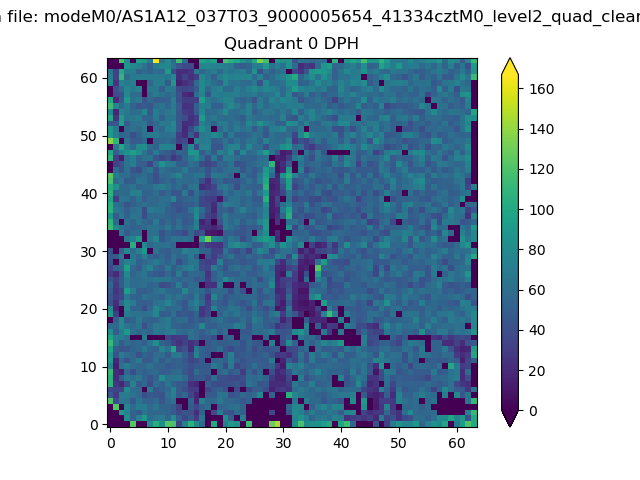 |
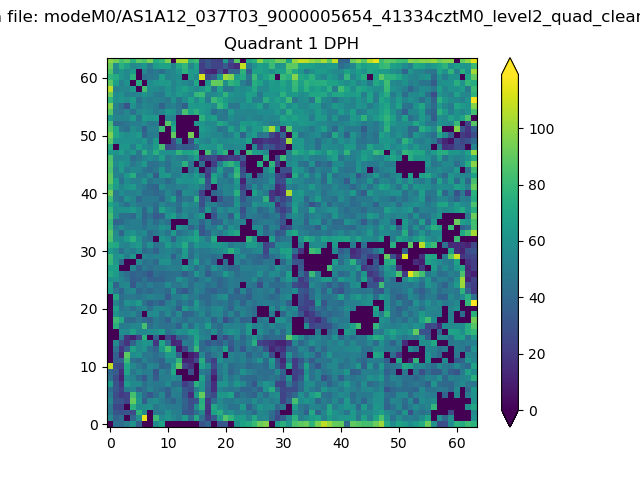 |
Quadrant B |
|---|---|---|---|
| Quadrant D | 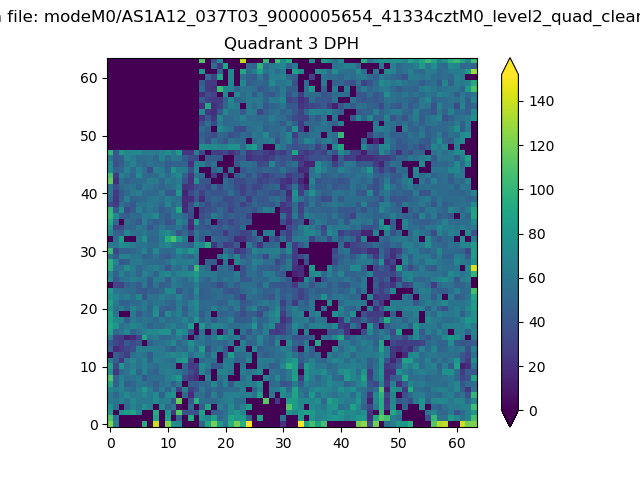 |
 |
Quadrant C |
| Plot type | Count rate plots | Images |
|---|---|---|
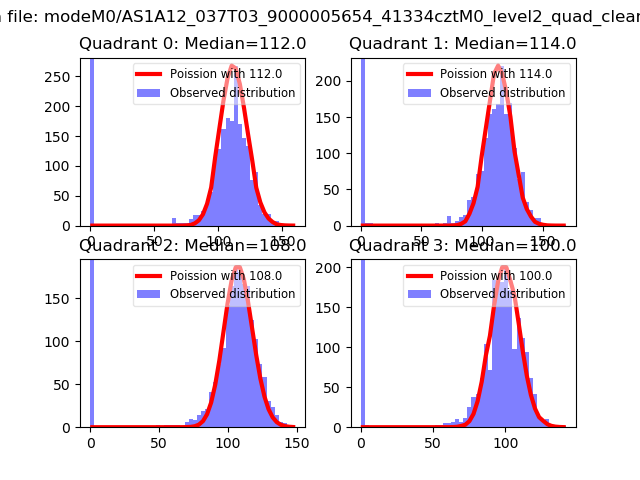
| Comparison with Poisson distribution Blue bars denote a histogram of data divided into 1 sec bins. Red curve is a Poisson curve with rate = median count rate of data. |
 |
 |
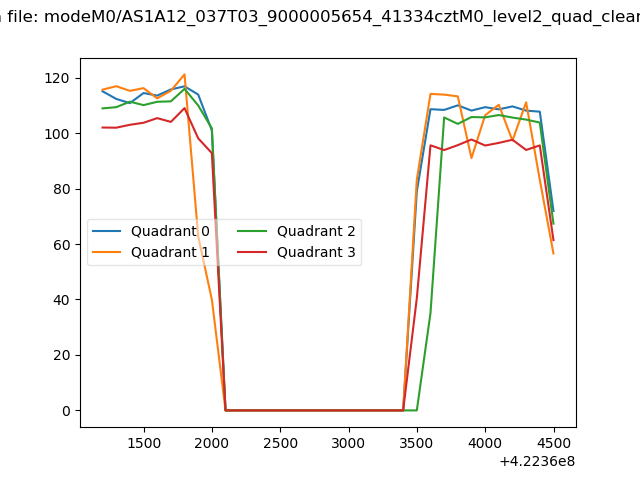
| Quadrant-wise count rates Data is divided into 100 sec bins |
 |
|
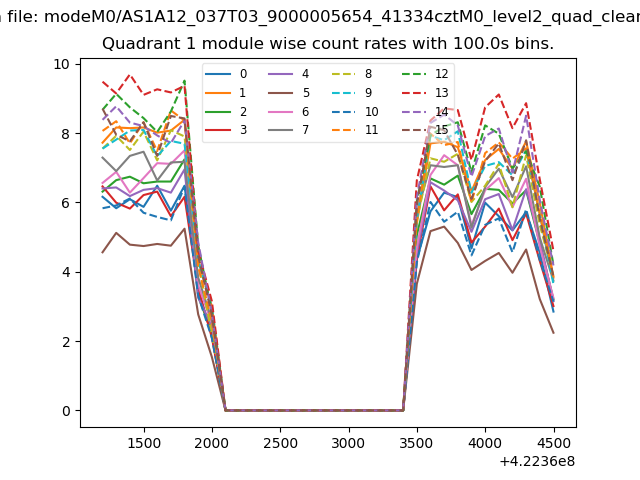
| Module-wise count rates for Quadrant A Data is divided into 100 sec bins |
 |
 |
| Module-wise count rates for Quadrant B Data is divided into 100 sec bins |
 |
 |
| Module-wise count rates for Quadrant C Data is divided into 100 sec bins |
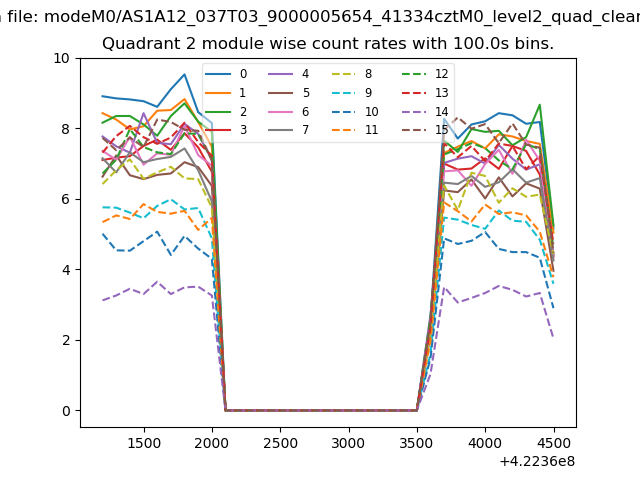 |
 |
| Module-wise count rates for Quadrant D Data is divided into 100 sec bins |
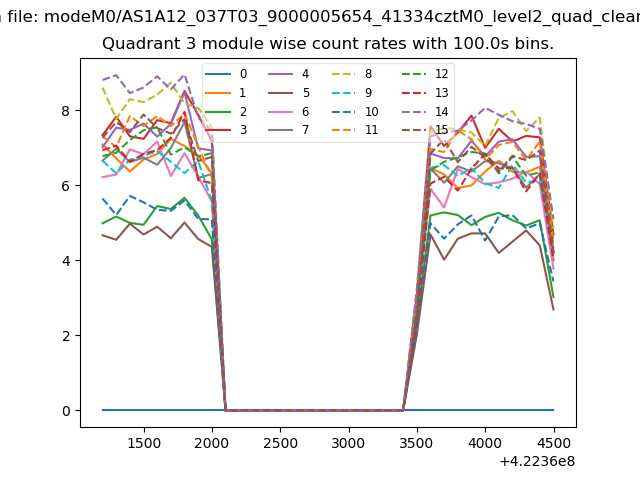 |
 |
| Parameter | Plot |
|---|---|
| CZT HV Monitor |  |
| D_VDD | 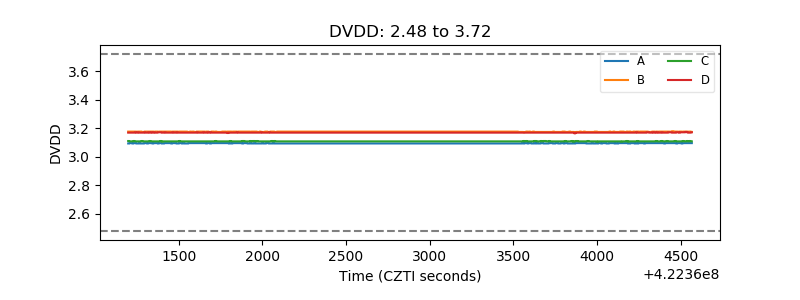 |
| Temperature 1 | 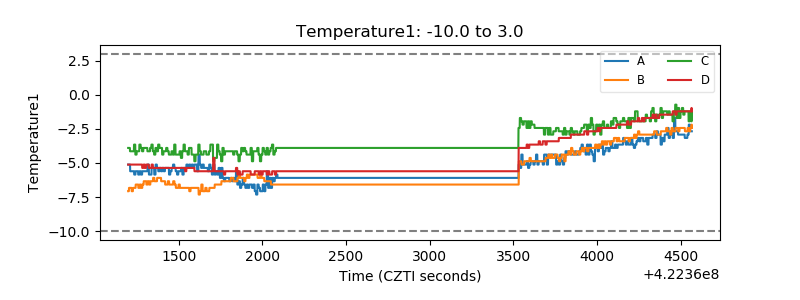 |
| Veto HV Monitor | 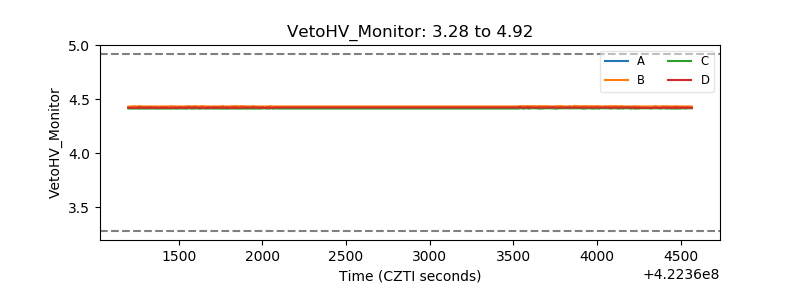 |
| Veto LLD | 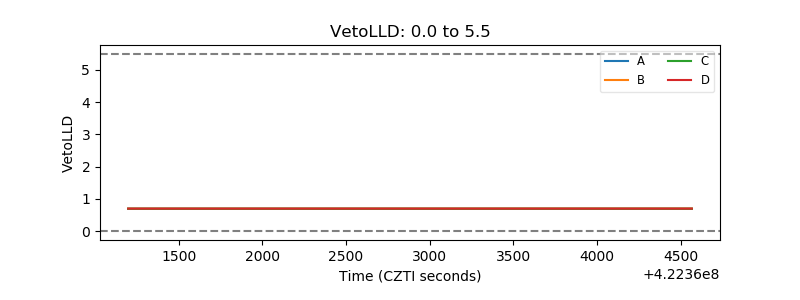 |
| Alpha Counter | 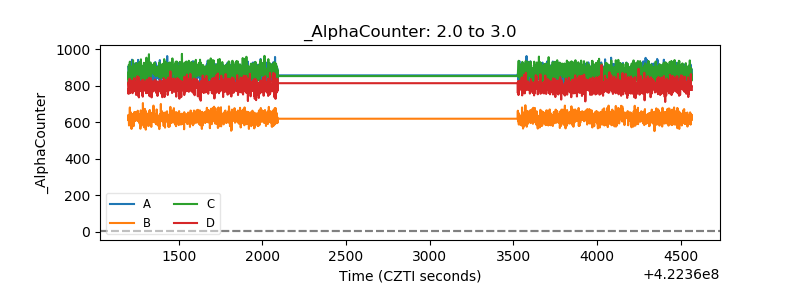 |
| _CPM_Rate | 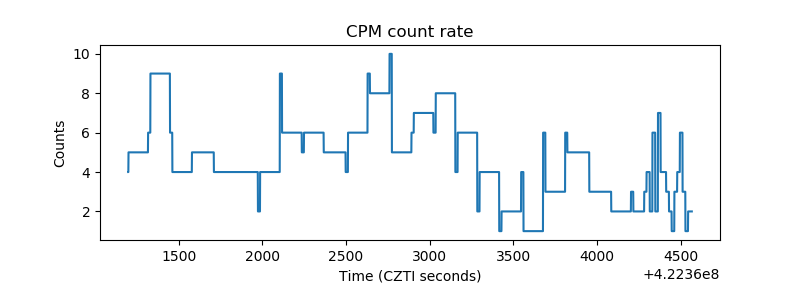 |
| CZT Counter | 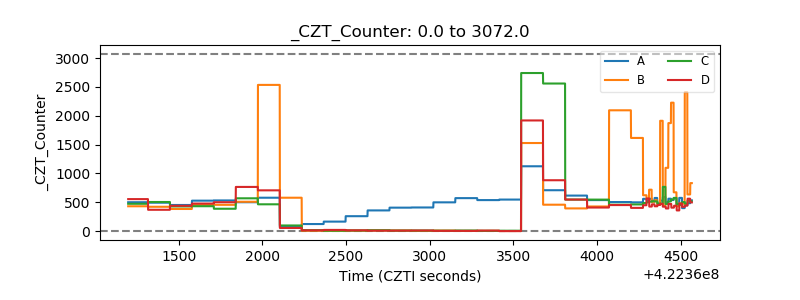 |
| +2.5 Volts monitor | 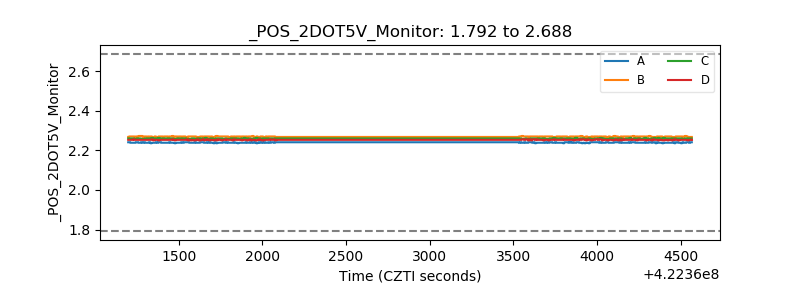 |
| +5 Volts monitor | 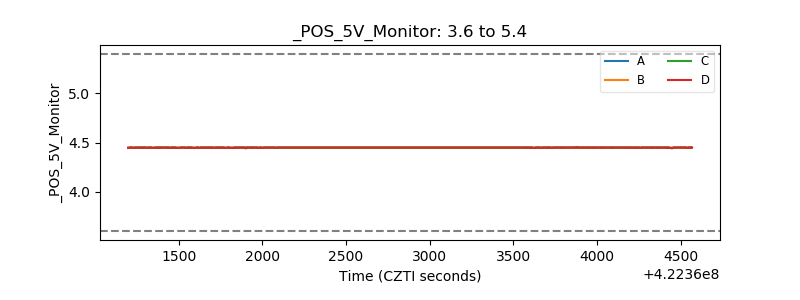 |
| _ROLL_ROT | 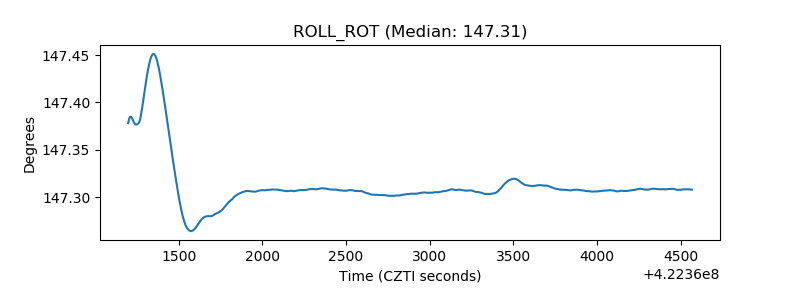 |
| _Roll_DEC | 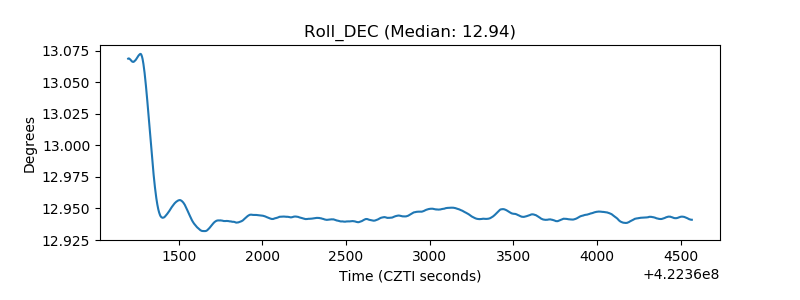 |
| _Roll_RA |  |
| Veto Counter | 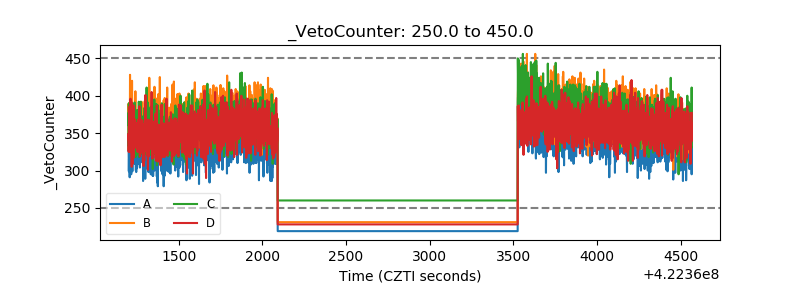 |