| Param | Original file | Final file |
|---|---|---|
| Filename | modeM0/AS1A12_037T03_9000005654_41335cztM0_level2.fits | modeM0/AS1A12_037T03_9000005654_41335cztM0_level2_quad_clean.evt |
| Size (bytes) | 492,013,440 | 90,607,680 |
| Size | 469.2 MB | 86.4 MB |
| Events in quadrant A | 3,231,001 | 647,715 |
| Events in quadrant B | 7,827,989 | 507,164 |
| Events in quadrant C | 3,509,919 | 599,734 |
| Events in quadrant D | 3,182,590 | 574,695 |
| Mode M9 | |||
|---|---|---|---|
| Quadrant | BADHDUFLAG | Total packets | Discarded packets |
| A | 0 | 28 | 0 |
| B | 0 | 28 | 0 |
| C | 0 | 28 | 0 |
| D | 0 | 28 | 0 |
| Mode M0 | |||
|---|---|---|---|
| Quadrant | BADHDUFLAG | Total packets | Discarded packets |
| A | 0 | 13153 | 3 |
| B | 0 | 27327 | 2 |
| C | 0 | 14097 | 2 |
| D | 0 | 13588 | 2 |
| Mode SS | |||
|---|---|---|---|
| Quadrant | BADHDUFLAG | Total packets | Discarded packets |
| A | 0 | 120 | 0 |
| B | 0 | 120 | 0 |
| C | 0 | 120 | 0 |
| D | 0 | 120 | 0 |
| Quadrant | Total seconds | Saturated seconds | Saturation percentage |
|---|---|---|---|
| A | 5934 | 17 | 0.286485% |
| B | 5934 | 1710 | 28.816987% |
| C | 5934 | 267 | 4.499494% |
| D | 5934 | 103 | 1.735760% |
Noise dominated data is calculated using 1-second bins in cleaned event files. If a bin has >2000 counts, and if more than 50% of those come from <1% of pixels, then it is considered to be noise-dominated and hence unusable.
| Quadrant | # 1 sec bins | Bins with >0 counts | Bins with >2000 counts | High rate bins dominated by noise | Noise dominated (total time) | Noise dominated (detector-on time) | Marked lightcurve |
|---|---|---|---|---|---|---|---|
| A | 8679 | 5936 | 4 | 4 | 0.05% | 0.07% | 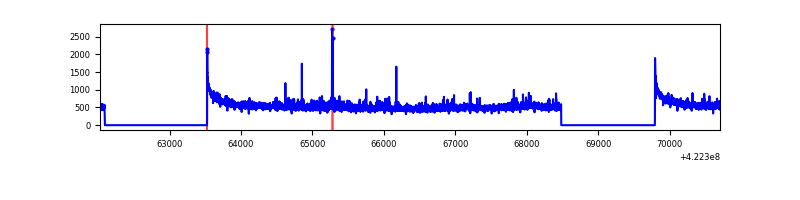 |
| B | 8679 | 5935 | 1570 | 1570 | 18.09% | 26.45% | 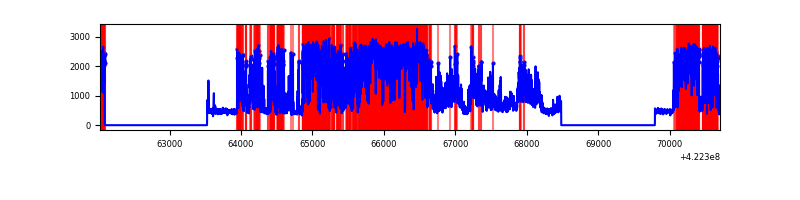 |
| C | 8679 | 5936 | 267 | 267 | 3.08% | 4.50% | 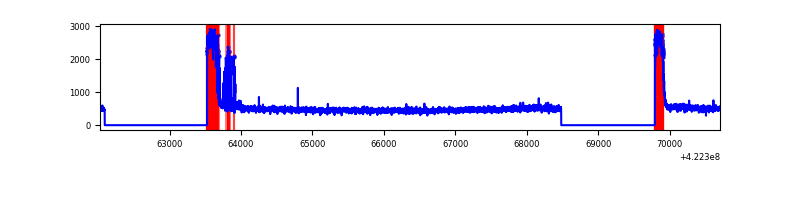 |
| D | 8678 | 5935 | 86 | 86 | 0.99% | 1.45% | 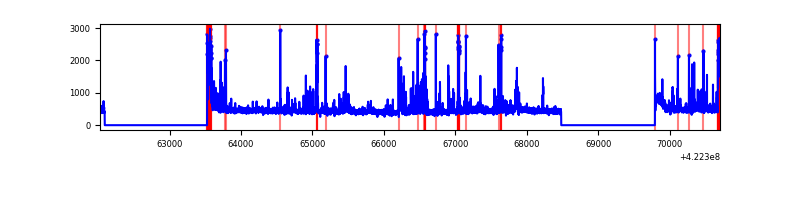 |
Top three noisy pixels from each quadrant. If the there are fewer than three noisy pixels in the level2.evt file, extra rows are filled as -1
| Pixel properties | Quadrant properties | ||||||
|---|---|---|---|---|---|---|---|
| Quadrant | DetID | PixID | Counts | Sigma | Mean | Median | Sigma |
| A | 10 | 83 | 563721 | 4151.13 | 655 | 642 | 135.6 |
| A | 2 | 79 | 96445 | 706.28 | 655 | 642 | 135.6 |
| A | 13 | 248 | 19652 | 140.15 | 655 | 642 | 135.6 |
| B | 5 | 255 | 5407395 | 46412.81 | 595 | 578 | 116.5 |
| B | 0 | 190 | 42569 | 360.46 | 595 | 578 | 116.5 |
| B | 0 | 155 | 23321 | 195.23 | 595 | 578 | 116.5 |
| C | 0 | 10 | 646083 | 4424.53 | 619 | 621 | 145.9 |
| C | 15 | 214 | 249110 | 1703.35 | 619 | 621 | 145.9 |
| C | 9 | 54 | 200647 | 1371.14 | 619 | 621 | 145.9 |
| D | 13 | 249 | 352931 | 2249.9 | 634 | 617 | 156.6 |
| D | 2 | 249 | 78257 | 495.81 | 634 | 617 | 156.6 |
| D | 5 | 222 | 72615 | 459.78 | 634 | 617 | 156.6 |
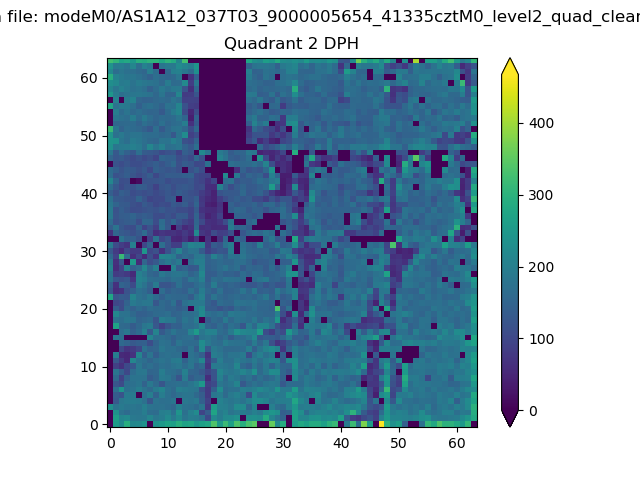
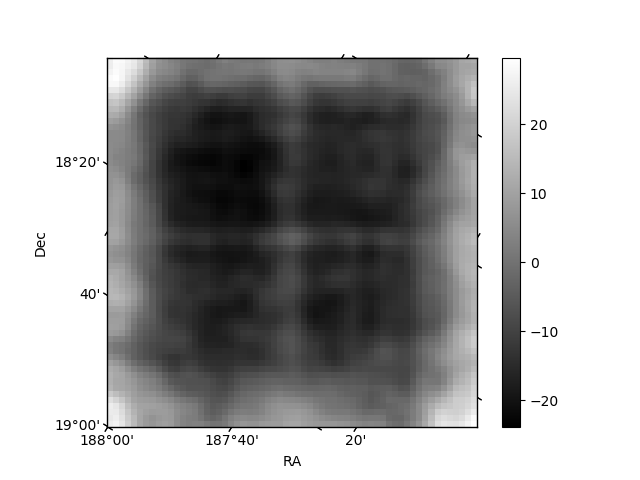
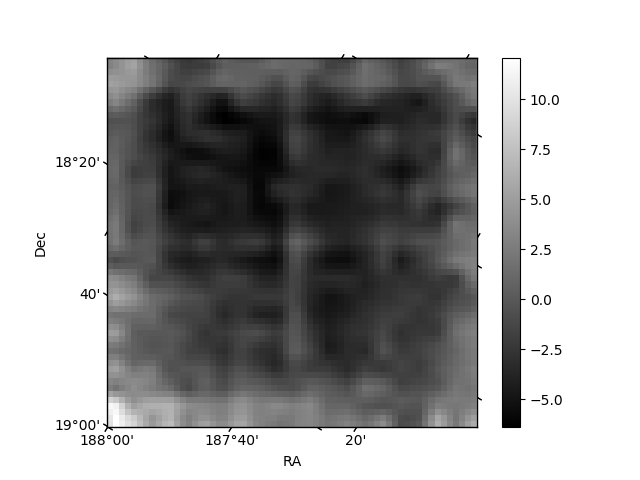
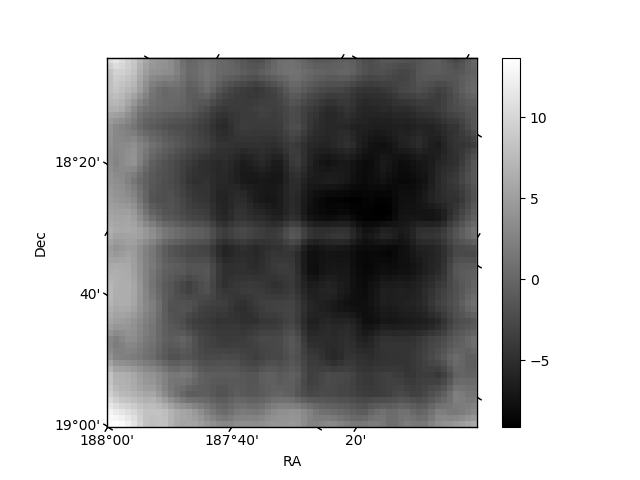
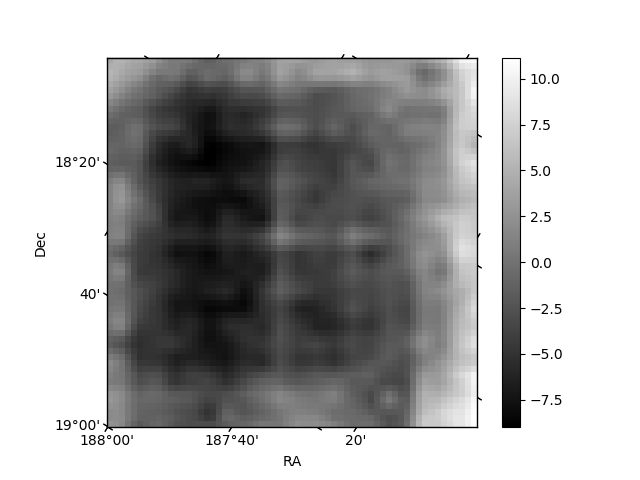
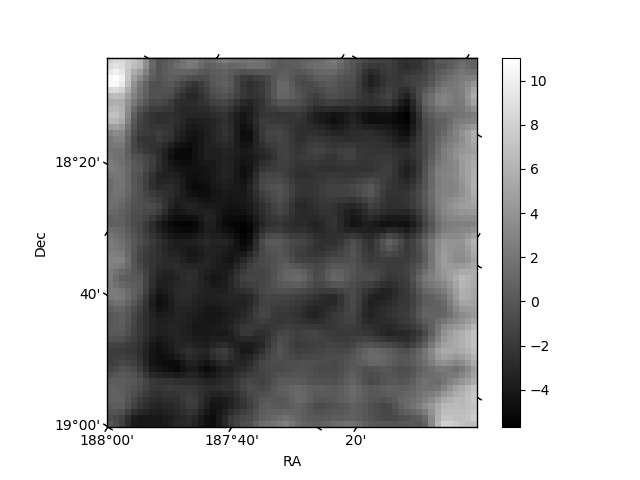
Histogram calculated using DETX and DETY for each event in the final _common_clean file
| Quadrant A | 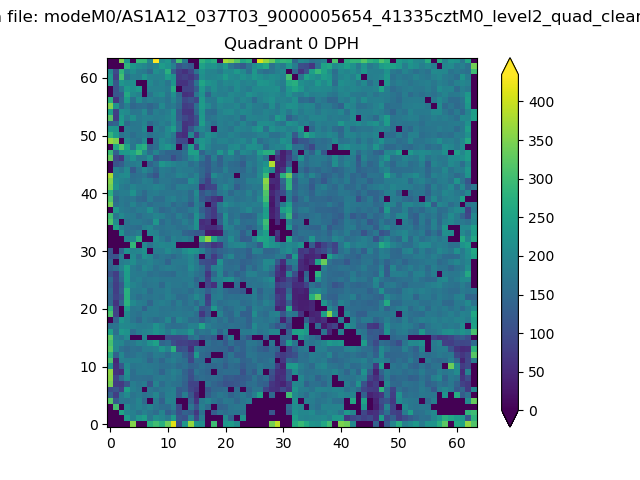 |
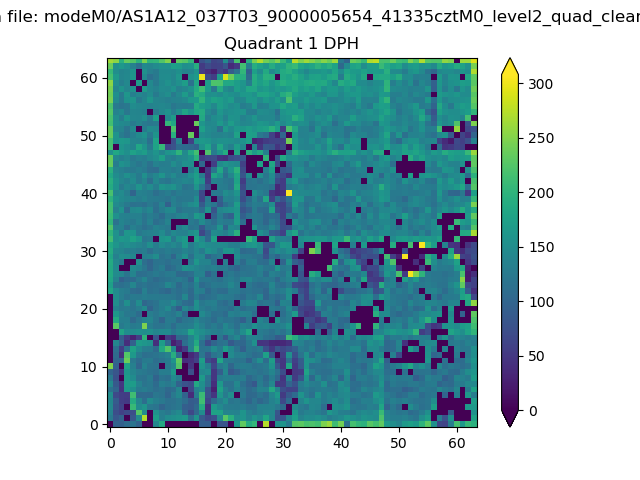 |
Quadrant B |
|---|---|---|---|
| Quadrant D | 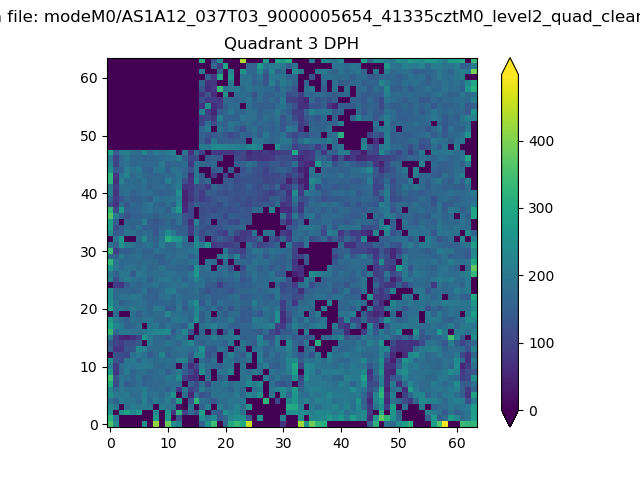 |
 |
Quadrant C |
| Plot type | Count rate plots | Images |
|---|---|---|
| Comparison with Poisson distribution Blue bars denote a histogram of data divided into 1 sec bins. Red curve is a Poisson curve with rate = median count rate of data. |
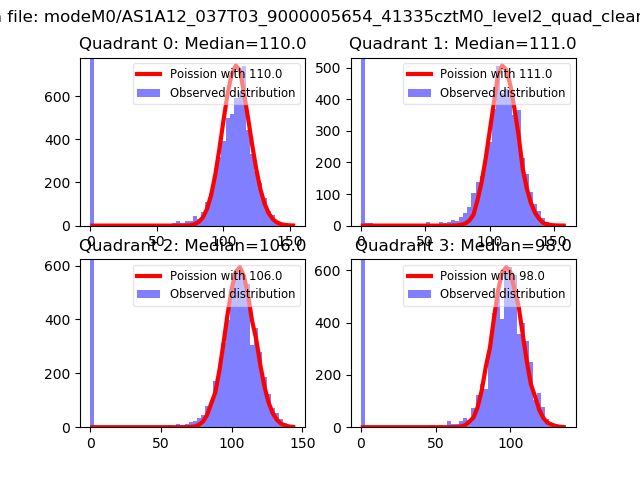 |
 |
| Quadrant-wise count rates Data is divided into 100 sec bins |
 |
|
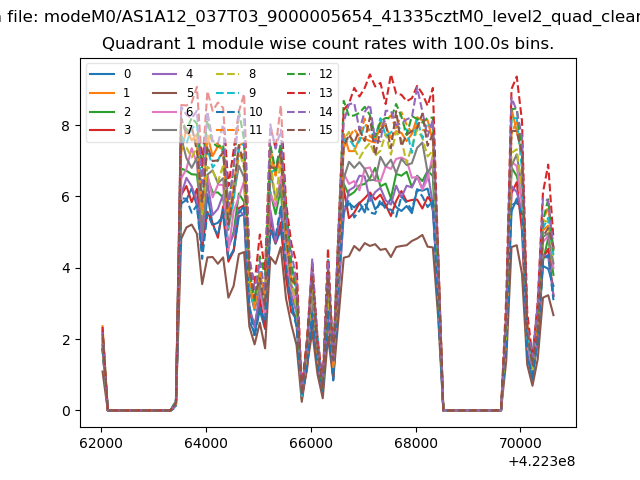
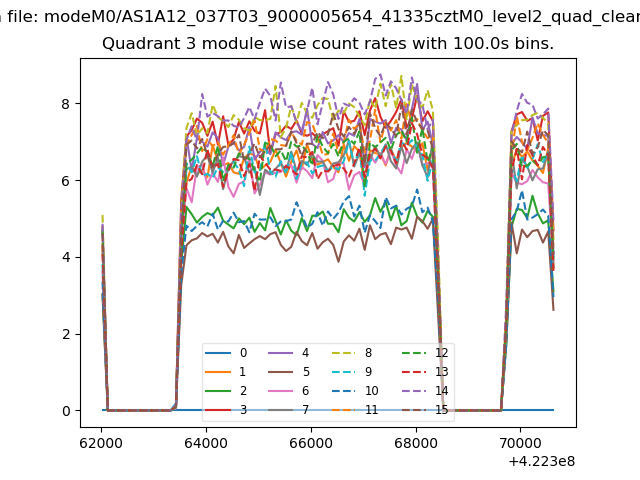
| Module-wise count rates for Quadrant A Data is divided into 100 sec bins |
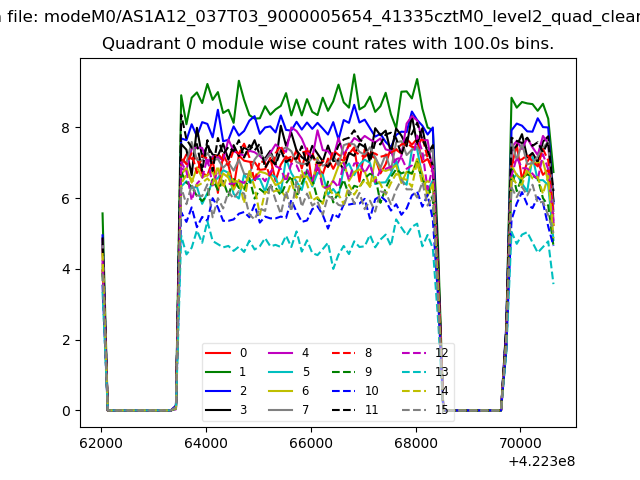 |
 |
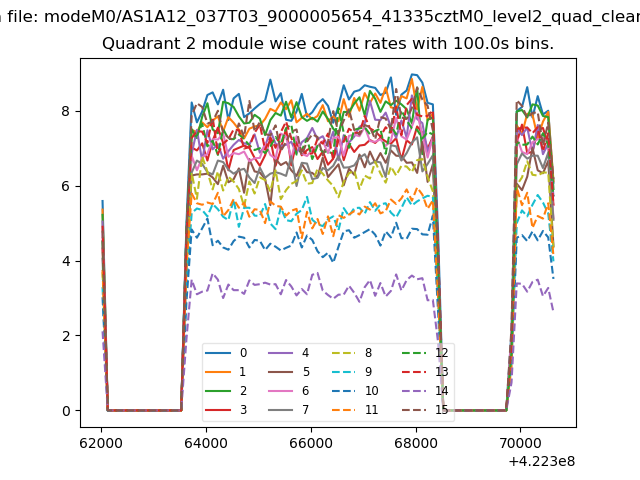
| Module-wise count rates for Quadrant B Data is divided into 100 sec bins |
 |
 |
| Module-wise count rates for Quadrant C Data is divided into 100 sec bins |
 |
 |
| Module-wise count rates for Quadrant D Data is divided into 100 sec bins |
 |
 |
| Parameter | Plot |
|---|---|
| CZT HV Monitor |  |
| D_VDD | 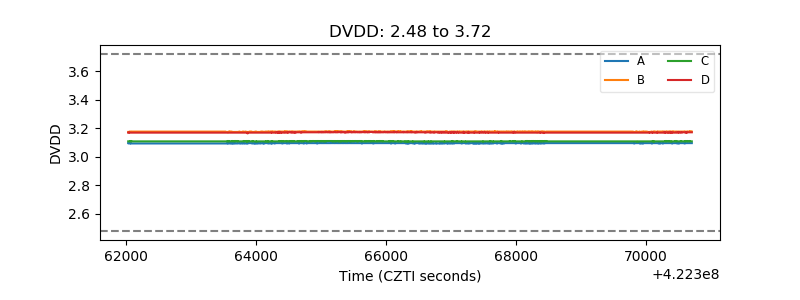 |
| Temperature 1 | 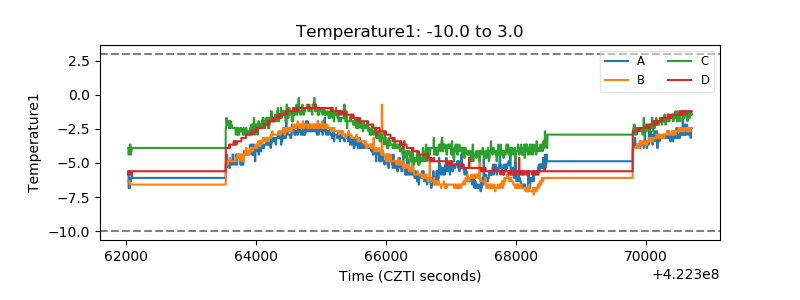 |
| Veto HV Monitor | 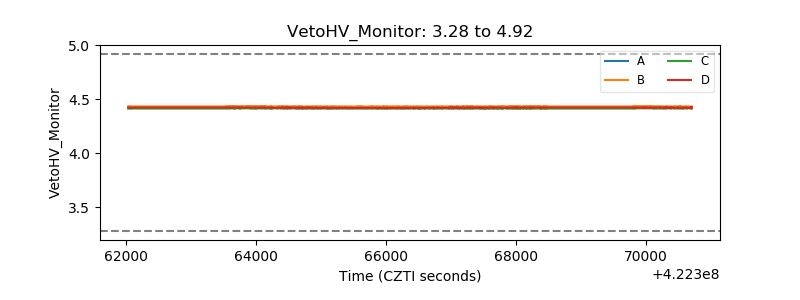 |
| Veto LLD | 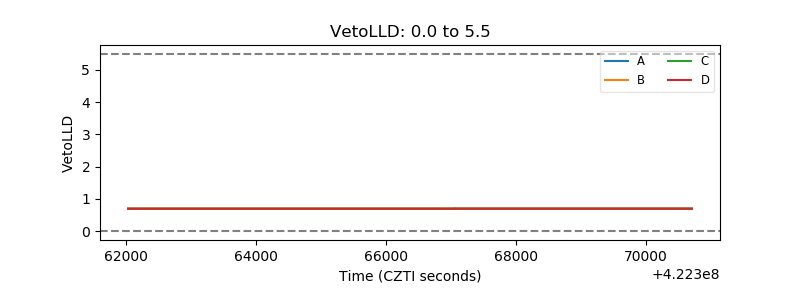 |
| Alpha Counter |  |
| _CPM_Rate | 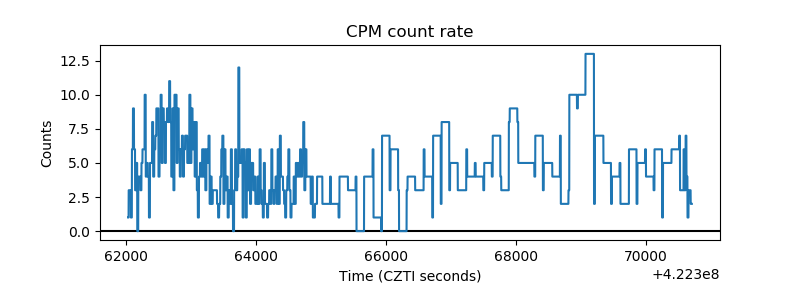 |
| CZT Counter | 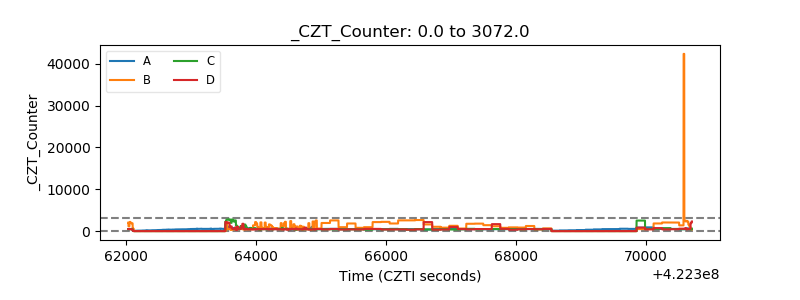 |
| +2.5 Volts monitor | 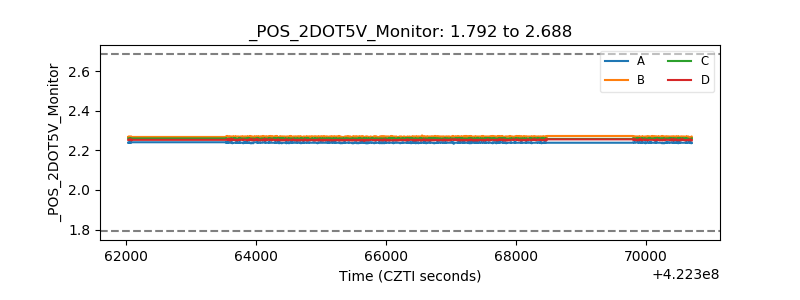 |
| +5 Volts monitor |  |
| _ROLL_ROT | 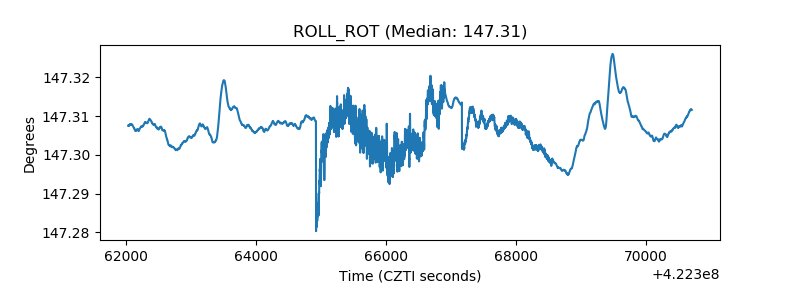 |
| _Roll_DEC | 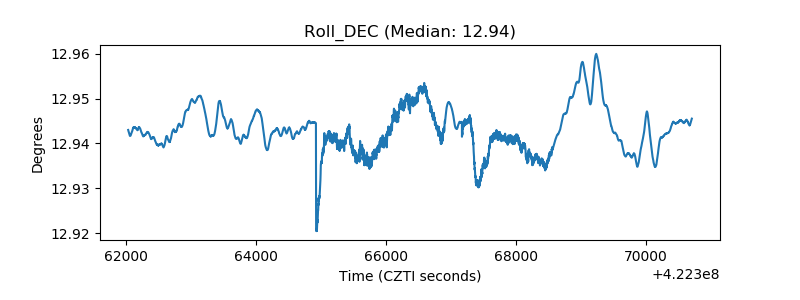 |
| _Roll_RA | 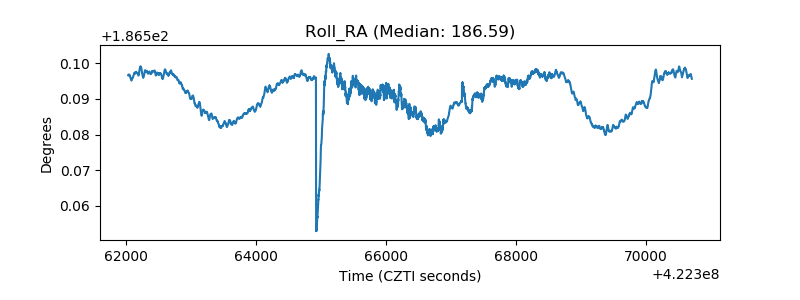 |
| Veto Counter | 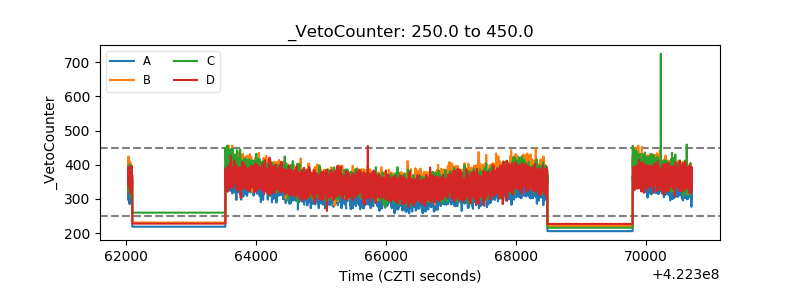 |