| Param | Original file | Final file |
|---|---|---|
| Filename | modeM0/AS1A12_037T03_9000005654_41339cztM0_level2.fits | modeM0/AS1A12_037T03_9000005654_41339cztM0_level2_quad_clean.evt |
| Size (bytes) | 148,893,120 | 30,015,360 |
| Size | 142.0 MB | 28.6 MB |
| Events in quadrant A | 1,146,440 | 209,818 |
| Events in quadrant B | 1,819,253 | 179,953 |
| Events in quadrant C | 1,228,469 | 191,982 |
| Events in quadrant D | 1,163,648 | 185,564 |
| Mode M9 | |||
|---|---|---|---|
| Quadrant | BADHDUFLAG | Total packets | Discarded packets |
| A | 0 | 11 | 0 |
| B | 0 | 11 | 0 |
| C | 0 | 11 | 0 |
| D | 0 | 12 | 0 |
| Mode M0 | |||
|---|---|---|---|
| Quadrant | BADHDUFLAG | Total packets | Discarded packets |
| A | 0 | 4611 | 1 |
| B | 0 | 6770 | 1 |
| C | 0 | 4754 | 1 |
| D | 0 | 4718 | 1 |
| Mode SS | |||
|---|---|---|---|
| Quadrant | BADHDUFLAG | Total packets | Discarded packets |
| A | 0 | 40 | 0 |
| B | 0 | 40 | 0 |
| C | 0 | 40 | 0 |
| D | 0 | 40 | 0 |
| Quadrant | Total seconds | Saturated seconds | Saturation percentage |
|---|---|---|---|
| A | 1943 | 35 | 1.801338% |
| B | 1943 | 386 | 19.866186% |
| C | 1943 | 113 | 5.815749% |
| D | 1943 | 46 | 2.367473% |
Noise dominated data is calculated using 1-second bins in cleaned event files. If a bin has >2000 counts, and if more than 50% of those come from <1% of pixels, then it is considered to be noise-dominated and hence unusable.
| Quadrant | # 1 sec bins | Bins with >0 counts | Bins with >2000 counts | High rate bins dominated by noise | Noise dominated (total time) | Noise dominated (detector-on time) | Marked lightcurve |
|---|---|---|---|---|---|---|---|
| A | 1943 | 1943 | 25 | 25 | 1.29% | 1.29% | 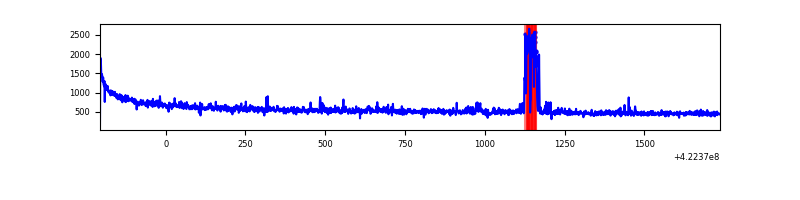 |
| B | 1943 | 1943 | 329 | 329 | 16.93% | 16.93% | 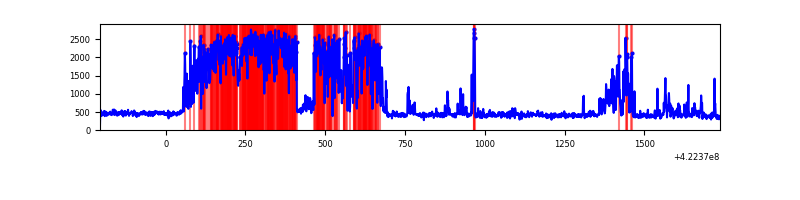 |
| C | 1943 | 1943 | 111 | 111 | 5.71% | 5.71% | 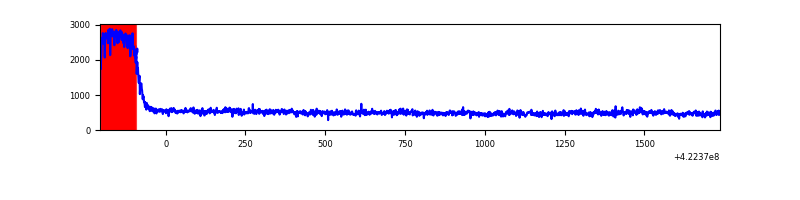 |
| D | 1943 | 1943 | 40 | 40 | 2.06% | 2.06% | 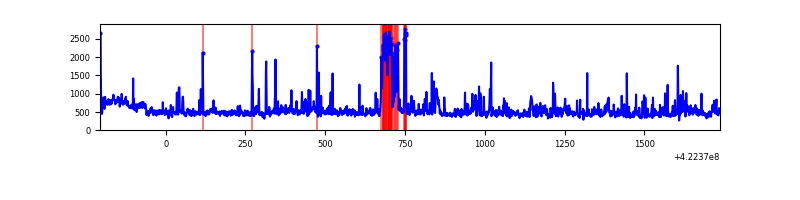 |
Top three noisy pixels from each quadrant. If the there are fewer than three noisy pixels in the level2.evt file, extra rows are filled as -1
| Pixel properties | Quadrant properties | ||||||
|---|---|---|---|---|---|---|---|
| Quadrant | DetID | PixID | Counts | Sigma | Mean | Median | Sigma |
| A | 10 | 83 | 225820 | 4931.75 | 213 | 208 | 45.7 |
| A | 13 | 248 | 73661 | 1605.64 | 213 | 208 | 45.7 |
| A | 2 | 79 | 20875 | 451.77 | 213 | 208 | 45.7 |
| B | 5 | 255 | 1022495 | 25079.86 | 197 | 191 | 40.8 |
| B | 0 | 190 | 18132 | 440.14 | 197 | 191 | 40.8 |
| B | 12 | 111 | 4862 | 114.59 | 197 | 191 | 40.8 |
| C | 0 | 10 | 363440 | 7500.37 | 199 | 200 | 48.4 |
| C | 15 | 214 | 82243 | 1694.07 | 199 | 200 | 48.4 |
| C | 8 | 222 | 3439 | 66.88 | 199 | 200 | 48.4 |
| D | 5 | 222 | 127193 | 2411.23 | 209 | 203 | 52.7 |
| D | 13 | 249 | 114653 | 2173.12 | 209 | 203 | 52.7 |
| D | 2 | 120 | 40412 | 763.47 | 209 | 203 | 52.7 |
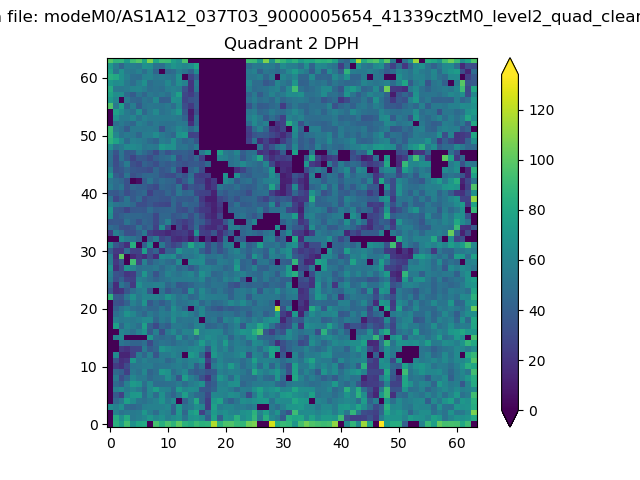
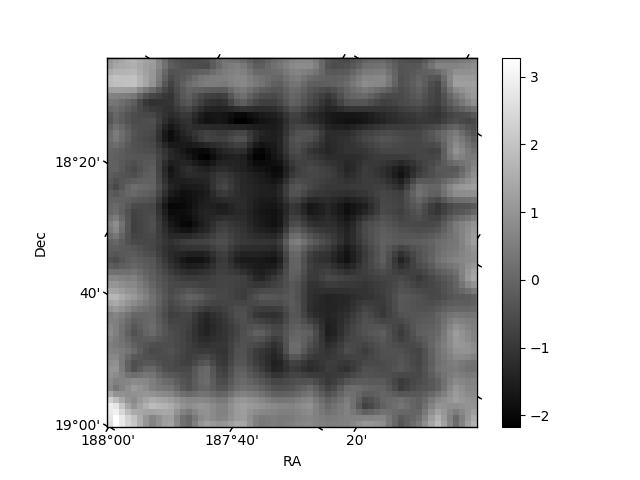
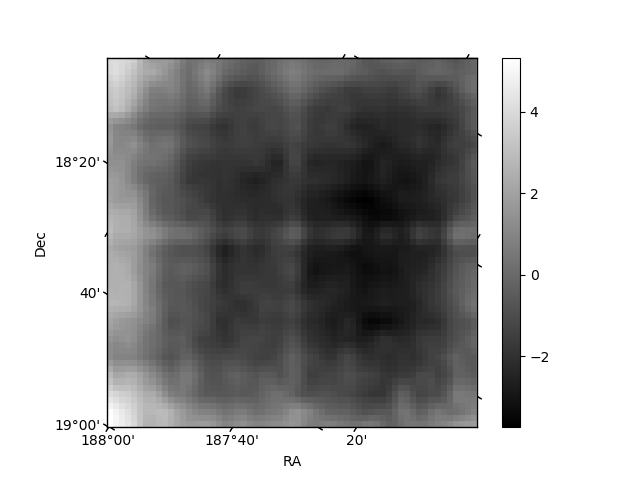
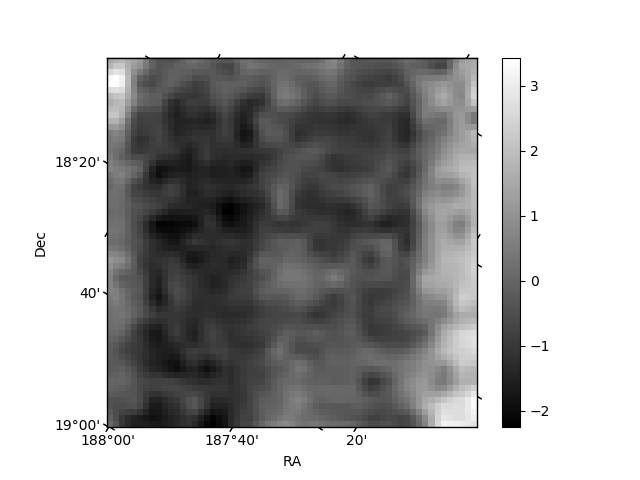
Histogram calculated using DETX and DETY for each event in the final _common_clean file
| Quadrant A | 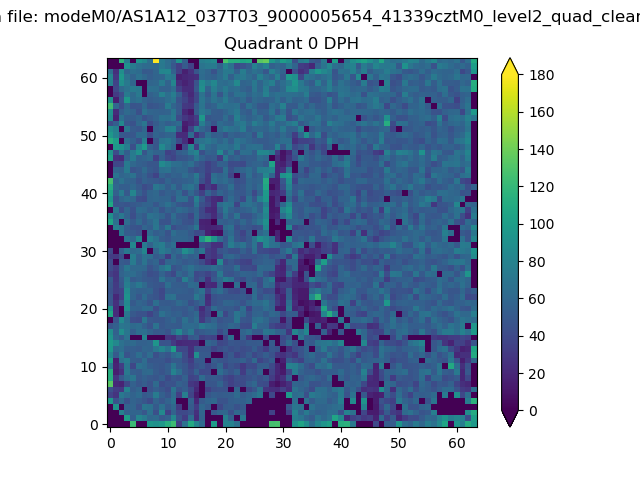 |
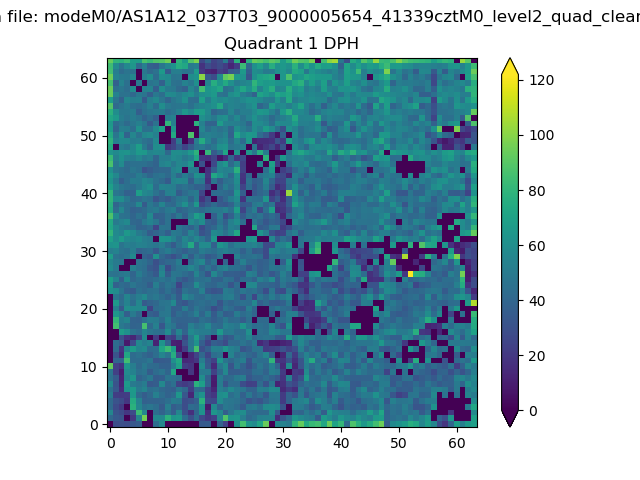 |
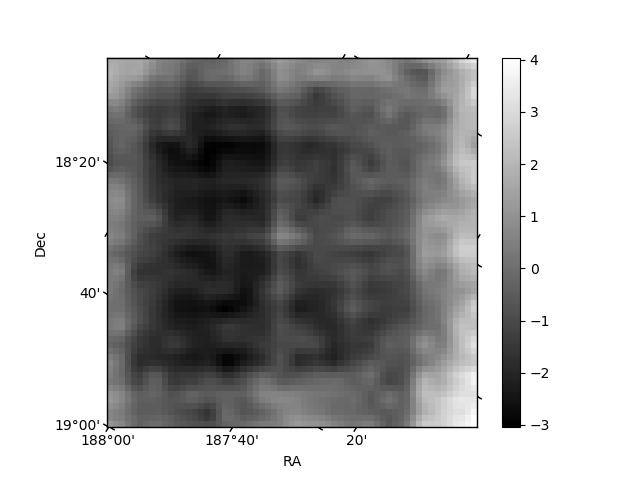
Quadrant B |
|---|---|---|---|
| Quadrant D | 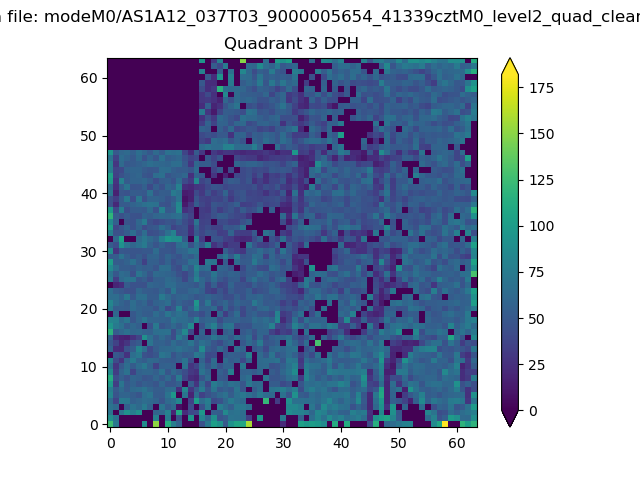 |
 |
Quadrant C |
| Plot type | Count rate plots | Images |
|---|---|---|
| Comparison with Poisson distribution Blue bars denote a histogram of data divided into 1 sec bins. Red curve is a Poisson curve with rate = median count rate of data. |
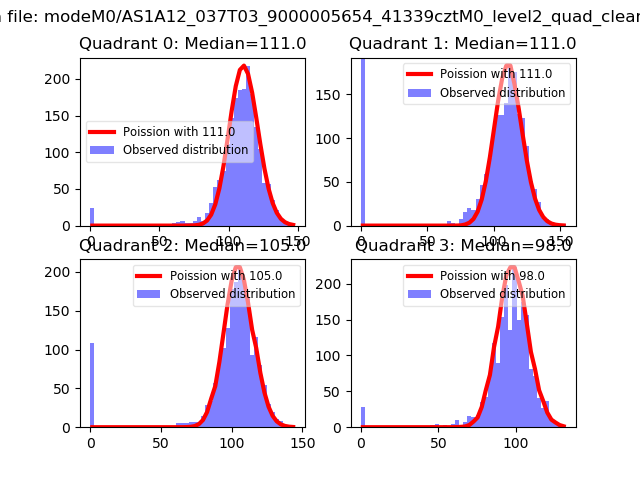 |
 |
| Quadrant-wise count rates Data is divided into 100 sec bins |
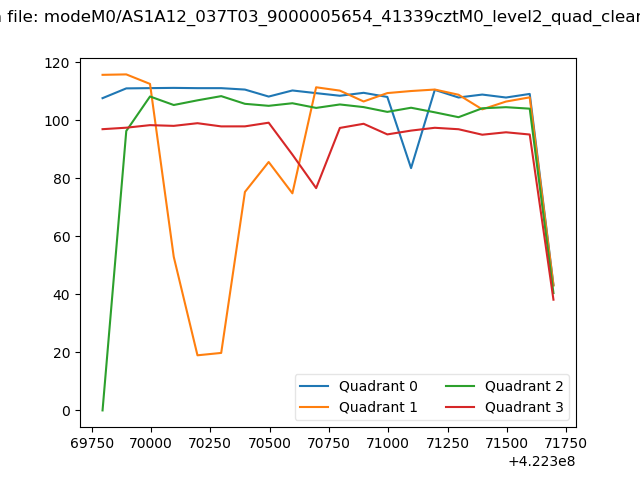 |
|
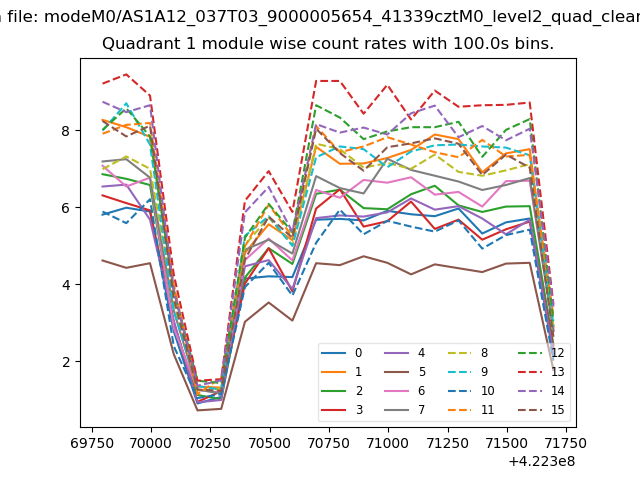
| Module-wise count rates for Quadrant A Data is divided into 100 sec bins |
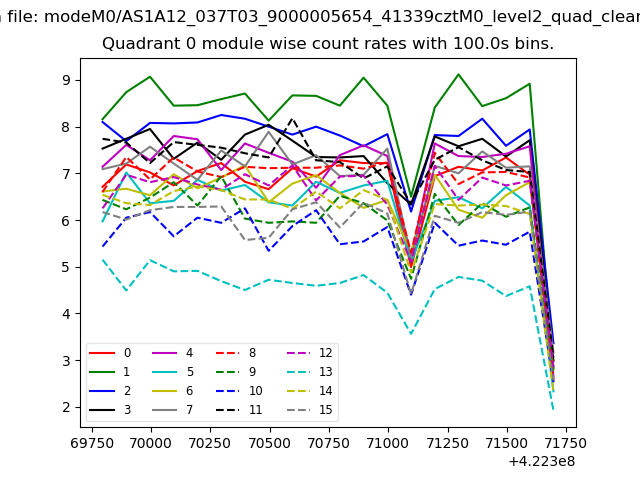 |
 |
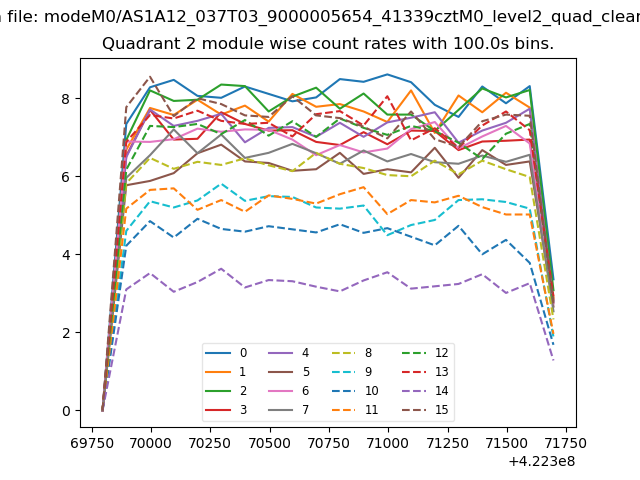
| Module-wise count rates for Quadrant B Data is divided into 100 sec bins |
 |
 |
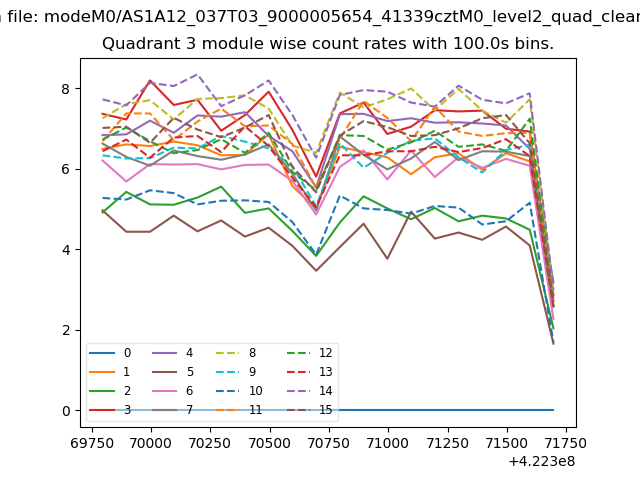
| Module-wise count rates for Quadrant C Data is divided into 100 sec bins |
 |
 |
| Module-wise count rates for Quadrant D Data is divided into 100 sec bins |
 |
 |
| Parameter | Plot |
|---|---|
| CZT HV Monitor | 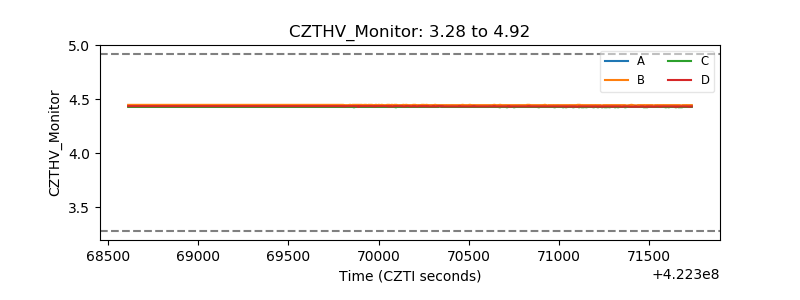 |
| D_VDD | 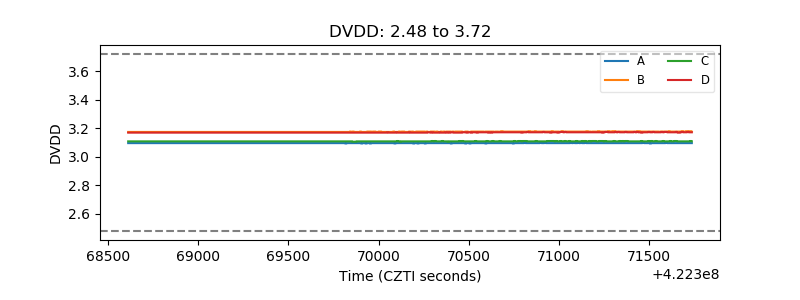 |
| Temperature 1 | 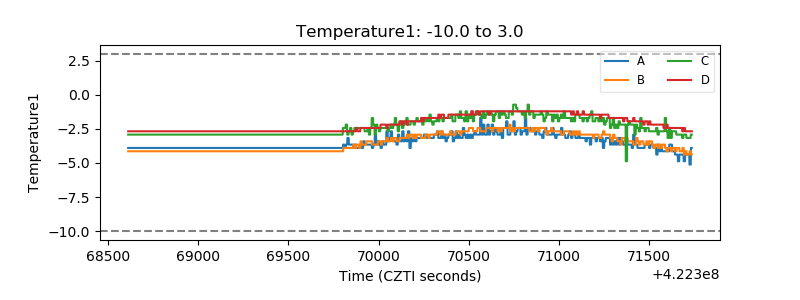 |
| Veto HV Monitor |  |
| Veto LLD | 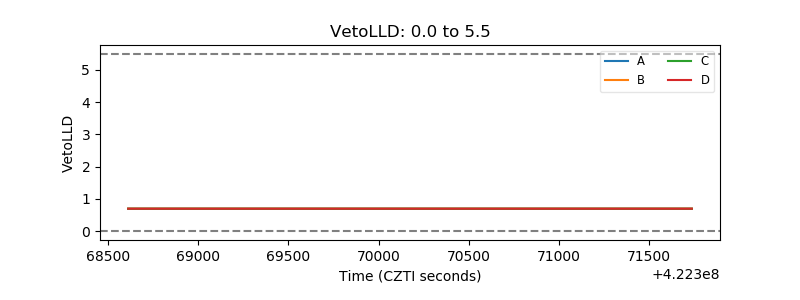 |
| Alpha Counter | 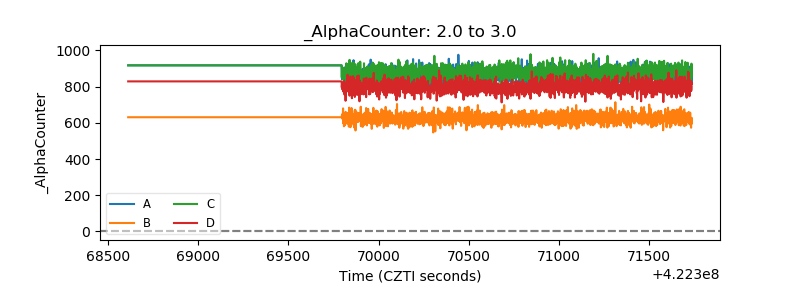 |
| _CPM_Rate |  |
| CZT Counter | 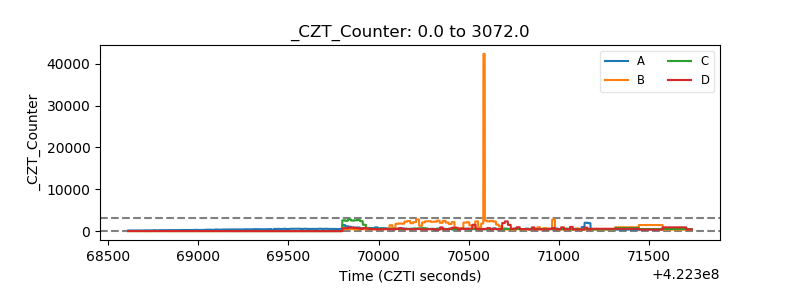 |
| +2.5 Volts monitor | 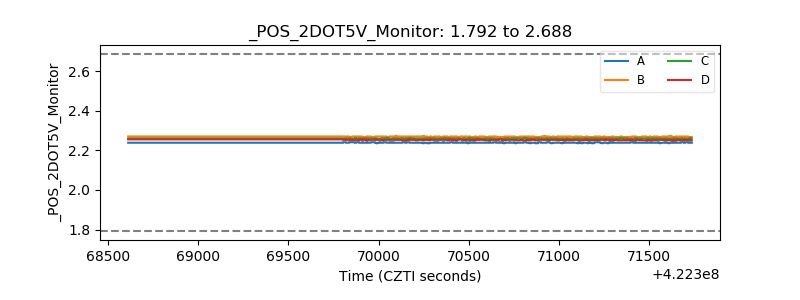 |
| +5 Volts monitor |  |
| _ROLL_ROT | 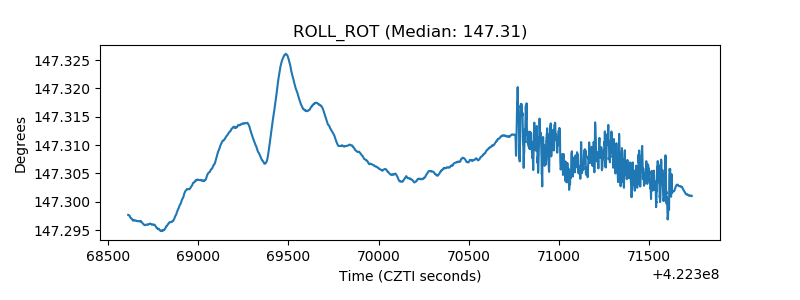 |
| _Roll_DEC | 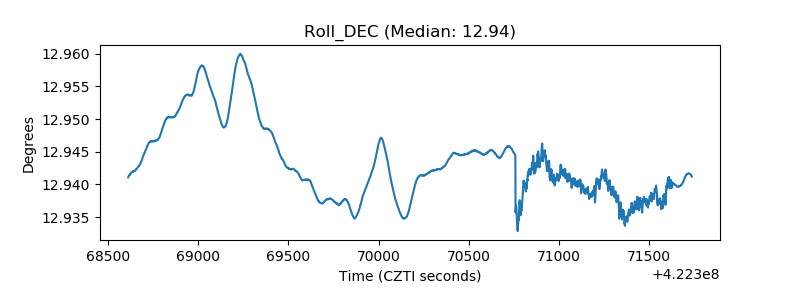 |
| _Roll_RA |  |
| Veto Counter | 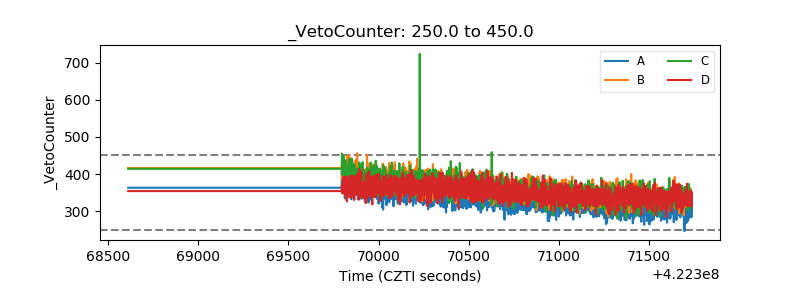 |