| Param | Original file | Final file |
|---|---|---|
| Filename | modeM0/AS1A12_037T03_9000005654_41344cztM0_level2.fits | modeM0/AS1A12_037T03_9000005654_41344cztM0_level2_quad_clean.evt |
| Size (bytes) | 112,737,600 | 24,258,240 |
| Size | 107.5 MB | 23.1 MB |
| Events in quadrant A | 858,830 | 167,627 |
| Events in quadrant B | 1,493,387 | 140,520 |
| Events in quadrant C | 769,170 | 162,721 |
| Events in quadrant D | 927,512 | 148,284 |
| Mode M0 | |||
|---|---|---|---|
| Quadrant | BADHDUFLAG | Total packets | Discarded packets |
| A | 0 | 3456 | 0 |
| B | 0 | 5557 | 0 |
| C | 0 | 3161 | 0 |
| D | 0 | 3766 | 0 |
| Mode SS | |||
|---|---|---|---|
| Quadrant | BADHDUFLAG | Total packets | Discarded packets |
| A | 0 | 32 | 0 |
| B | 0 | 32 | 0 |
| C | 0 | 32 | 0 |
| D | 0 | 32 | 0 |
| Quadrant | Total seconds | Saturated seconds | Saturation percentage |
|---|---|---|---|
| A | 1560 | 28 | 1.794872% |
| B | 1560 | 325 | 20.833333% |
| C | 1560 | 0 | 0.000000% |
| D | 1560 | 43 | 2.756410% |
Noise dominated data is calculated using 1-second bins in cleaned event files. If a bin has >2000 counts, and if more than 50% of those come from <1% of pixels, then it is considered to be noise-dominated and hence unusable.
| Quadrant | # 1 sec bins | Bins with >0 counts | Bins with >2000 counts | High rate bins dominated by noise | Noise dominated (total time) | Noise dominated (detector-on time) | Marked lightcurve |
|---|---|---|---|---|---|---|---|
| A | 1560 | 1560 | 25 | 25 | 1.60% | 1.60% | 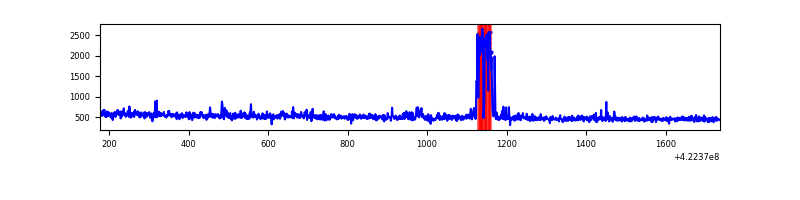 |
| B | 1560 | 1560 | 291 | 291 | 18.65% | 18.65% | 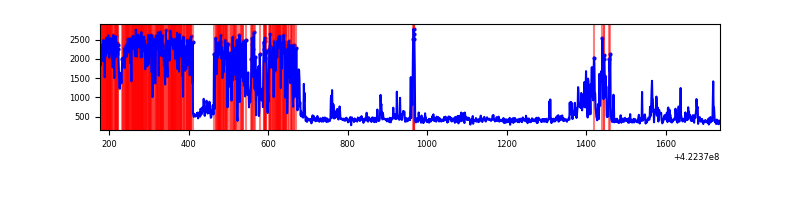 |
| C | 1560 | 1560 | 0 | 0 | 0.00% | 0.00% | 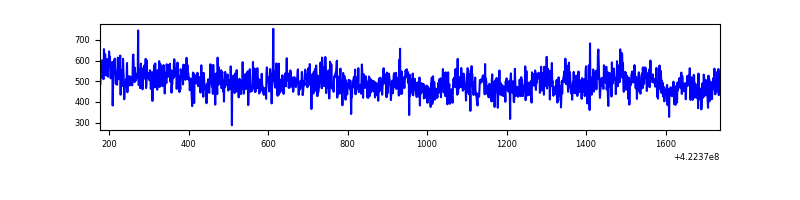 |
| D | 1560 | 1560 | 38 | 38 | 2.44% | 2.44% | 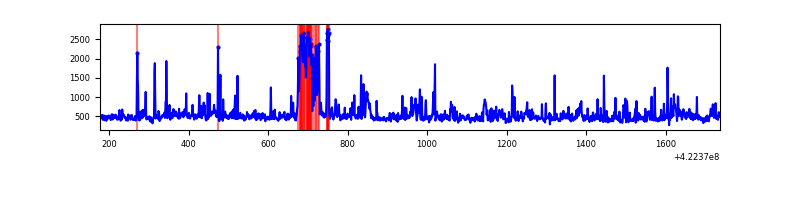 |
Top three noisy pixels from each quadrant. If the there are fewer than three noisy pixels in the level2.evt file, extra rows are filled as -1
| Pixel properties | Quadrant properties | ||||||
|---|---|---|---|---|---|---|---|
| Quadrant | DetID | PixID | Counts | Sigma | Mean | Median | Sigma |
| A | 10 | 83 | 118723 | 3217.38 | 168 | 164 | 36.8 |
| A | 13 | 248 | 73615 | 1993.27 | 168 | 164 | 36.8 |
| A | 2 | 79 | 17070 | 458.79 | 168 | 164 | 36.8 |
| B | 5 | 255 | 867517 | 27071.42 | 154 | 149 | 32.0 |
| B | 0 | 190 | 17402 | 538.48 | 154 | 149 | 32.0 |
| B | 12 | 111 | 3722 | 111.52 | 154 | 149 | 32.0 |
| C | 15 | 214 | 64215 | 1590.57 | 164 | 164 | 40.3 |
| C | 0 | 10 | 59441 | 1472.02 | 164 | 164 | 40.3 |
| C | 8 | 222 | 2568 | 59.7 | 164 | 164 | 40.3 |
| D | 5 | 222 | 120946 | 2881.98 | 165 | 160 | 41.9 |
| D | 13 | 249 | 112617 | 2683.25 | 165 | 160 | 41.9 |
| D | 1 | 52 | 19431 | 459.81 | 165 | 160 | 41.9 |
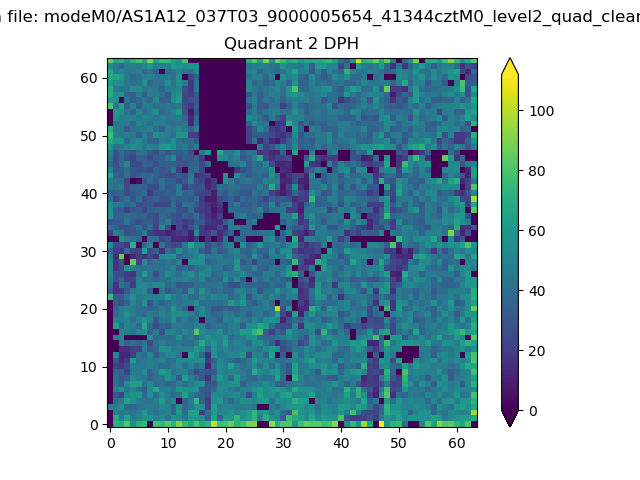
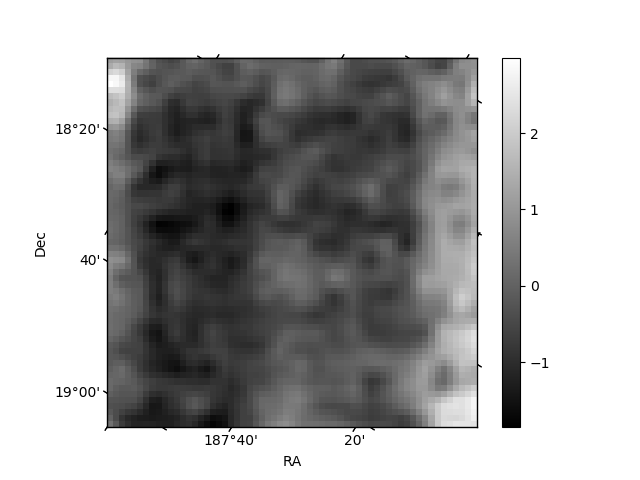
Histogram calculated using DETX and DETY for each event in the final _common_clean file
| Quadrant A | 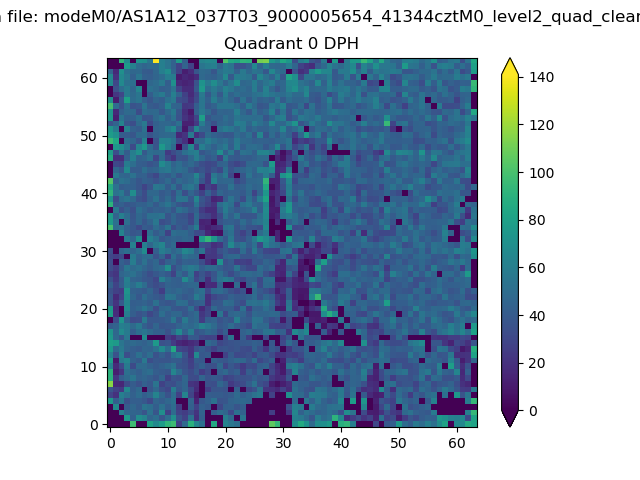 |
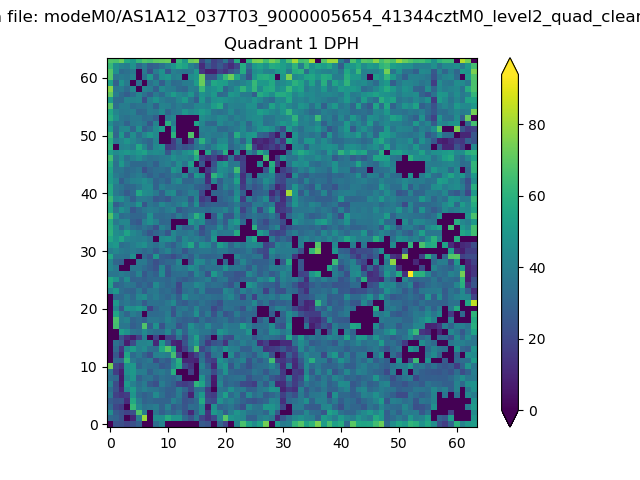 |
Quadrant B |
|---|---|---|---|
| Quadrant D | 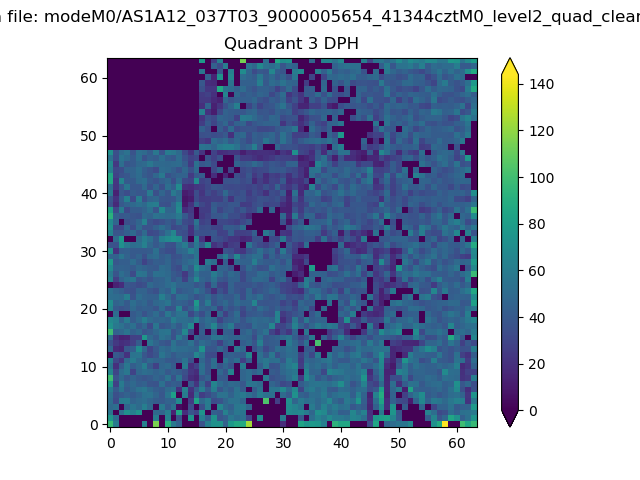 |
 |
Quadrant C |
| Plot type | Count rate plots | Images |
|---|---|---|
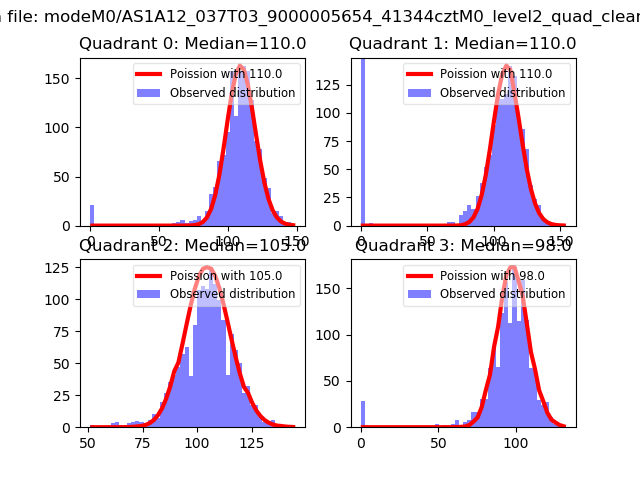
| Comparison with Poisson distribution Blue bars denote a histogram of data divided into 1 sec bins. Red curve is a Poisson curve with rate = median count rate of data. |
 |
 |
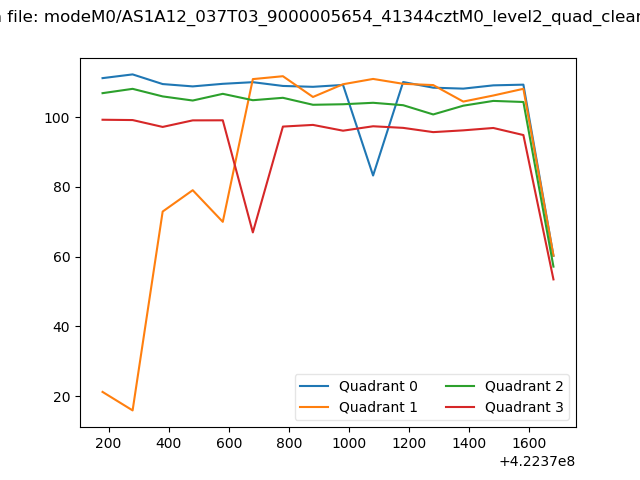
| Quadrant-wise count rates Data is divided into 100 sec bins |
 |
|
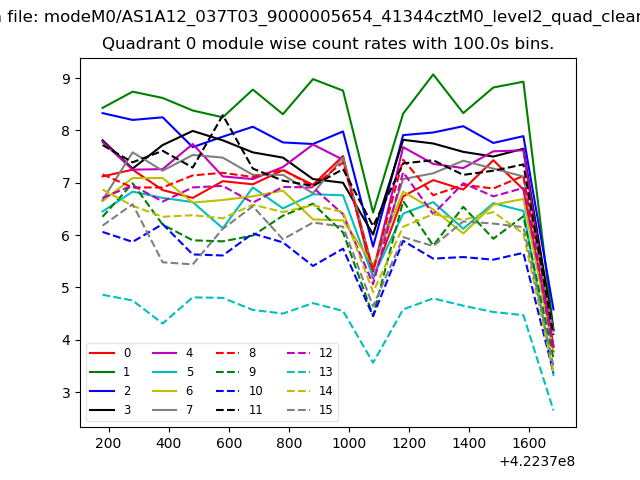
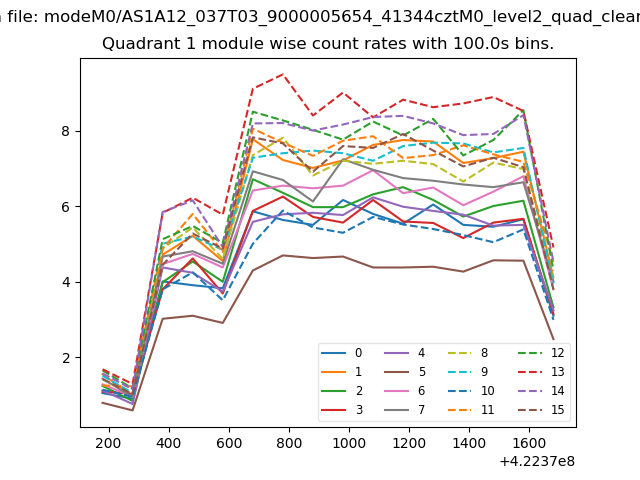
| Module-wise count rates for Quadrant A Data is divided into 100 sec bins |
 |
 |
| Module-wise count rates for Quadrant B Data is divided into 100 sec bins |
 |
 |
| Module-wise count rates for Quadrant C Data is divided into 100 sec bins |
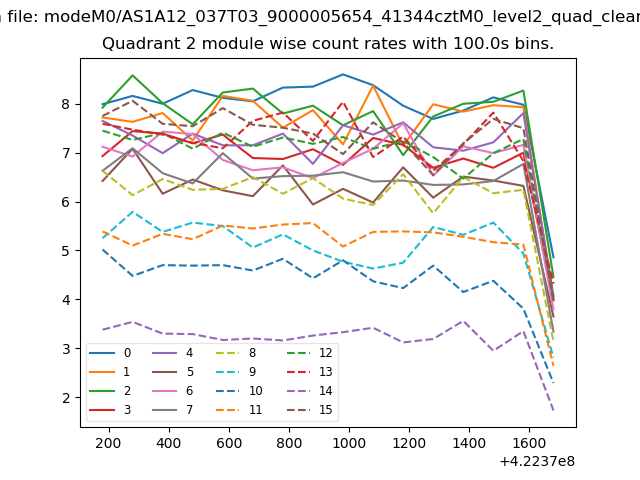 |
 |
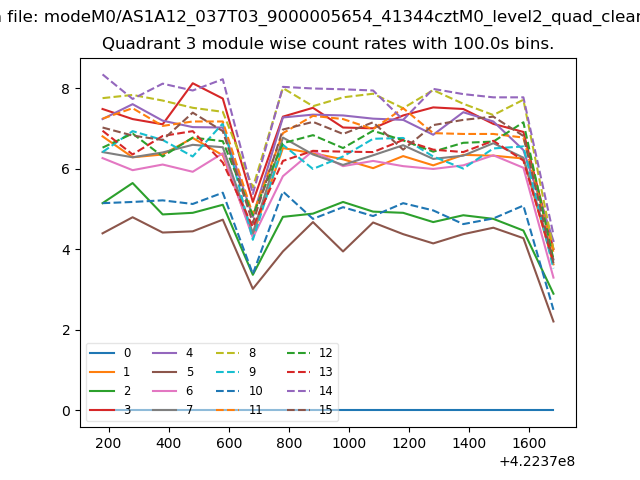
| Module-wise count rates for Quadrant D Data is divided into 100 sec bins |
 |
 |
| Parameter | Plot |
|---|---|
| CZT HV Monitor | 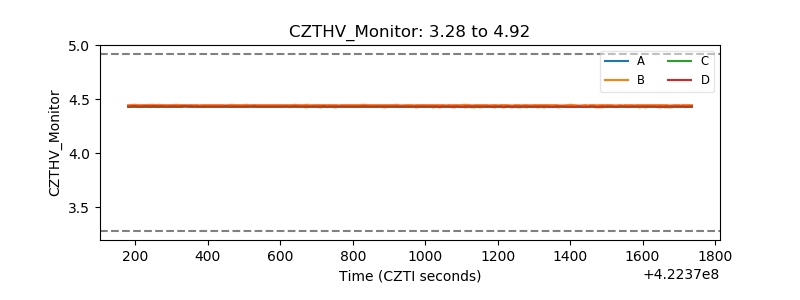 |
| D_VDD | 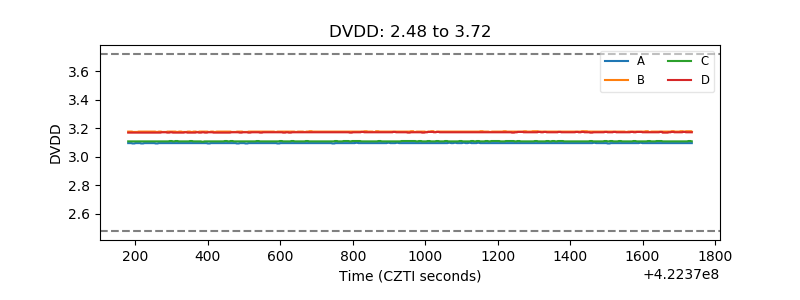 |
| Temperature 1 | 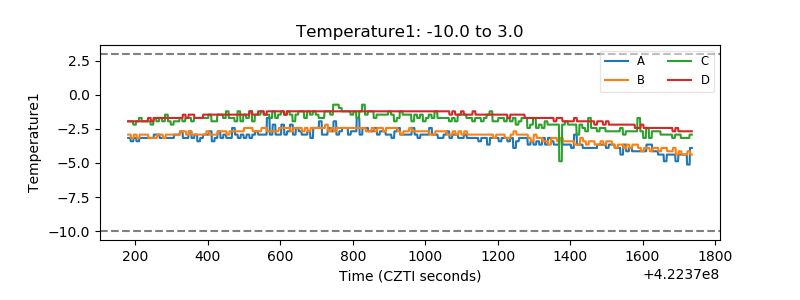 |
| Veto HV Monitor | 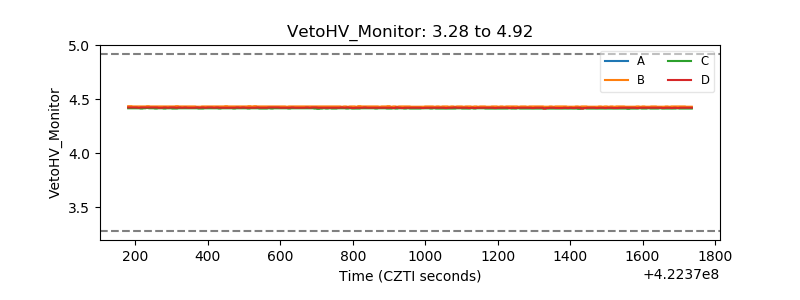 |
| Veto LLD |  |
| Alpha Counter | 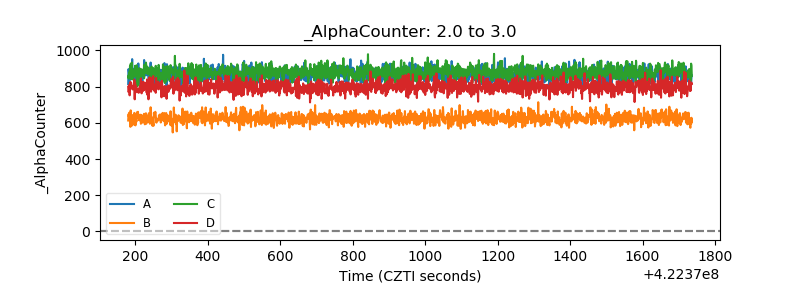 |
| _CPM_Rate | 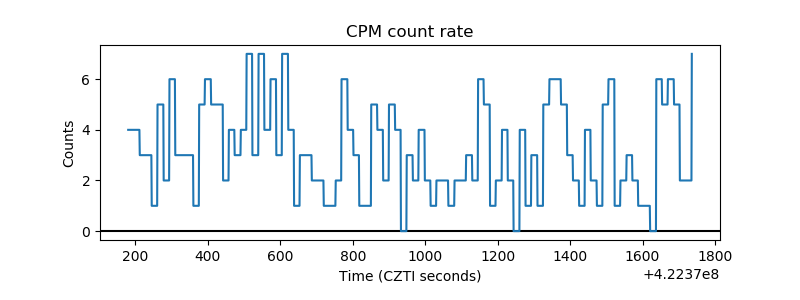 |
| CZT Counter | 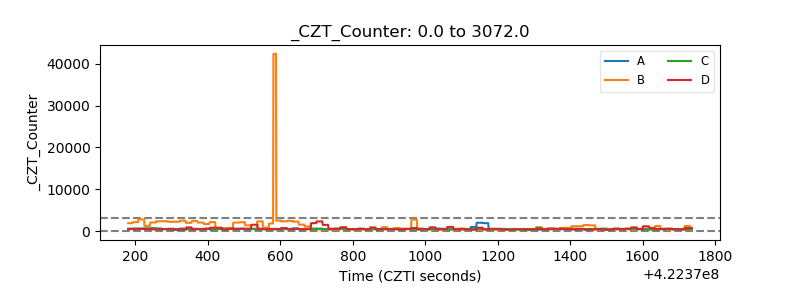 |
| +2.5 Volts monitor | 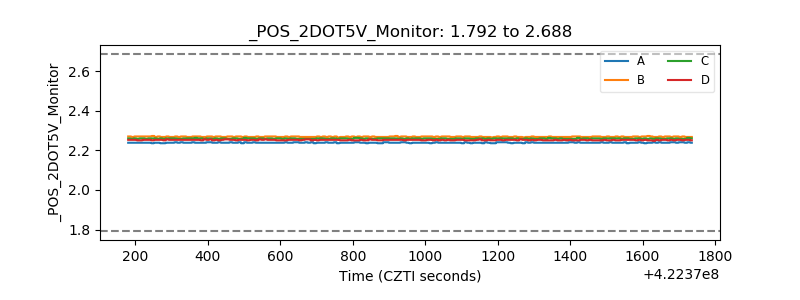 |
| +5 Volts monitor | 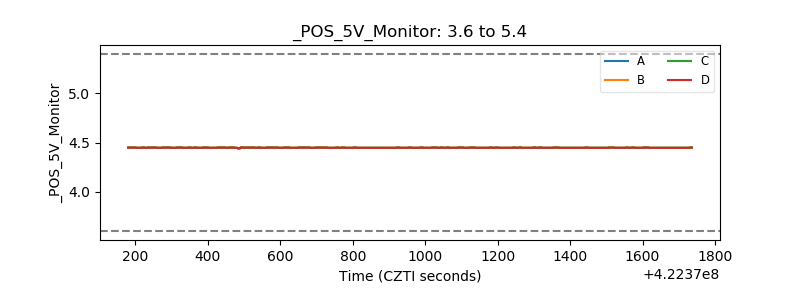 |
| _ROLL_ROT | 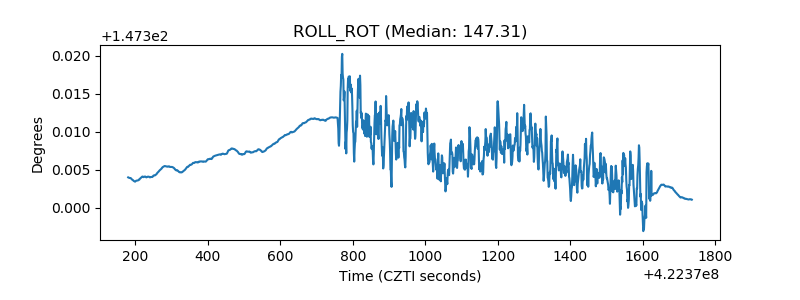 |
| _Roll_DEC | 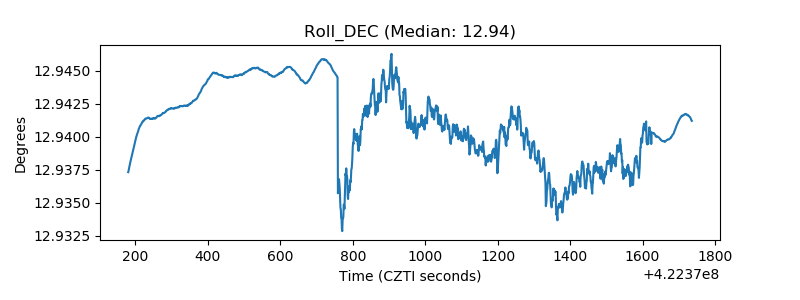 |
| _Roll_RA |  |
| Veto Counter | 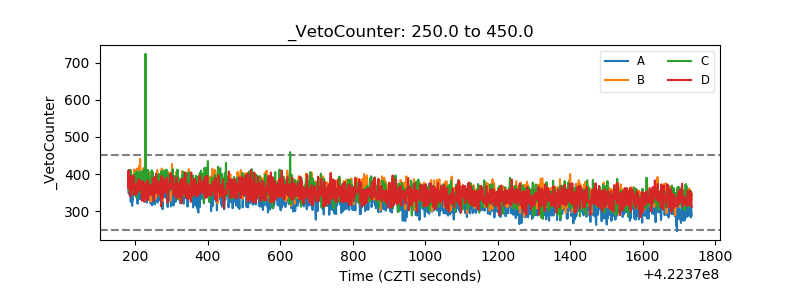 |