| Param | Original file | Final file |
|---|---|---|
| Filename | modeM0/AS1A12_101T03_9000005656_41339cztM0_level2.fits | modeM0/AS1A12_101T03_9000005656_41339cztM0_level2_quad_clean.evt |
| Size (bytes) | 755,542,080 | 205,225,920 |
| Size | 720.5 MB | 195.7 MB |
| Events in quadrant A | 6,495,282 | 1,369,434 |
| Events in quadrant B | 5,741,375 | 1,401,629 |
| Events in quadrant C | 7,460,952 | 1,312,438 |
| Events in quadrant D | 7,272,618 | 1,241,176 |
| Mode M0 | |||
|---|---|---|---|
| Quadrant | BADHDUFLAG | Total packets | Discarded packets |
| A | 0 | 27429 | 3 |
| B | 0 | 26310 | 3 |
| C | 0 | 30081 | 3 |
| D | 0 | 30849 | 3 |
| Mode M9 | |||
|---|---|---|---|
| Quadrant | BADHDUFLAG | Total packets | Discarded packets |
| A | 0 | 42 | 0 |
| B | 0 | 42 | 0 |
| C | 0 | 42 | 0 |
| D | 0 | 42 | 0 |
| Mode SS | |||
|---|---|---|---|
| Quadrant | BADHDUFLAG | Total packets | Discarded packets |
| A | 0 | 264 | 0 |
| B | 0 | 264 | 0 |
| C | 0 | 264 | 0 |
| D | 0 | 264 | 0 |
| Quadrant | Total seconds | Saturated seconds | Saturation percentage |
|---|---|---|---|
| A | 12861 | 30 | 0.233263% |
| B | 12861 | 42 | 0.326569% |
| C | 12861 | 378 | 2.939118% |
| D | 12861 | 312 | 2.425939% |
Noise dominated data is calculated using 1-second bins in cleaned event files. If a bin has >2000 counts, and if more than 50% of those come from <1% of pixels, then it is considered to be noise-dominated and hence unusable.
| Quadrant | # 1 sec bins | Bins with >0 counts | Bins with >2000 counts | High rate bins dominated by noise | Noise dominated (total time) | Noise dominated (detector-on time) | Marked lightcurve |
|---|---|---|---|---|---|---|---|
| A | 17066 | 12864 | 8 | 8 | 0.05% | 0.06% | 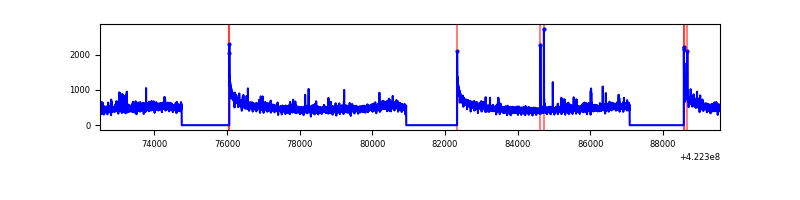 |
| B | 17066 | 12864 | 12 | 12 | 0.07% | 0.09% | 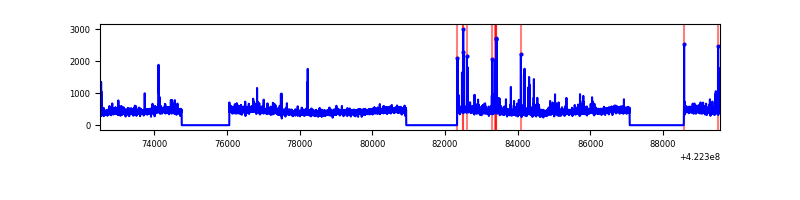 |
| C | 17066 | 12864 | 352 | 352 | 2.06% | 2.74% | 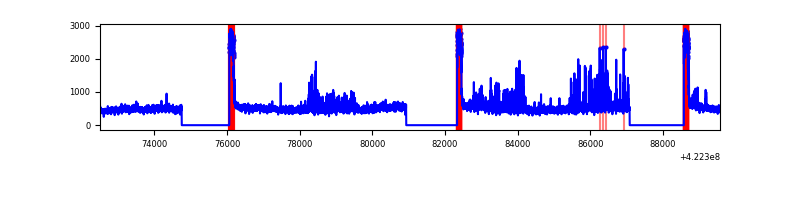 |
| D | 17066 | 12864 | 275 | 275 | 1.61% | 2.14% | 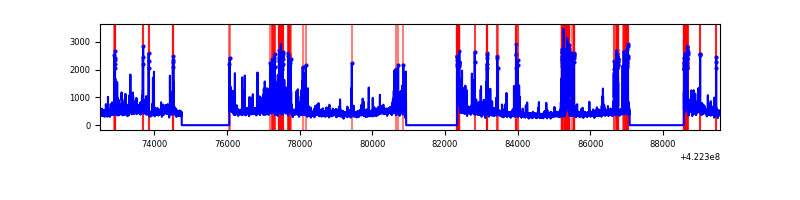 |
Top three noisy pixels from each quadrant. If the there are fewer than three noisy pixels in the level2.evt file, extra rows are filled as -1
| Pixel properties | Quadrant properties | ||||||
|---|---|---|---|---|---|---|---|
| Quadrant | DetID | PixID | Counts | Sigma | Mean | Median | Sigma |
| A | 10 | 83 | 1043070 | 3668.41 | 1383 | 1356 | 284.0 |
| A | 2 | 79 | 81828 | 283.38 | 1383 | 1356 | 284.0 |
| A | 7 | 3 | 17766 | 57.79 | 1383 | 1356 | 284.0 |
| B | 5 | 255 | 163962 | 611.56 | 1373 | 1329 | 265.9 |
| B | 0 | 190 | 141393 | 526.69 | 1373 | 1329 | 265.9 |
| B | 12 | 111 | 34877 | 126.15 | 1373 | 1329 | 265.9 |
| C | 0 | 10 | 1235138 | 4031.38 | 1325 | 1331 | 306.1 |
| C | 15 | 214 | 533362 | 1738.37 | 1325 | 1331 | 306.1 |
| C | 7 | 220 | 407320 | 1326.54 | 1325 | 1331 | 306.1 |
| D | 13 | 249 | 812923 | 2511.06 | 1337 | 1298 | 323.2 |
| D | 5 | 222 | 633984 | 1957.44 | 1337 | 1298 | 323.2 |
| D | 6 | 112 | 330459 | 1018.38 | 1337 | 1298 | 323.2 |
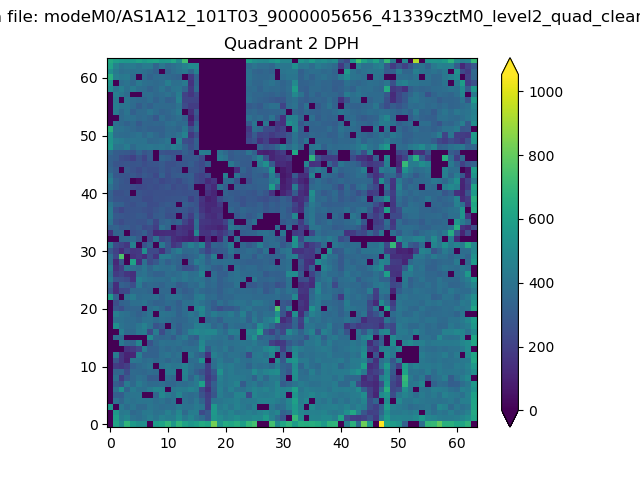
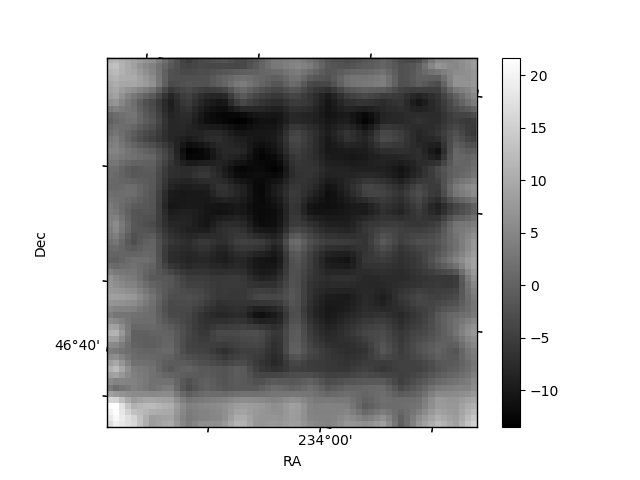
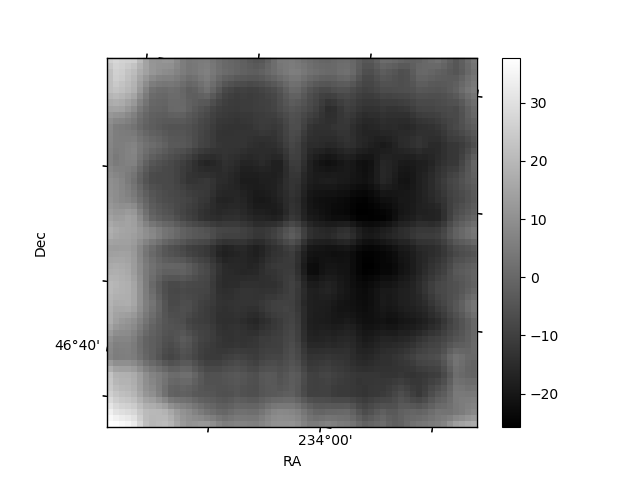
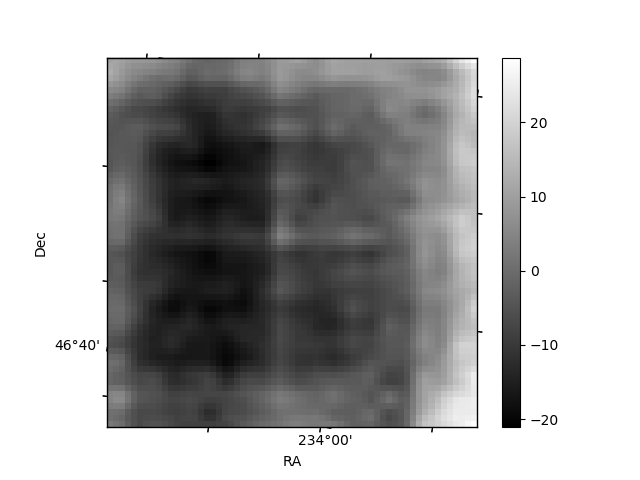
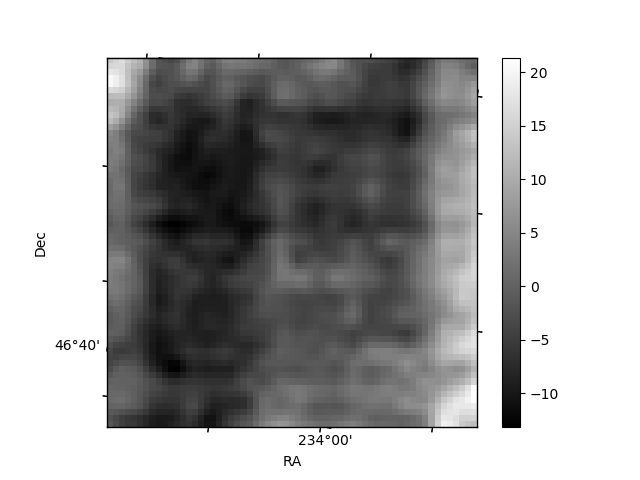
Histogram calculated using DETX and DETY for each event in the final _common_clean file
| Quadrant A |  |
 |
Quadrant B |
|---|---|---|---|
| Quadrant D | 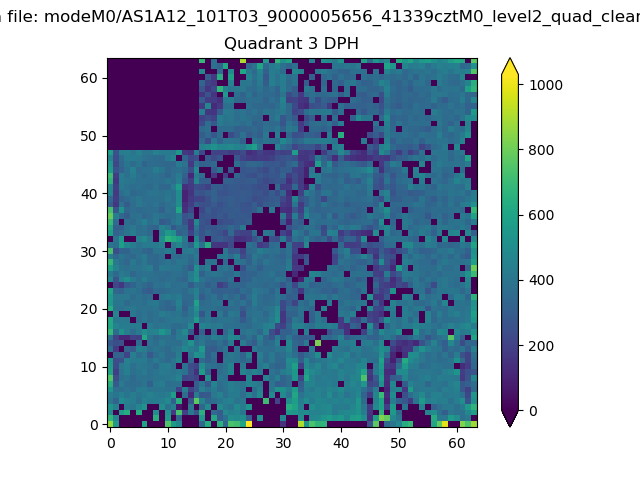 |
 |
Quadrant C |
| Plot type | Count rate plots | Images |
|---|---|---|
| Comparison with Poisson distribution Blue bars denote a histogram of data divided into 1 sec bins. Red curve is a Poisson curve with rate = median count rate of data. |
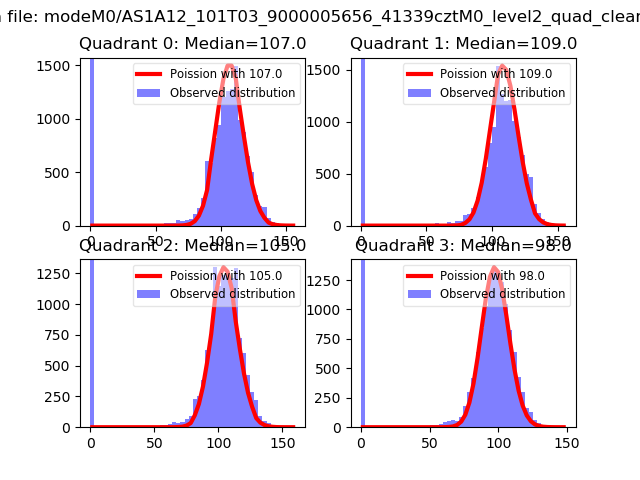 |
 |
| Quadrant-wise count rates Data is divided into 100 sec bins |
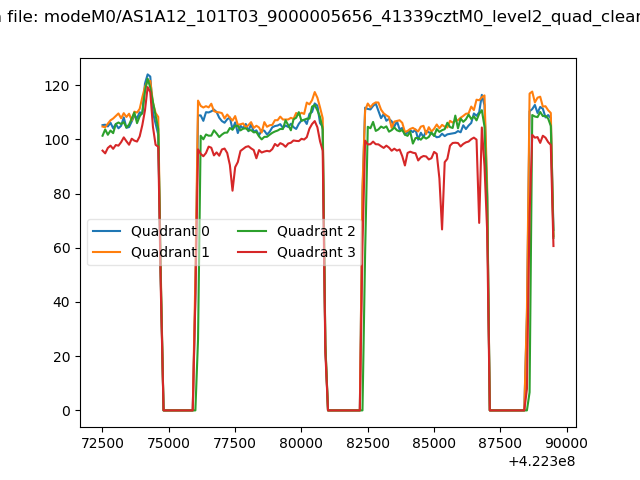 |
|
| Module-wise count rates for Quadrant A Data is divided into 100 sec bins |
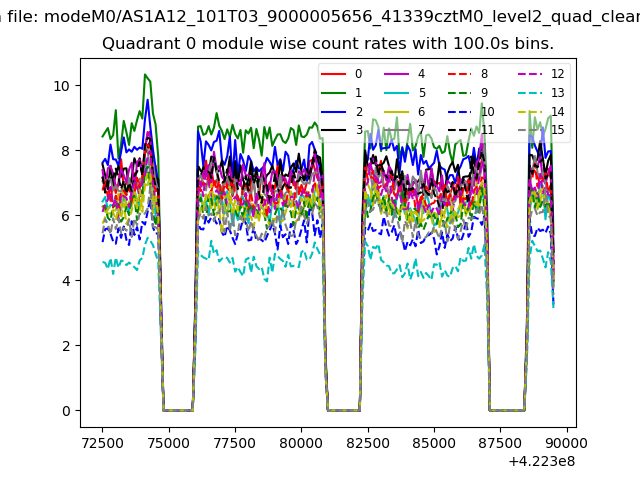 |
 |
| Module-wise count rates for Quadrant B Data is divided into 100 sec bins |
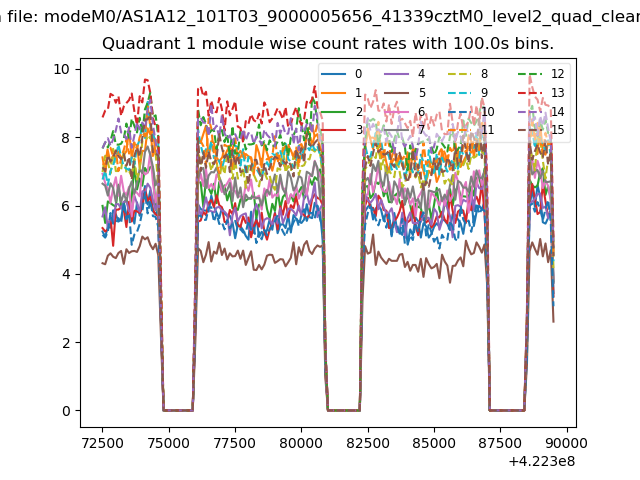 |
 |
| Module-wise count rates for Quadrant C Data is divided into 100 sec bins |
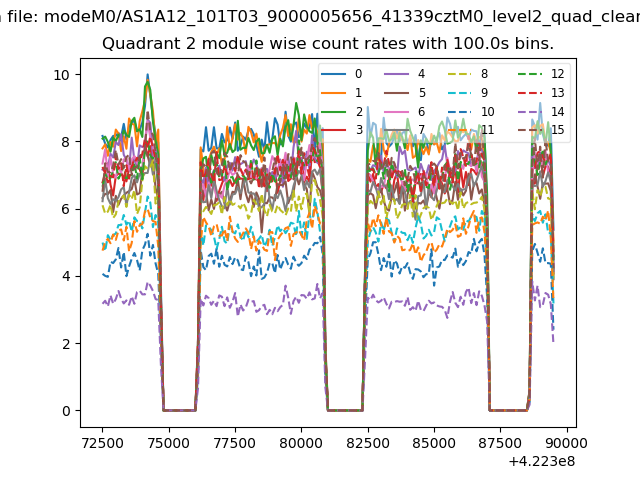 |
 |
| Module-wise count rates for Quadrant D Data is divided into 100 sec bins |
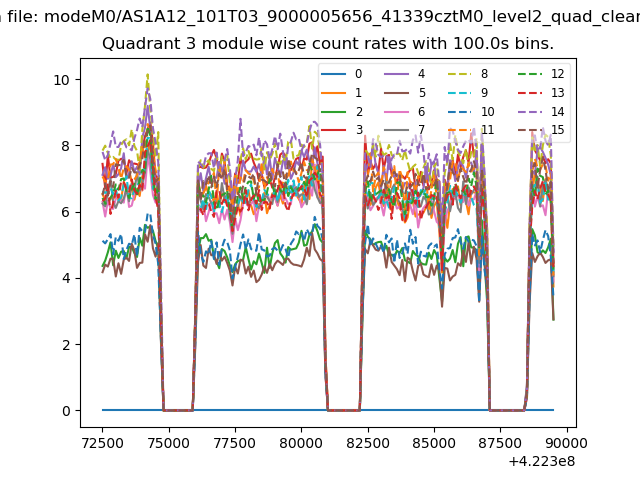 |
 |
| Parameter | Plot |
|---|---|
| CZT HV Monitor | 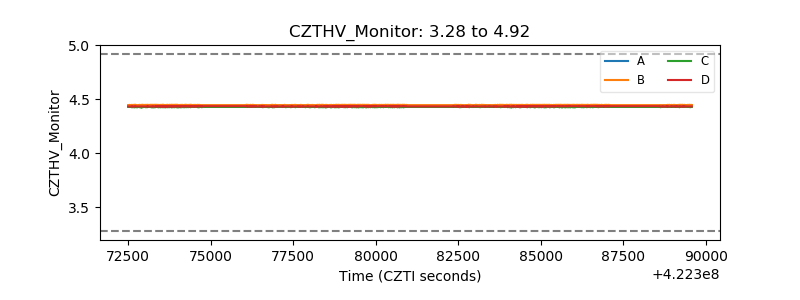 |
| D_VDD | 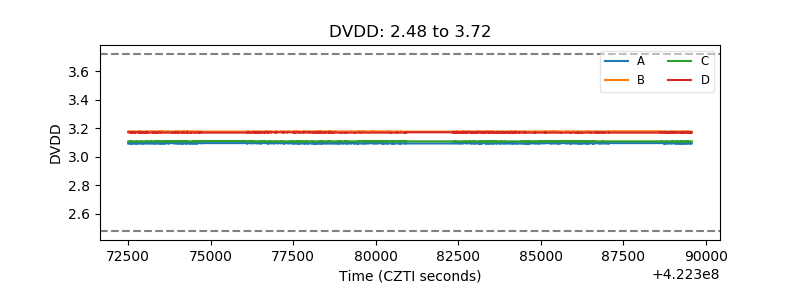 |
| Temperature 1 | 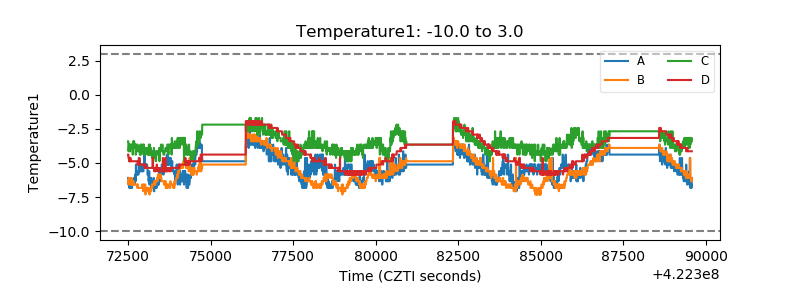 |
| Veto HV Monitor |  |
| Veto LLD | 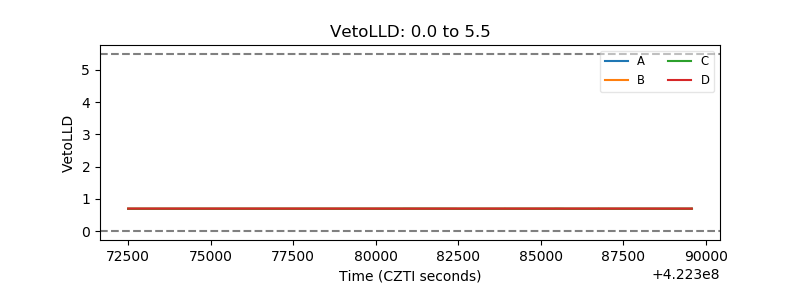 |
| Alpha Counter | 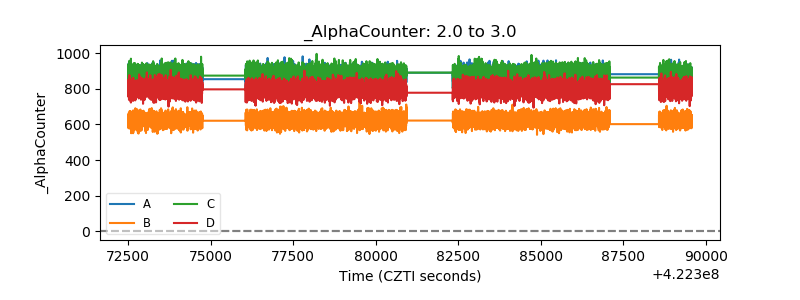 |
| _CPM_Rate | 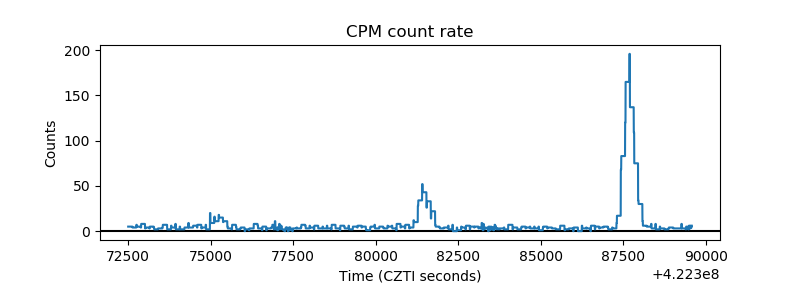 |
| CZT Counter | 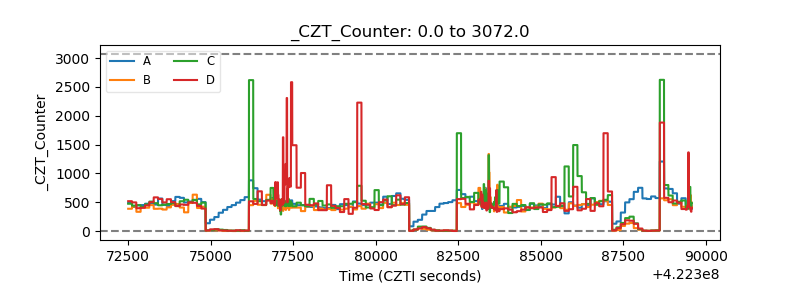 |
| +2.5 Volts monitor | 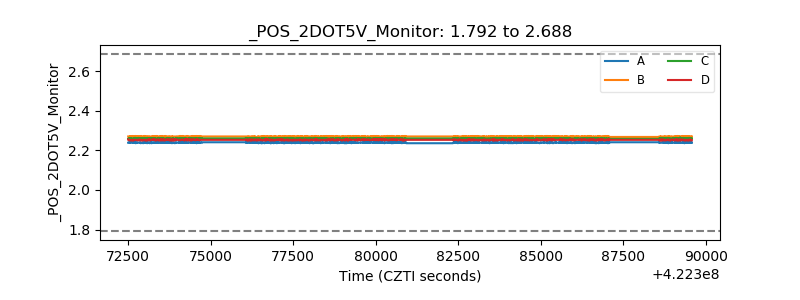 |
| +5 Volts monitor | 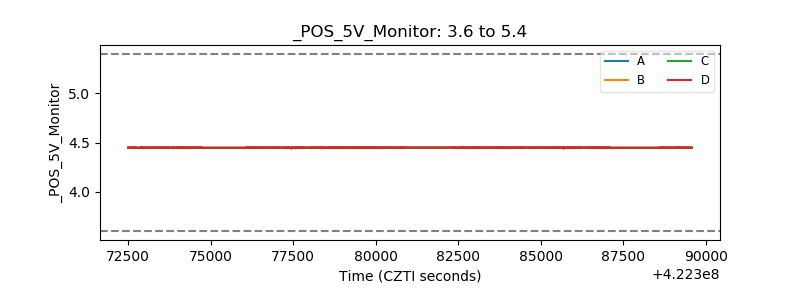 |
| _ROLL_ROT | 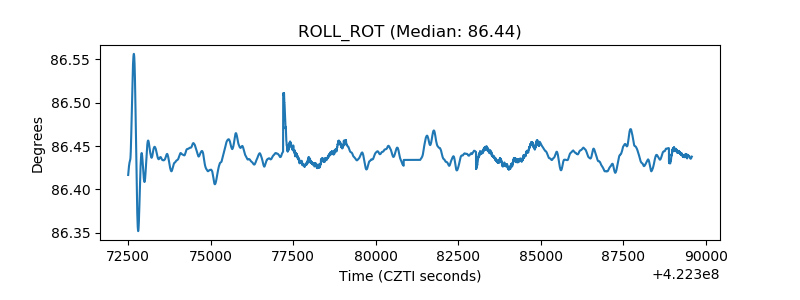 |
| _Roll_DEC | 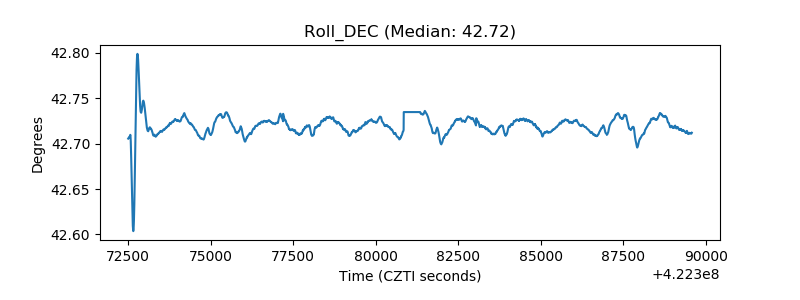 |
| _Roll_RA | 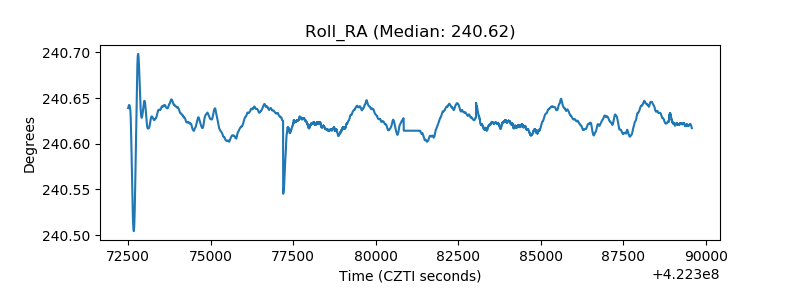 |
| Veto Counter | 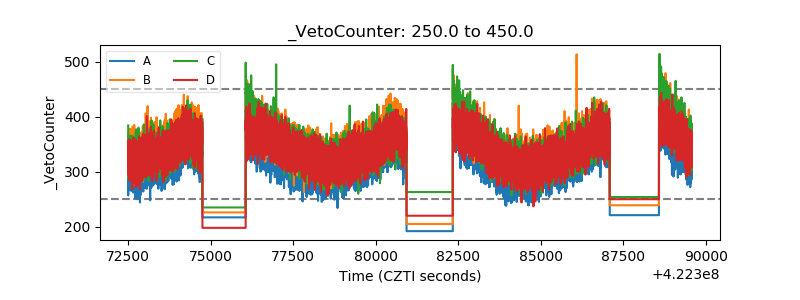 |