| Param | Original file | Final file |
|---|---|---|
| Filename | modeM0/AS1T05_105T01_9000005658_41339cztM0_level2.fits | modeM0/AS1T05_105T01_9000005658_41339cztM0_level2_quad_clean.evt |
| Size (bytes) | 245,750,400 | 65,842,560 |
| Size | 234.4 MB | 62.8 MB |
| Events in quadrant A | 2,003,015 | 451,197 |
| Events in quadrant B | 2,136,797 | 451,280 |
| Events in quadrant C | 2,221,637 | 422,965 |
| Events in quadrant D | 2,427,060 | 390,285 |
| Mode M9 | |||
|---|---|---|---|
| Quadrant | BADHDUFLAG | Total packets | Discarded packets |
| A | 0 | 16 | 0 |
| B | 0 | 16 | 0 |
| C | 0 | 16 | 0 |
| D | 0 | 16 | 0 |
| Mode SS | |||
|---|---|---|---|
| Quadrant | BADHDUFLAG | Total packets | Discarded packets |
| A | 0 | 80 | 0 |
| B | 0 | 80 | 0 |
| C | 0 | 80 | 0 |
| D | 0 | 80 | 0 |
| Mode M0 | |||
|---|---|---|---|
| Quadrant | BADHDUFLAG | Total packets | Discarded packets |
| A | 0 | 8399 | 2 |
| B | 0 | 9150 | 1 |
| C | 0 | 9096 | 1 |
| D | 0 | 10108 | 1 |
| Quadrant | Total seconds | Saturated seconds | Saturation percentage |
|---|---|---|---|
| A | 3943 | 7 | 0.177530% |
| B | 3943 | 86 | 2.181080% |
| C | 3943 | 141 | 3.575957% |
| D | 3943 | 189 | 4.793305% |
Noise dominated data is calculated using 1-second bins in cleaned event files. If a bin has >2000 counts, and if more than 50% of those come from <1% of pixels, then it is considered to be noise-dominated and hence unusable.
| Quadrant | # 1 sec bins | Bins with >0 counts | Bins with >2000 counts | High rate bins dominated by noise | Noise dominated (total time) | Noise dominated (detector-on time) | Marked lightcurve |
|---|---|---|---|---|---|---|---|
| A | 5556 | 3944 | 2 | 2 | 0.04% | 0.05% | 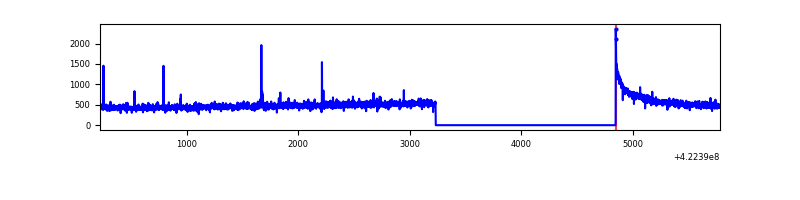 |
| B | 5556 | 3944 | 56 | 56 | 1.01% | 1.42% | 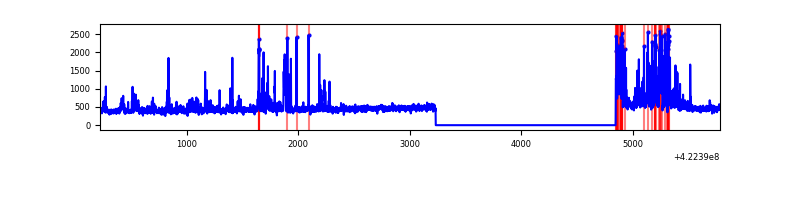 |
| C | 5556 | 3944 | 134 | 134 | 2.41% | 3.40% | 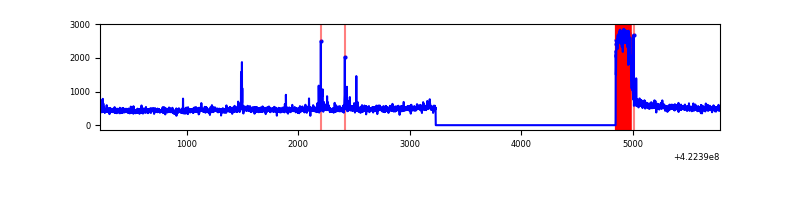 |
| D | 5556 | 3944 | 200 | 200 | 3.60% | 5.07% | 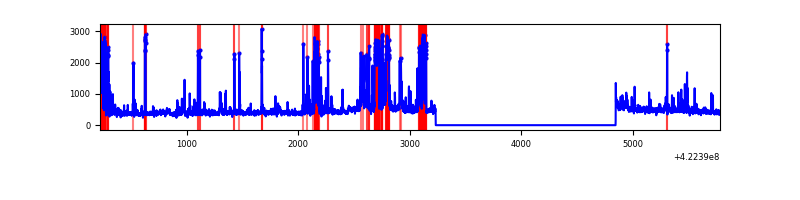 |
Top three noisy pixels from each quadrant. If the there are fewer than three noisy pixels in the level2.evt file, extra rows are filled as -1
| Pixel properties | Quadrant properties | ||||||
|---|---|---|---|---|---|---|---|
| Quadrant | DetID | PixID | Counts | Sigma | Mean | Median | Sigma |
| A | 10 | 83 | 321112 | 3569.07 | 431 | 423 | 89.9 |
| A | 2 | 79 | 14933 | 161.49 | 431 | 423 | 89.9 |
| A | 3 | 137 | 4864 | 49.43 | 431 | 423 | 89.9 |
| B | 5 | 255 | 371293 | 4453.04 | 425 | 413 | 83.3 |
| B | 0 | 190 | 87548 | 1046.2 | 425 | 413 | 83.3 |
| B | 12 | 111 | 10308 | 118.81 | 425 | 413 | 83.3 |
| C | 0 | 10 | 409695 | 4209.98 | 407 | 408 | 97.2 |
| C | 15 | 214 | 164252 | 1685.32 | 407 | 408 | 97.2 |
| C | 12 | 249 | 26249 | 265.8 | 407 | 408 | 97.2 |
| D | 1 | 47 | 364742 | 3650.39 | 410 | 400 | 99.8 |
| D | 5 | 222 | 202543 | 2025.3 | 410 | 400 | 99.8 |
| D | 2 | 249 | 124658 | 1244.96 | 410 | 400 | 99.8 |
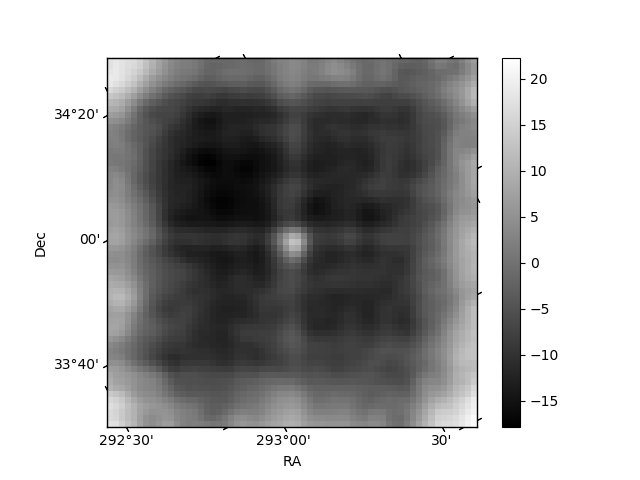
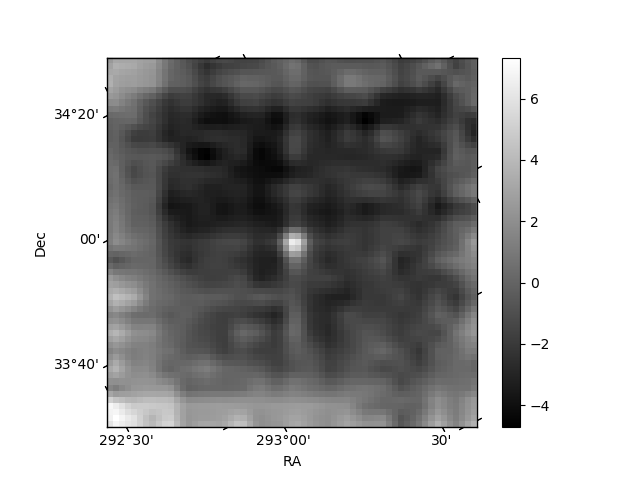
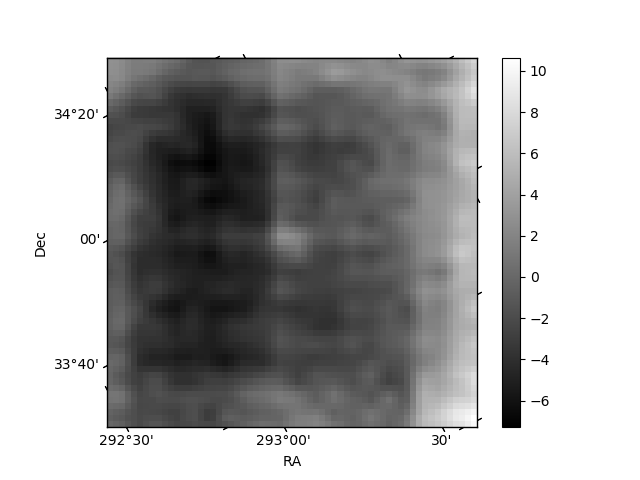
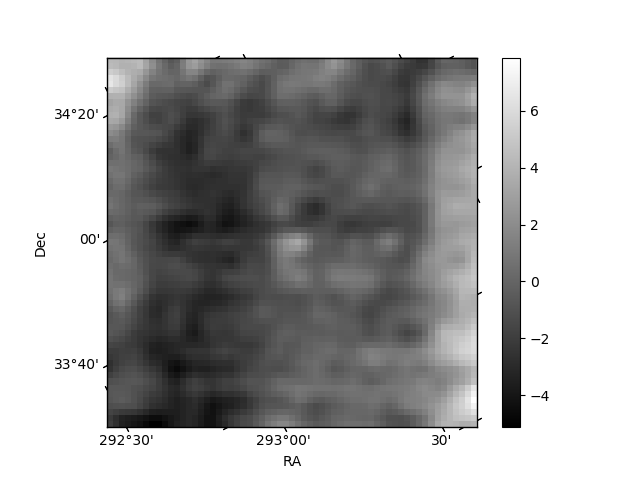
Histogram calculated using DETX and DETY for each event in the final _common_clean file
| Quadrant A | 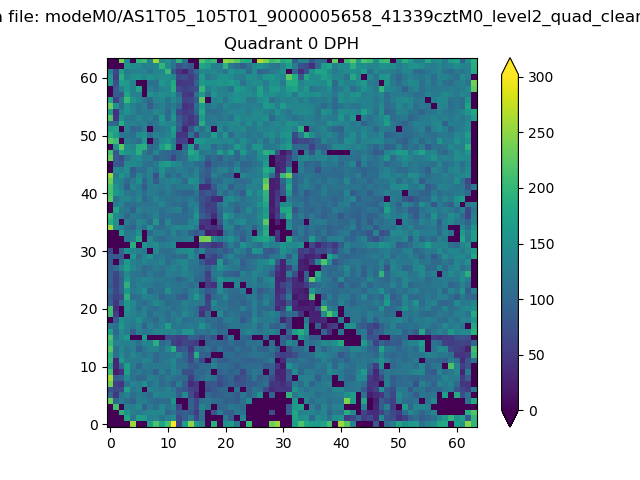 |
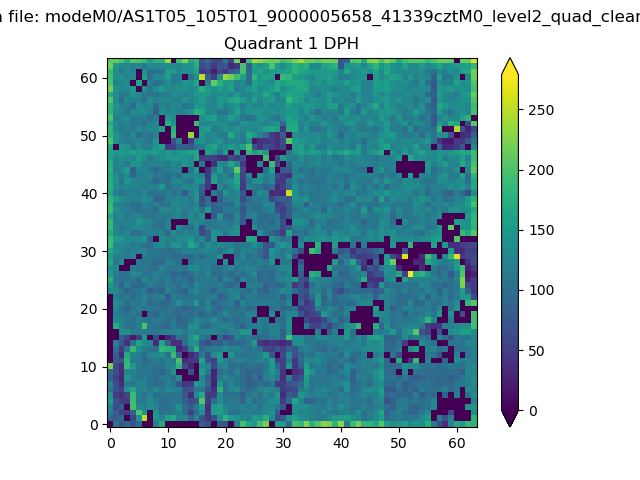 |
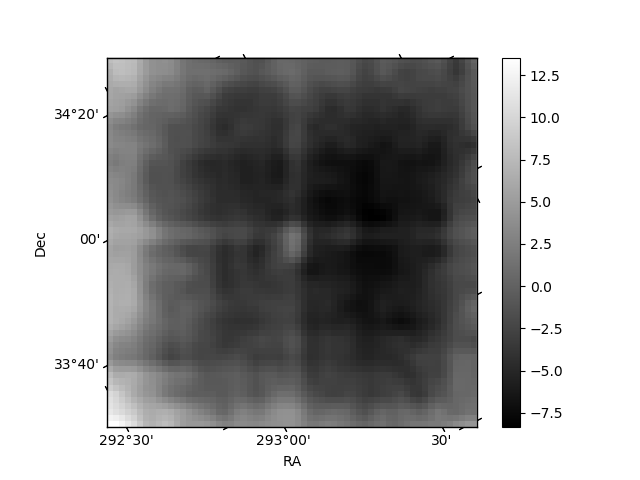
Quadrant B |
|---|---|---|---|
| Quadrant D | 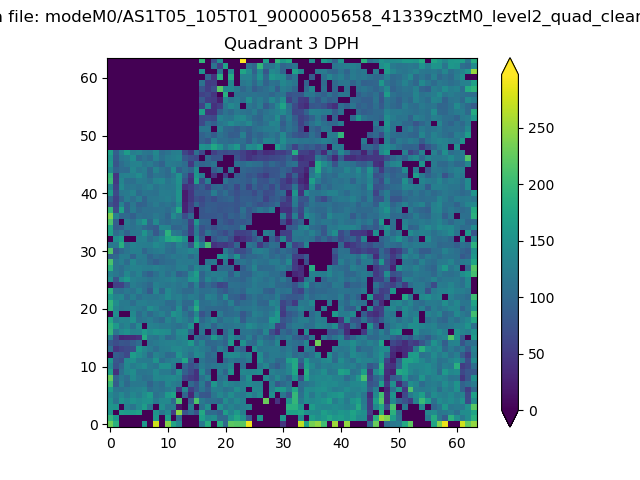 |
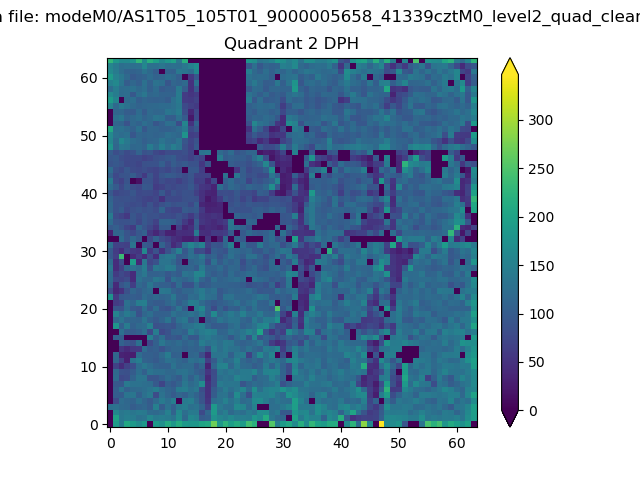 |
Quadrant C |
| Plot type | Count rate plots | Images |
|---|---|---|
| Comparison with Poisson distribution Blue bars denote a histogram of data divided into 1 sec bins. Red curve is a Poisson curve with rate = median count rate of data. |
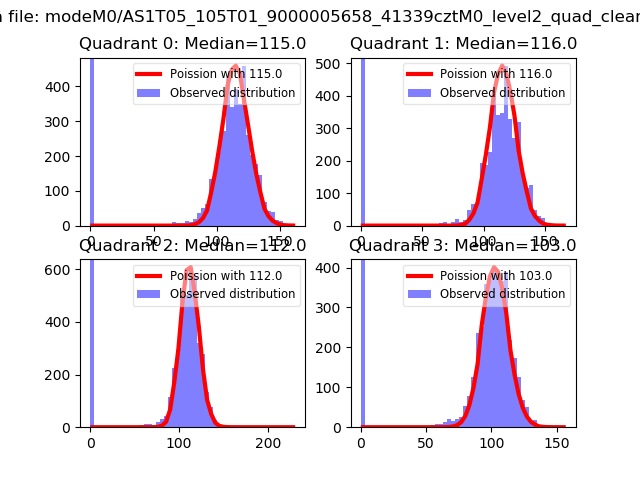 |
 |
| Quadrant-wise count rates Data is divided into 100 sec bins |
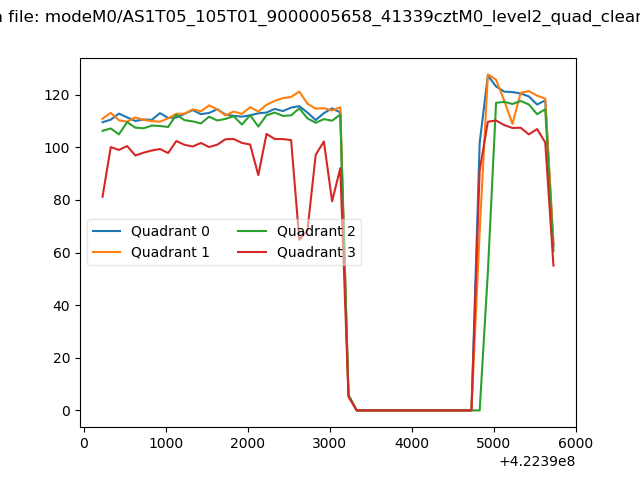 |
|
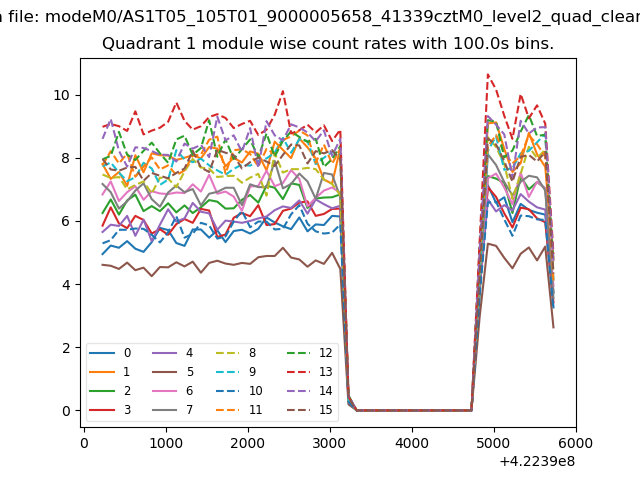
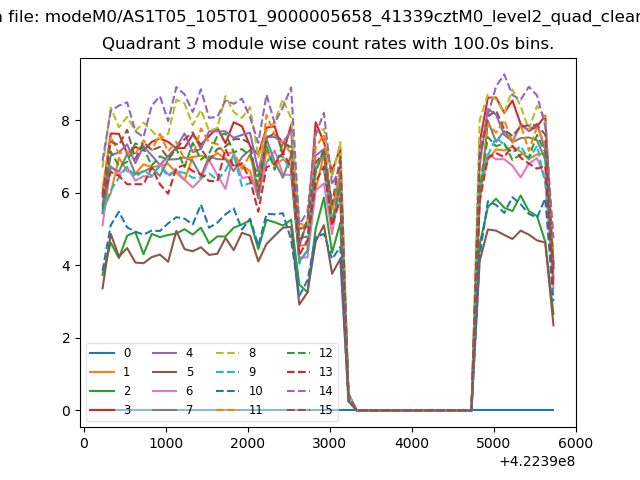
| Module-wise count rates for Quadrant A Data is divided into 100 sec bins |
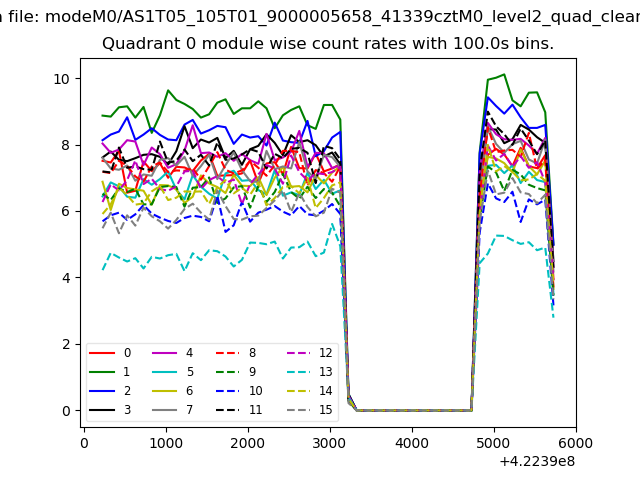 |
 |
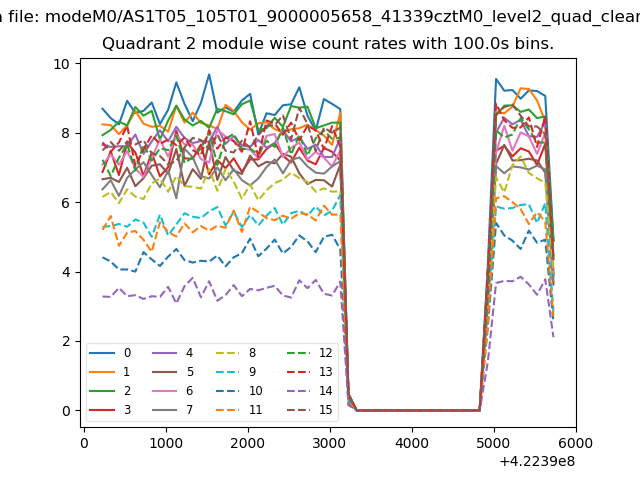
| Module-wise count rates for Quadrant B Data is divided into 100 sec bins |
 |
 |
| Module-wise count rates for Quadrant C Data is divided into 100 sec bins |
 |
 |
| Module-wise count rates for Quadrant D Data is divided into 100 sec bins |
 |
 |
| Parameter | Plot |
|---|---|
| CZT HV Monitor | 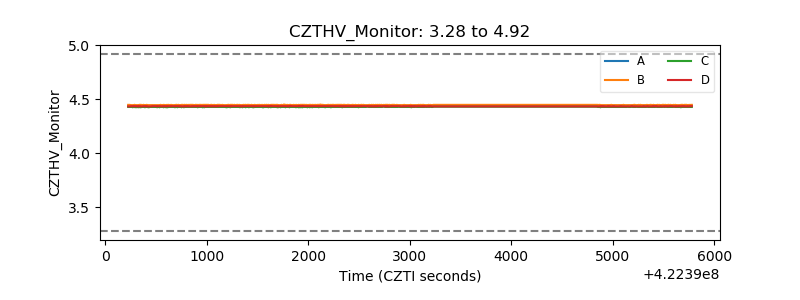 |
| D_VDD |  |
| Temperature 1 | 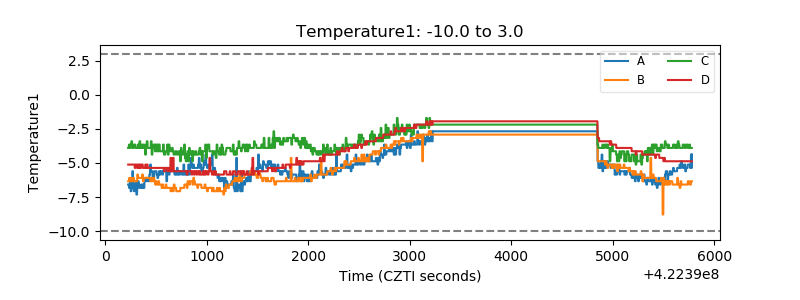 |
| Veto HV Monitor | 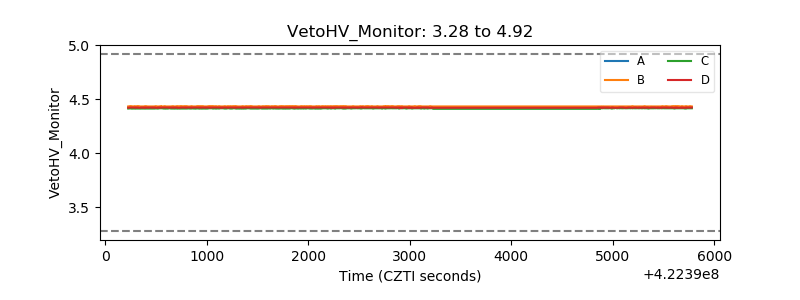 |
| Veto LLD | 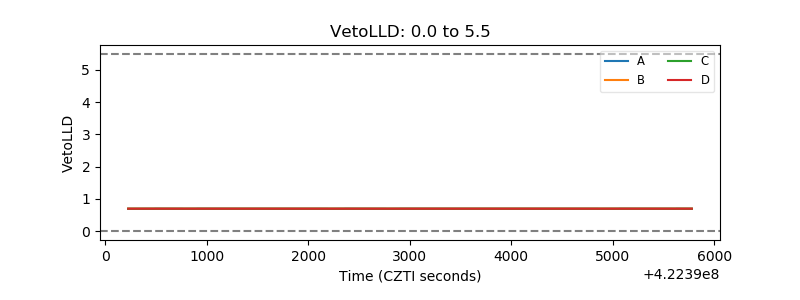 |
| Alpha Counter | 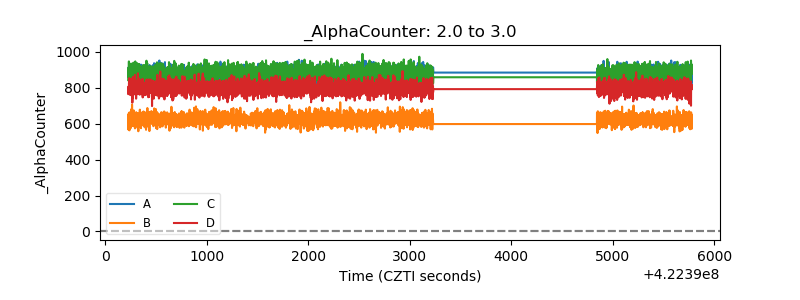 |
| _CPM_Rate | 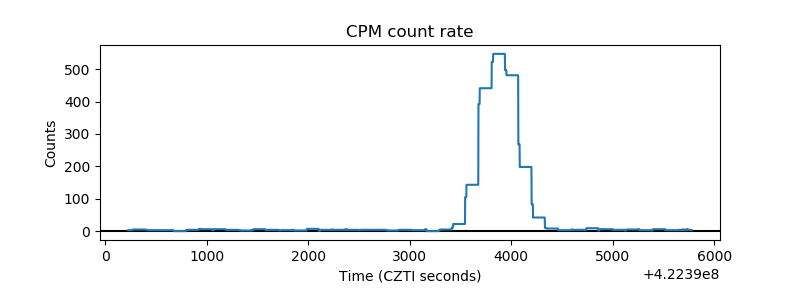 |
| CZT Counter | 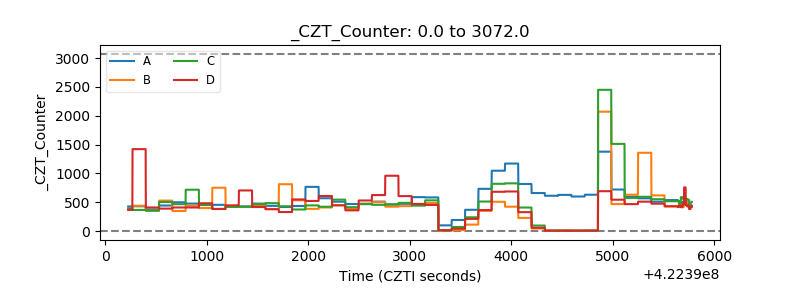 |
| +2.5 Volts monitor | 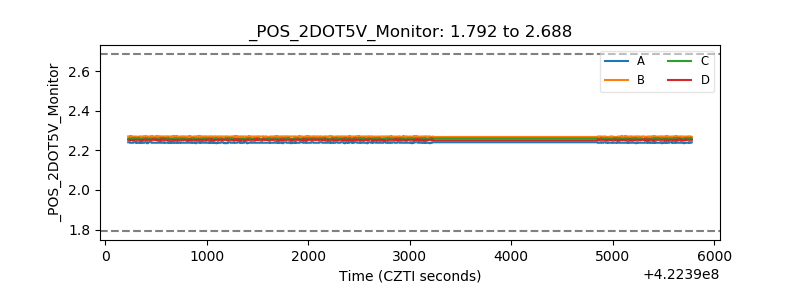 |
| +5 Volts monitor | 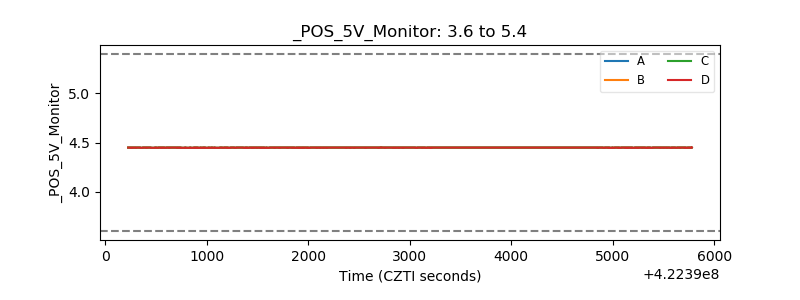 |
| _ROLL_ROT | 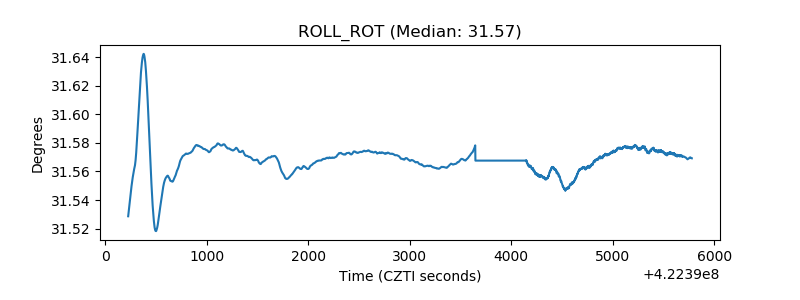 |
| _Roll_DEC | 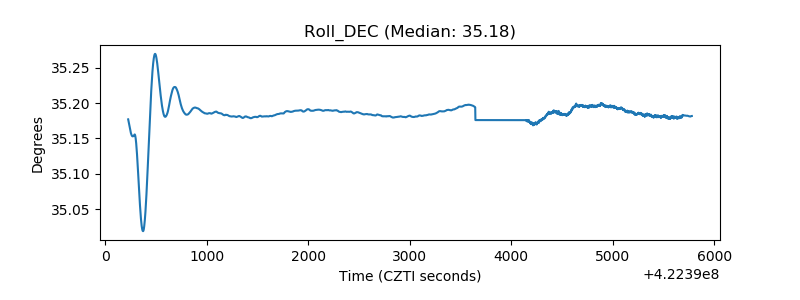 |
| _Roll_RA | 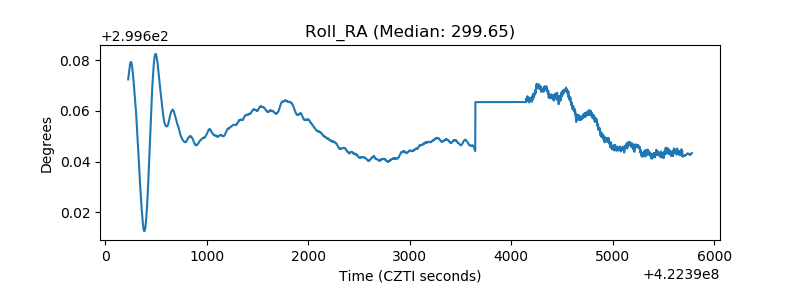 |
| Veto Counter | 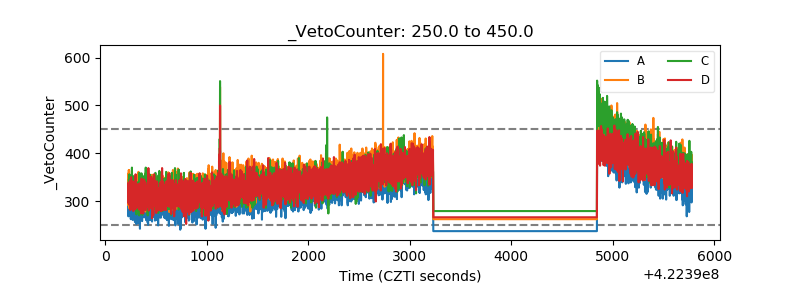 |