| Param | Original file | Final file |
|---|---|---|
| Filename | modeM0/AS1T05_105T01_9000005658_41341cztM0_level2.fits | modeM0/AS1T05_105T01_9000005658_41341cztM0_level2_quad_clean.evt |
| Size (bytes) | 336,242,880 | 90,288,000 |
| Size | 320.7 MB | 86.1 MB |
| Events in quadrant A | 2,791,931 | 618,731 |
| Events in quadrant B | 2,991,146 | 621,825 |
| Events in quadrant C | 3,141,471 | 575,752 |
| Events in quadrant D | 3,103,342 | 542,049 |
| Mode M9 | |||
|---|---|---|---|
| Quadrant | BADHDUFLAG | Total packets | Discarded packets |
| A | 0 | 21 | 0 |
| B | 0 | 21 | 0 |
| C | 0 | 21 | 0 |
| D | 0 | 22 | 0 |
| Mode SS | |||
|---|---|---|---|
| Quadrant | BADHDUFLAG | Total packets | Discarded packets |
| A | 0 | 108 | 0 |
| B | 0 | 108 | 0 |
| C | 0 | 108 | 0 |
| D | 0 | 108 | 0 |
| Mode M0 | |||
|---|---|---|---|
| Quadrant | BADHDUFLAG | Total packets | Discarded packets |
| A | 0 | 11678 | 3 |
| B | 0 | 12600 | 2 |
| C | 0 | 12720 | 2 |
| D | 0 | 13187 | 2 |
| Quadrant | Total seconds | Saturated seconds | Saturation percentage |
|---|---|---|---|
| A | 5372 | 9 | 0.167535% |
| B | 5372 | 126 | 2.345495% |
| C | 5372 | 256 | 4.765450% |
| D | 5372 | 163 | 3.034252% |
Noise dominated data is calculated using 1-second bins in cleaned event files. If a bin has >2000 counts, and if more than 50% of those come from <1% of pixels, then it is considered to be noise-dominated and hence unusable.
| Quadrant | # 1 sec bins | Bins with >0 counts | Bins with >2000 counts | High rate bins dominated by noise | Noise dominated (total time) | Noise dominated (detector-on time) | Marked lightcurve |
|---|---|---|---|---|---|---|---|
| A | 7134 | 5373 | 4 | 4 | 0.06% | 0.07% | 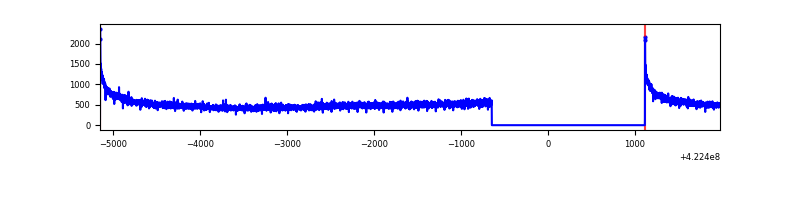 |
| B | 7134 | 5373 | 97 | 97 | 1.36% | 1.81% | 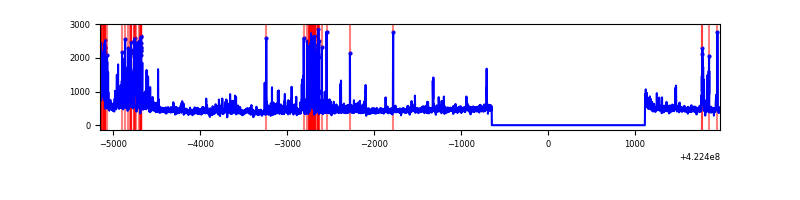 |
| C | 7134 | 5373 | 241 | 241 | 3.38% | 4.49% | 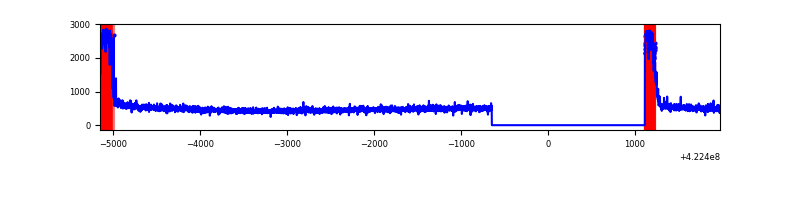 |
| D | 7133 | 5372 | 161 | 161 | 2.26% | 3.00% | 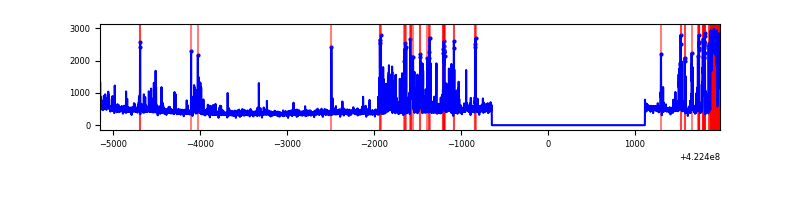 |
Top three noisy pixels from each quadrant. If the there are fewer than three noisy pixels in the level2.evt file, extra rows are filled as -1
| Pixel properties | Quadrant properties | ||||||
|---|---|---|---|---|---|---|---|
| Quadrant | DetID | PixID | Counts | Sigma | Mean | Median | Sigma |
| A | 10 | 83 | 500513 | 4099.19 | 590 | 578 | 122.0 |
| A | 12 | 189 | 7457 | 56.4 | 590 | 578 | 122.0 |
| A | 13 | 6 | 7235 | 54.58 | 590 | 578 | 122.0 |
| B | 5 | 255 | 556697 | 4871.79 | 583 | 568 | 114.2 |
| B | 0 | 190 | 122710 | 1069.99 | 583 | 568 | 114.2 |
| B | 12 | 111 | 14560 | 122.57 | 583 | 568 | 114.2 |
| C | 0 | 10 | 708857 | 5315.77 | 560 | 564 | 133.2 |
| C | 15 | 214 | 223901 | 1676.15 | 560 | 564 | 133.2 |
| C | 2 | 16 | 17225 | 125.04 | 560 | 564 | 133.2 |
| D | 12 | 217 | 374346 | 2695.22 | 569 | 554 | 138.7 |
| D | 5 | 222 | 225839 | 1624.42 | 569 | 554 | 138.7 |
| D | 13 | 249 | 192350 | 1382.94 | 569 | 554 | 138.7 |
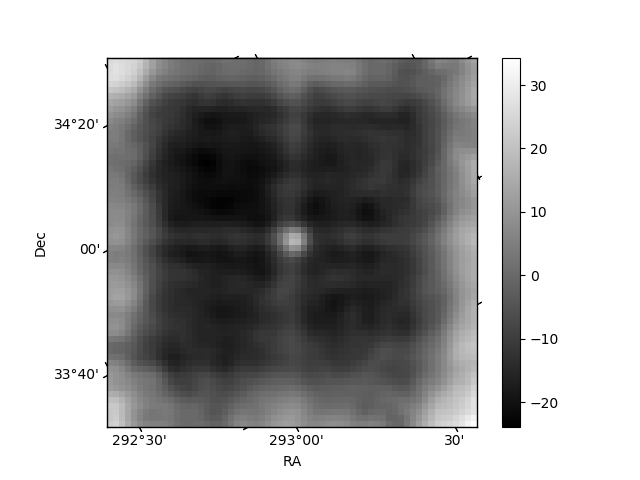
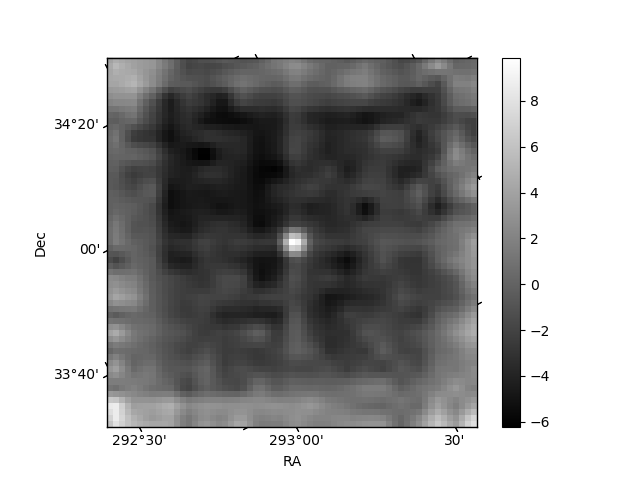
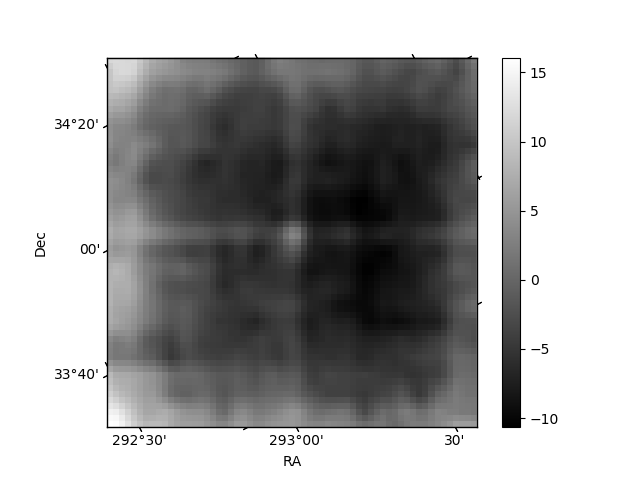
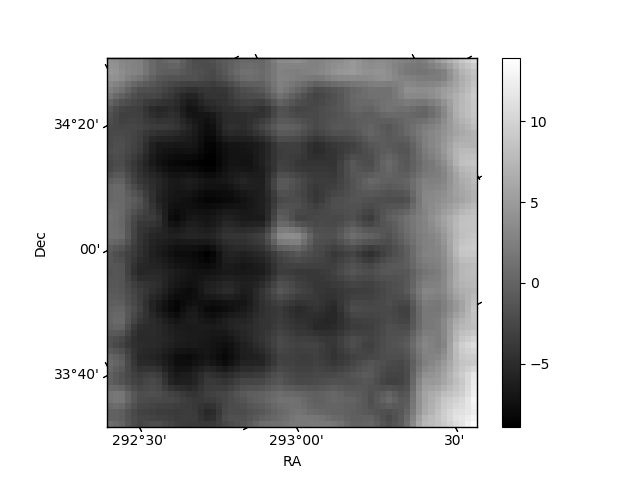
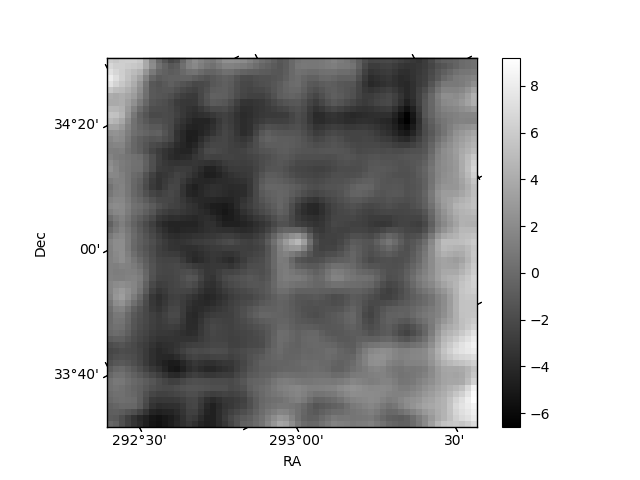
Histogram calculated using DETX and DETY for each event in the final _common_clean file
| Quadrant A | 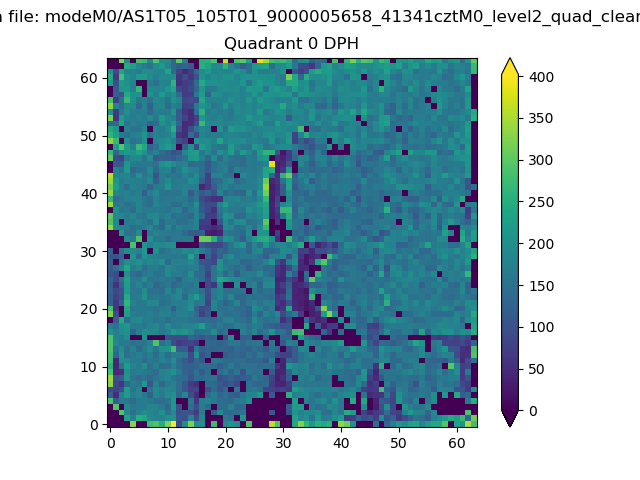 |
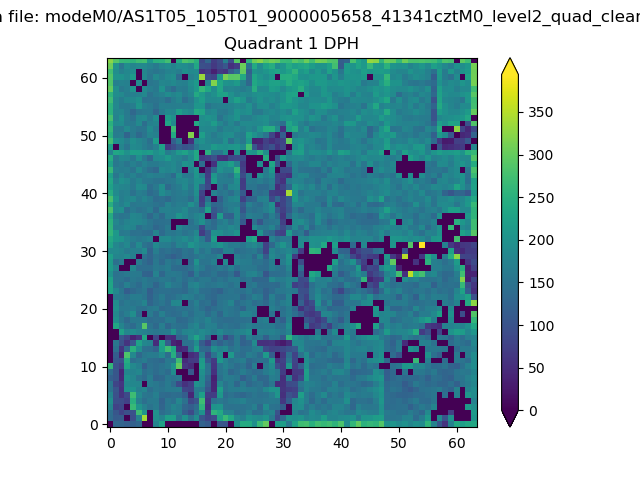 |
Quadrant B |
|---|---|---|---|
| Quadrant D | 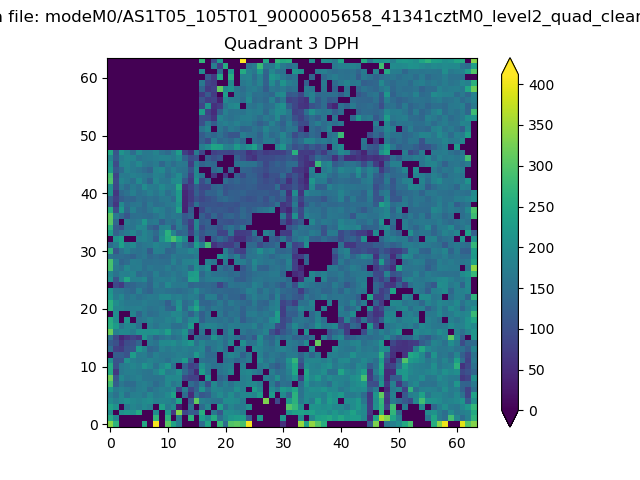 |
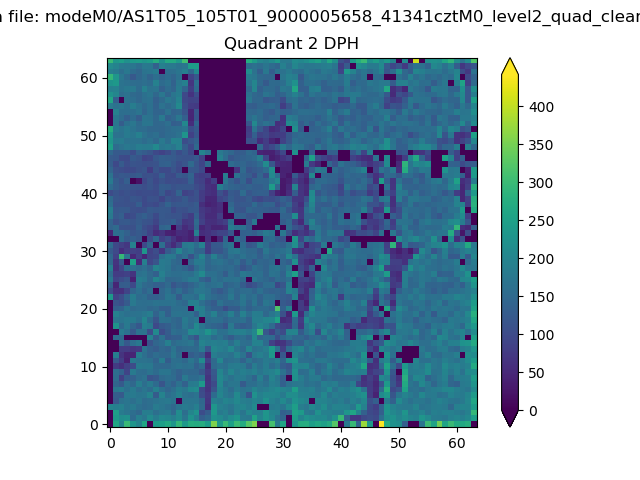 |
Quadrant C |
| Plot type | Count rate plots | Images |
|---|---|---|
| Comparison with Poisson distribution Blue bars denote a histogram of data divided into 1 sec bins. Red curve is a Poisson curve with rate = median count rate of data. |
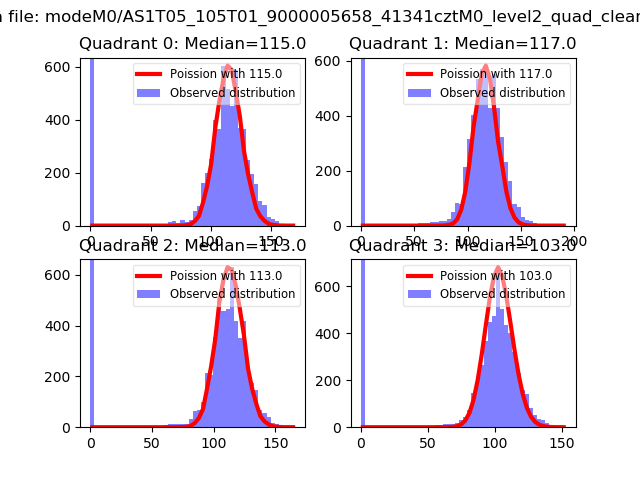 |
 |
| Quadrant-wise count rates Data is divided into 100 sec bins |
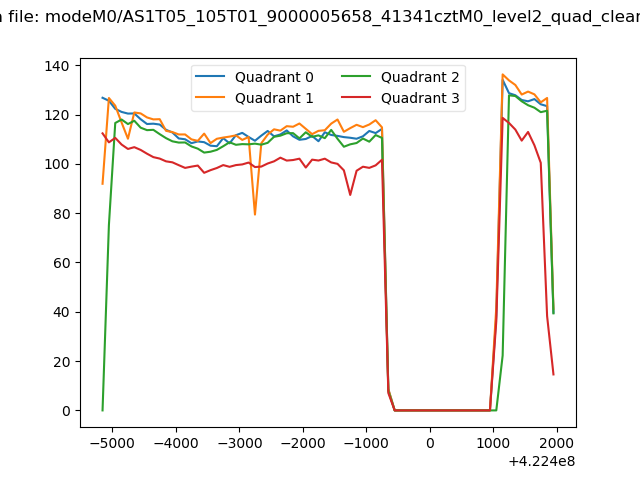 |
|
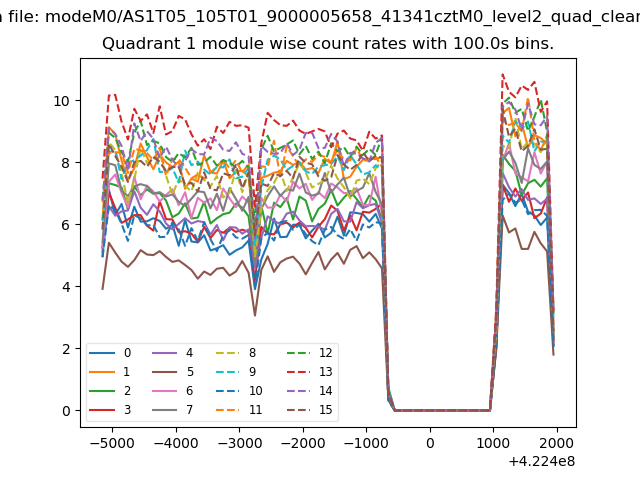
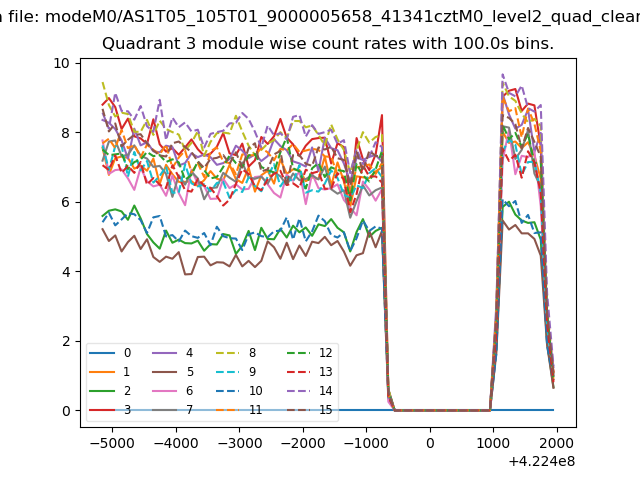
| Module-wise count rates for Quadrant A Data is divided into 100 sec bins |
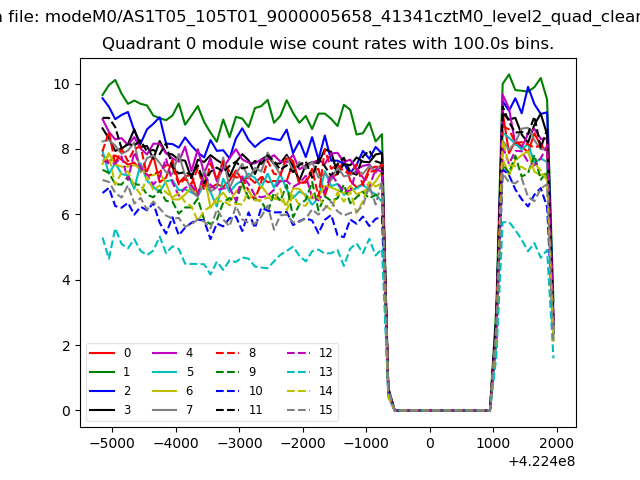 |
 |
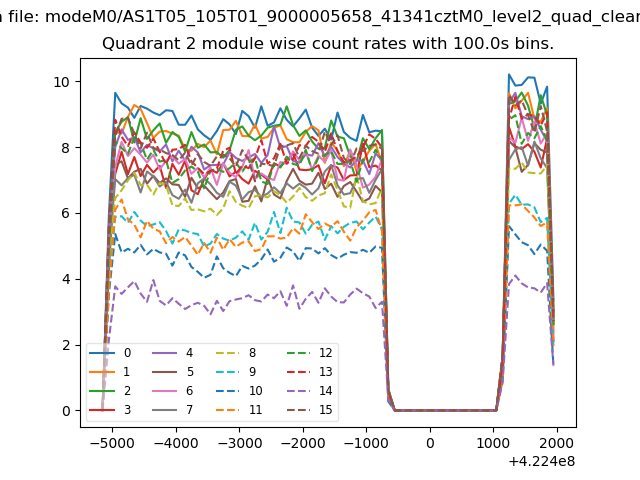
| Module-wise count rates for Quadrant B Data is divided into 100 sec bins |
 |
 |
| Module-wise count rates for Quadrant C Data is divided into 100 sec bins |
 |
 |
| Module-wise count rates for Quadrant D Data is divided into 100 sec bins |
 |
 |
| Parameter | Plot |
|---|---|
| CZT HV Monitor | 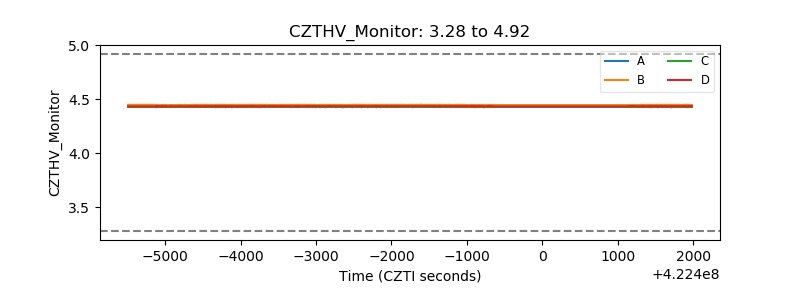 |
| D_VDD | 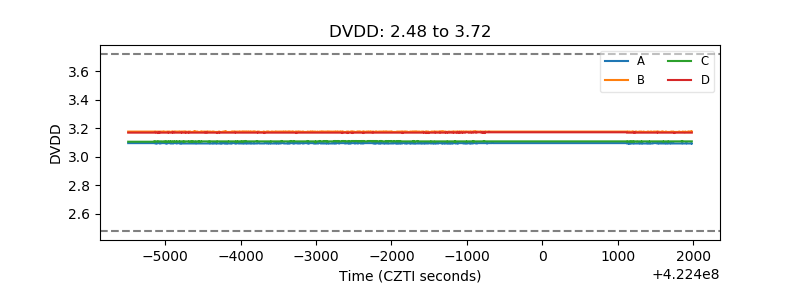 |
| Temperature 1 | 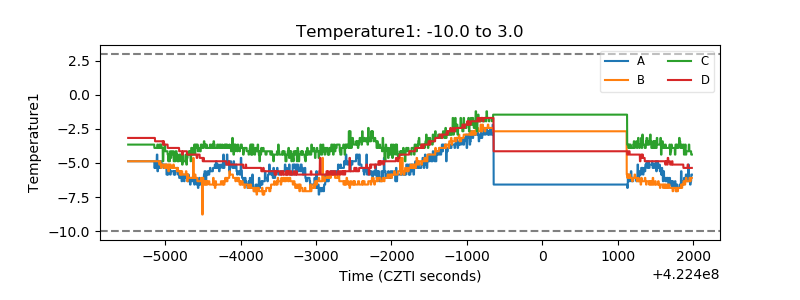 |
| Veto HV Monitor |  |
| Veto LLD | 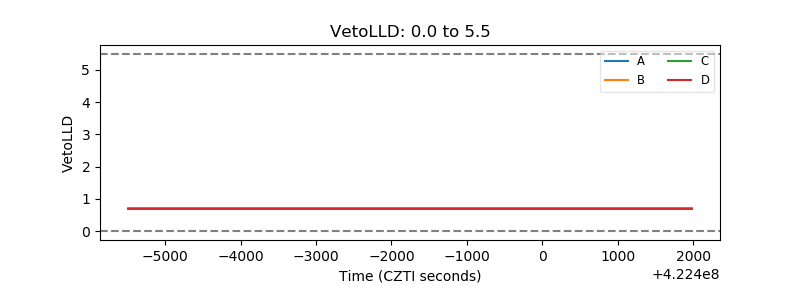 |
| Alpha Counter | 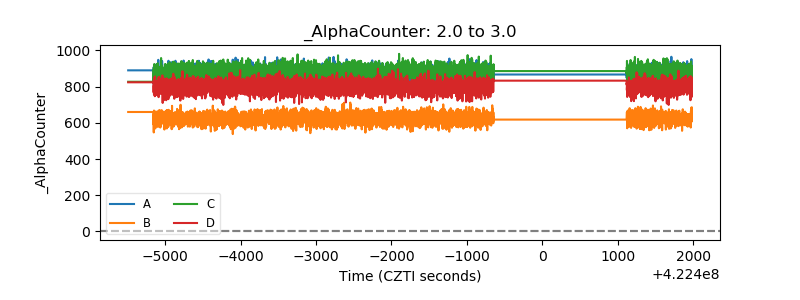 |
| _CPM_Rate | 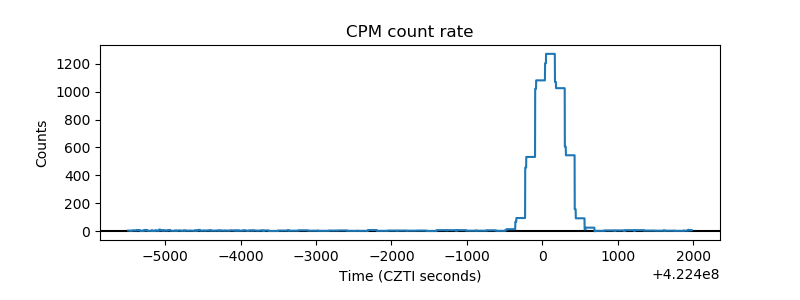 |
| CZT Counter | 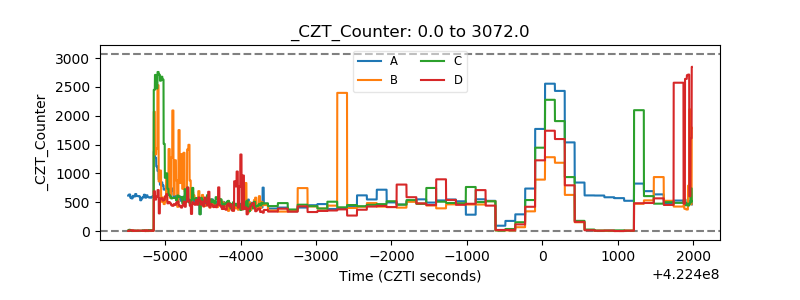 |
| +2.5 Volts monitor | 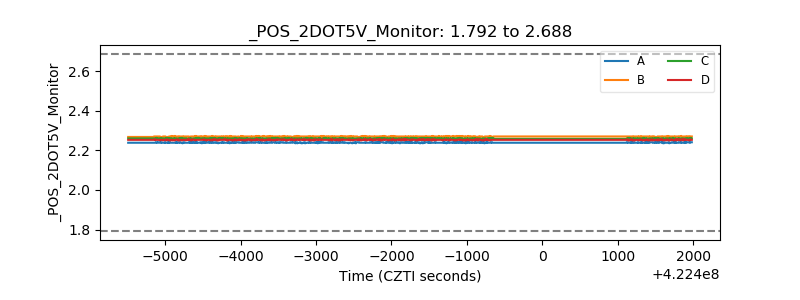 |
| +5 Volts monitor | 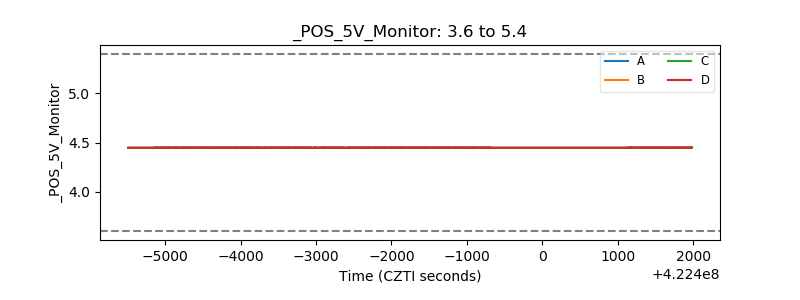 |
| _ROLL_ROT | 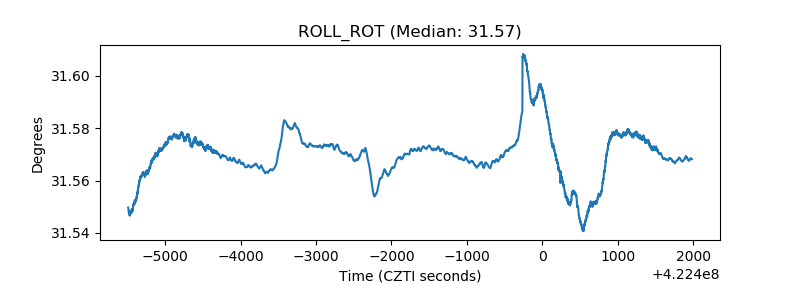 |
| _Roll_DEC | 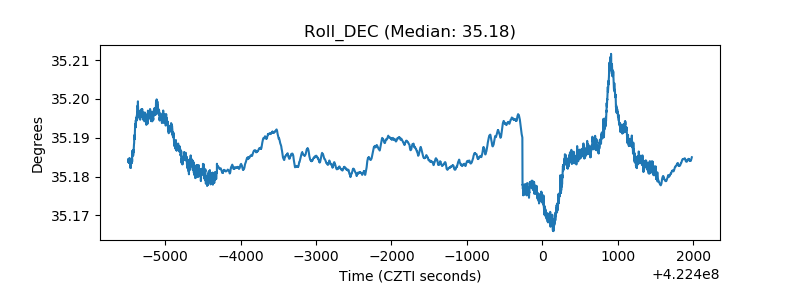 |
| _Roll_RA | 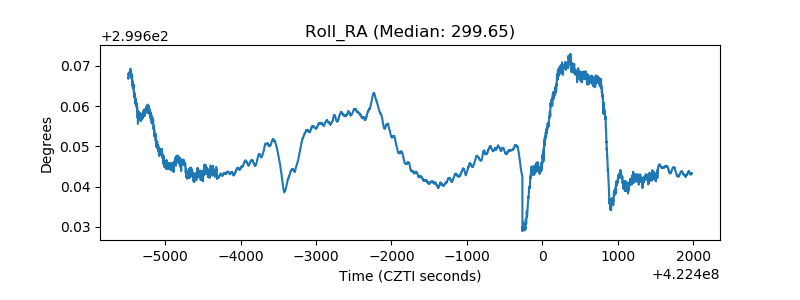 |
| Veto Counter | 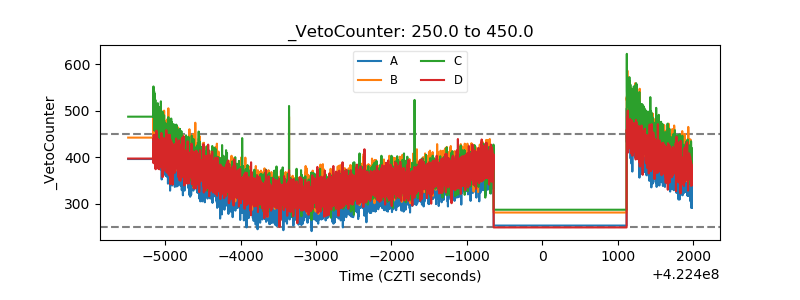 |