| Param | Original file | Final file |
|---|---|---|
| Filename | modeM0/AS1T05_105T01_9000005658_41342cztM0_level2.fits | modeM0/AS1T05_105T01_9000005658_41342cztM0_level2_quad_clean.evt |
| Size (bytes) | 405,319,680 | 90,057,600 |
| Size | 386.5 MB | 85.9 MB |
| Events in quadrant A | 2,808,825 | 634,217 |
| Events in quadrant B | 2,588,190 | 653,343 |
| Events in quadrant C | 3,103,217 | 593,331 |
| Events in quadrant D | 6,088,465 | 473,399 |
| Mode M9 | |||
|---|---|---|---|
| Quadrant | BADHDUFLAG | Total packets | Discarded packets |
| A | 0 | 37 | 0 |
| B | 0 | 37 | 0 |
| C | 0 | 37 | 0 |
| D | 0 | 37 | 0 |
| Mode SS | |||
|---|---|---|---|
| Quadrant | BADHDUFLAG | Total packets | Discarded packets |
| A | 0 | 108 | 0 |
| B | 0 | 108 | 0 |
| C | 0 | 108 | 0 |
| D | 0 | 108 | 0 |
| Mode M0 | |||
|---|---|---|---|
| Quadrant | BADHDUFLAG | Total packets | Discarded packets |
| A | 0 | 11603 | 3 |
| B | 0 | 11341 | 2 |
| C | 0 | 12534 | 2 |
| D | 0 | 21765 | 2 |
| Quadrant | Total seconds | Saturated seconds | Saturation percentage |
|---|---|---|---|
| A | 5329 | 9 | 0.168887% |
| B | 5329 | 24 | 0.450366% |
| C | 5329 | 238 | 4.466129% |
| D | 5329 | 1053 | 19.759805% |
Noise dominated data is calculated using 1-second bins in cleaned event files. If a bin has >2000 counts, and if more than 50% of those come from <1% of pixels, then it is considered to be noise-dominated and hence unusable.
| Quadrant | # 1 sec bins | Bins with >0 counts | Bins with >2000 counts | High rate bins dominated by noise | Noise dominated (total time) | Noise dominated (detector-on time) | Marked lightcurve |
|---|---|---|---|---|---|---|---|
| A | 8974 | 5331 | 4 | 4 | 0.04% | 0.08% | 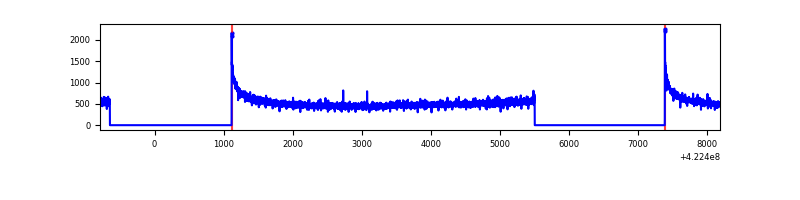 |
| B | 8974 | 5331 | 13 | 13 | 0.14% | 0.24% | 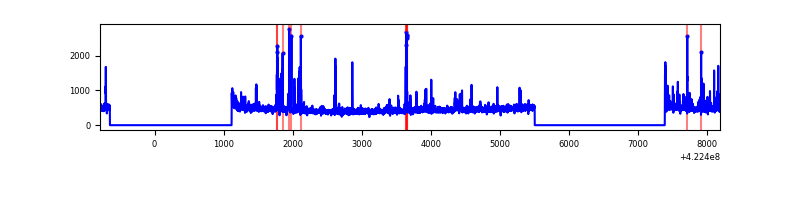 |
| C | 8974 | 5331 | 231 | 231 | 2.57% | 4.33% | 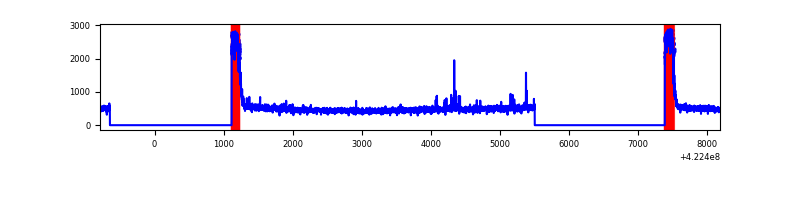 |
| D | 8974 | 5331 | 1087 | 1087 | 12.11% | 20.39% | 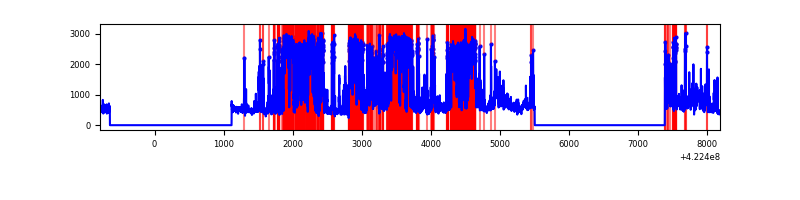 |
Top three noisy pixels from each quadrant. If the there are fewer than three noisy pixels in the level2.evt file, extra rows are filled as -1
| Pixel properties | Quadrant properties | ||||||
|---|---|---|---|---|---|---|---|
| Quadrant | DetID | PixID | Counts | Sigma | Mean | Median | Sigma |
| A | 10 | 83 | 496706 | 4036.08 | 594 | 581 | 122.9 |
| A | 13 | 6 | 12169 | 94.27 | 594 | 581 | 122.9 |
| A | 3 | 137 | 6703 | 49.8 | 594 | 581 | 122.9 |
| B | 5 | 255 | 145714 | 1254.16 | 594 | 577 | 115.7 |
| B | 0 | 190 | 86024 | 738.37 | 594 | 577 | 115.7 |
| B | 12 | 111 | 14464 | 120.0 | 594 | 577 | 115.7 |
| C | 0 | 10 | 632499 | 4785.24 | 564 | 569 | 132.1 |
| C | 15 | 214 | 220968 | 1668.96 | 564 | 569 | 132.1 |
| C | 15 | 111 | 22875 | 168.91 | 564 | 569 | 132.1 |
| D | 12 | 217 | 1677740 | 12934.77 | 524 | 511 | 129.7 |
| D | 13 | 249 | 1218895 | 9396.16 | 524 | 511 | 129.7 |
| D | 1 | 52 | 852546 | 6570.88 | 524 | 511 | 129.7 |
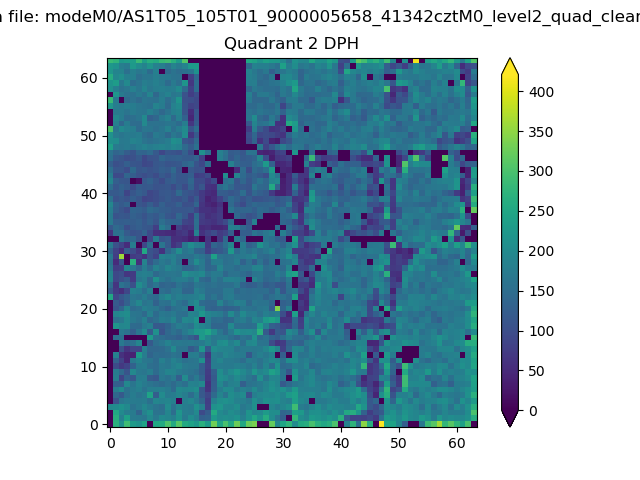
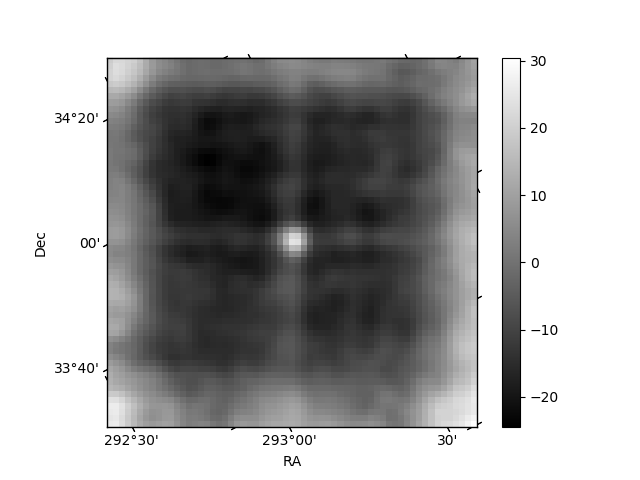
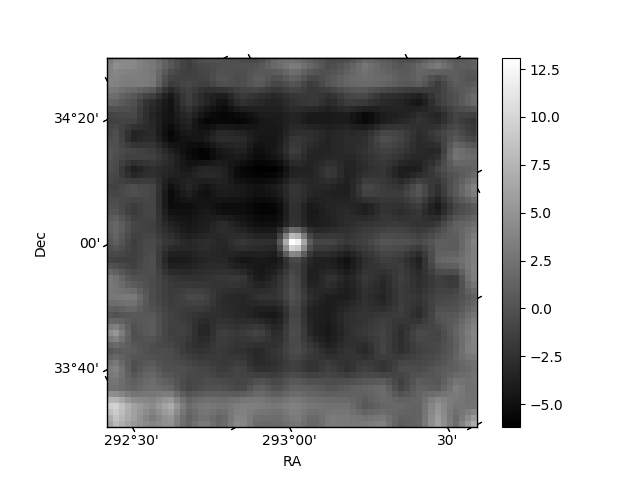
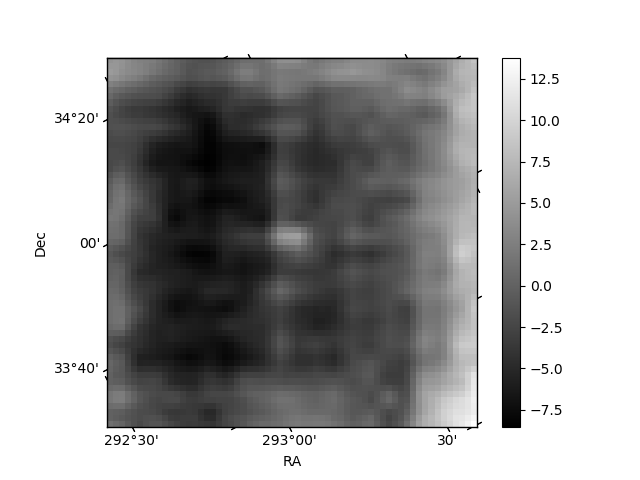
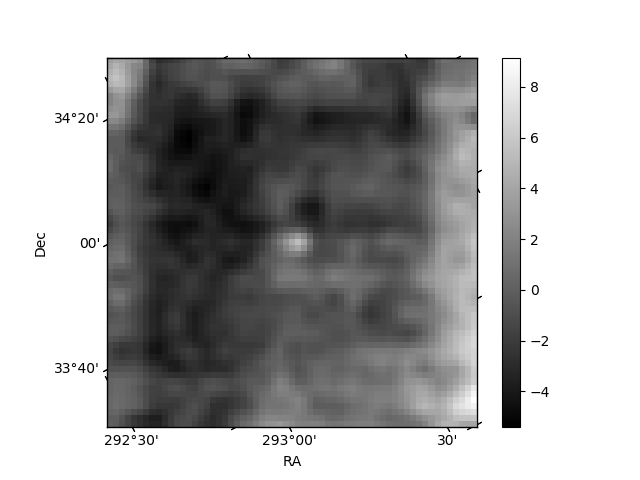
Histogram calculated using DETX and DETY for each event in the final _common_clean file
| Quadrant A | 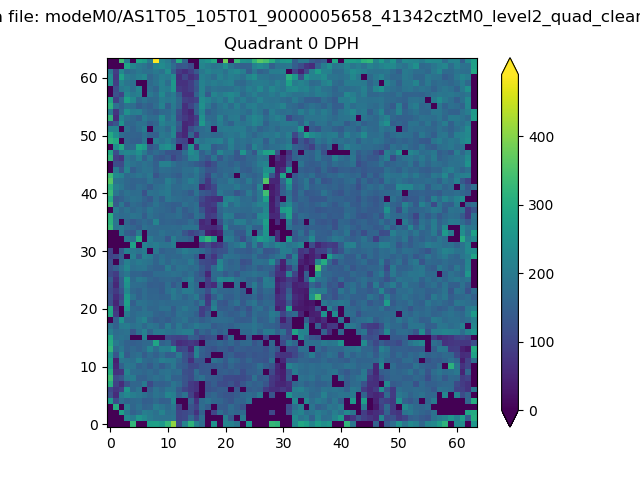 |
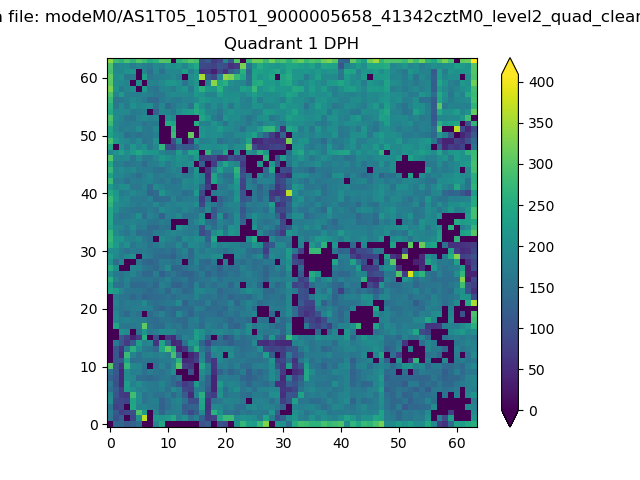 |
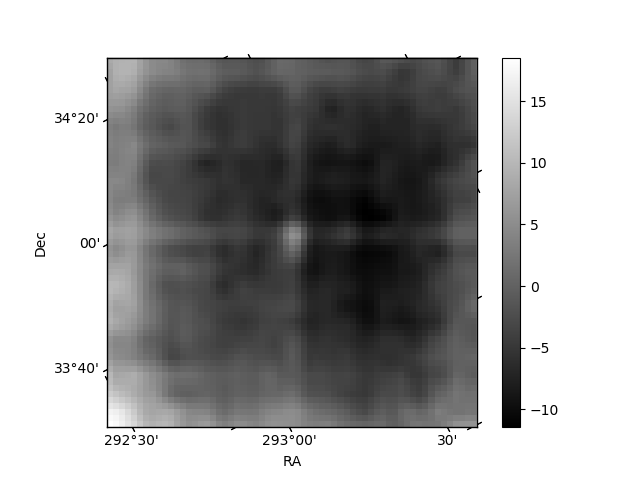
Quadrant B |
|---|---|---|---|
| Quadrant D | 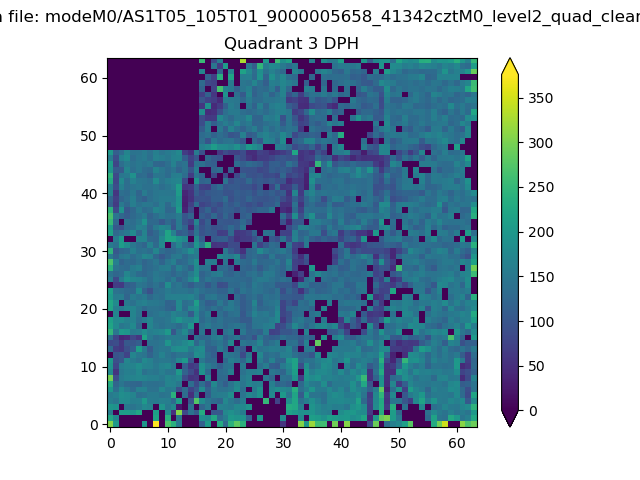 |
 |
Quadrant C |
| Plot type | Count rate plots | Images |
|---|---|---|
| Comparison with Poisson distribution Blue bars denote a histogram of data divided into 1 sec bins. Red curve is a Poisson curve with rate = median count rate of data. |
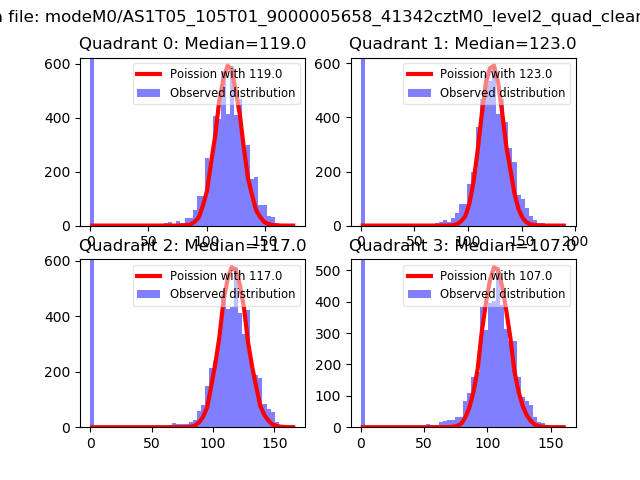 |
 |
| Quadrant-wise count rates Data is divided into 100 sec bins |
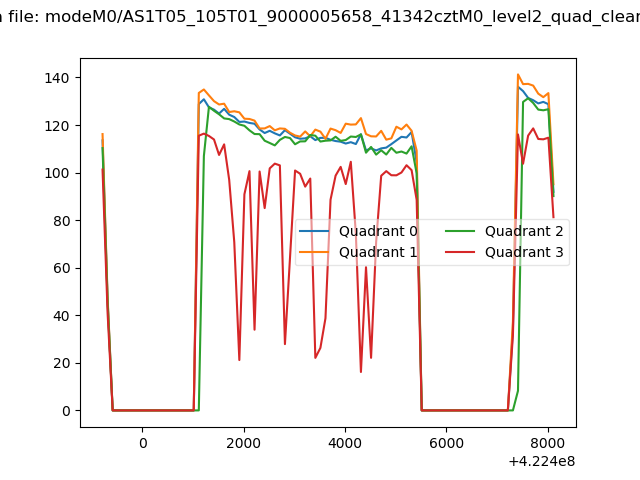 |
|
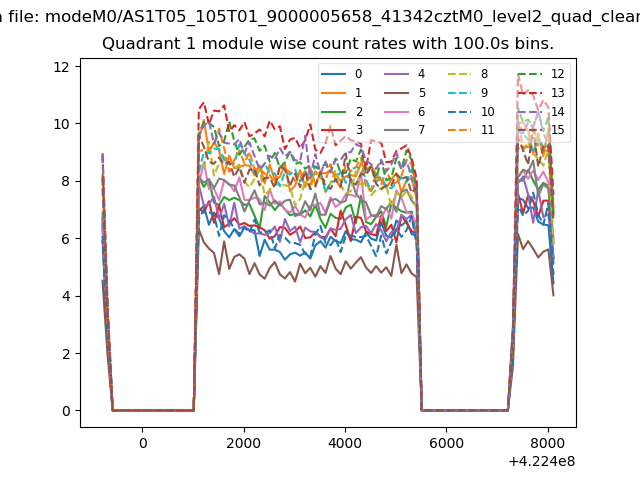
| Module-wise count rates for Quadrant A Data is divided into 100 sec bins |
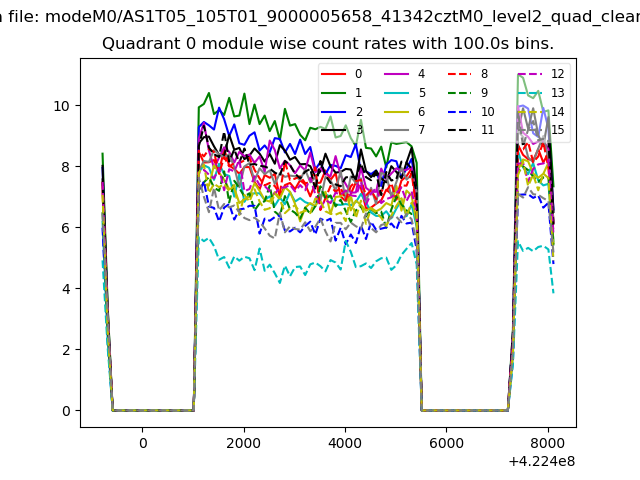 |
 |
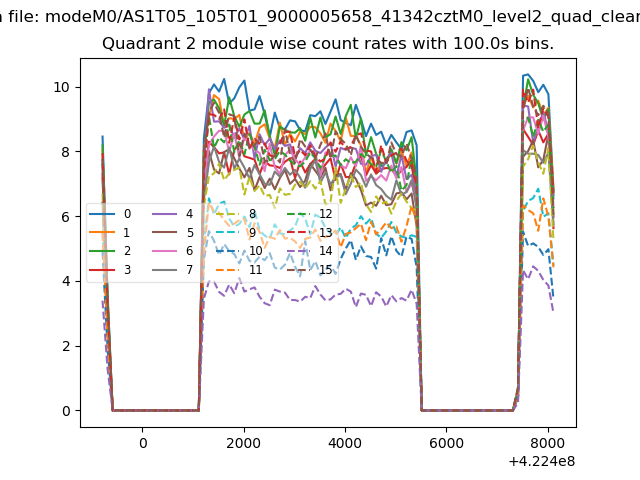
| Module-wise count rates for Quadrant B Data is divided into 100 sec bins |
 |
 |
| Module-wise count rates for Quadrant C Data is divided into 100 sec bins |
 |
 |
| Module-wise count rates for Quadrant D Data is divided into 100 sec bins |
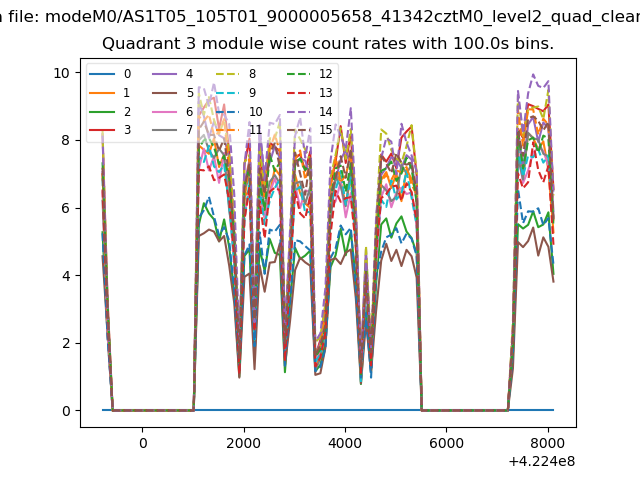 |
 |
| Parameter | Plot |
|---|---|
| CZT HV Monitor | 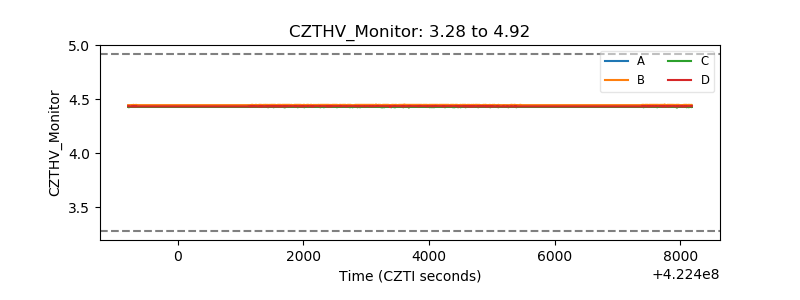 |
| D_VDD | 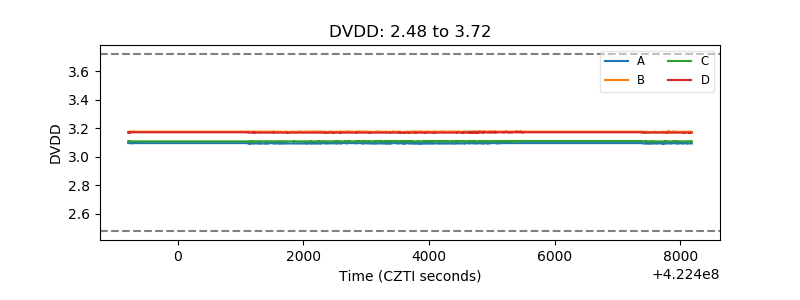 |
| Temperature 1 | 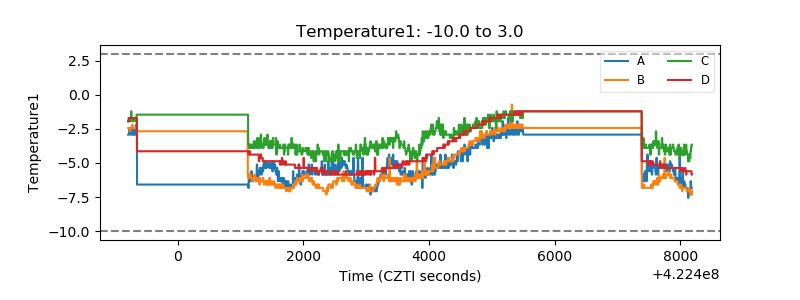 |
| Veto HV Monitor | 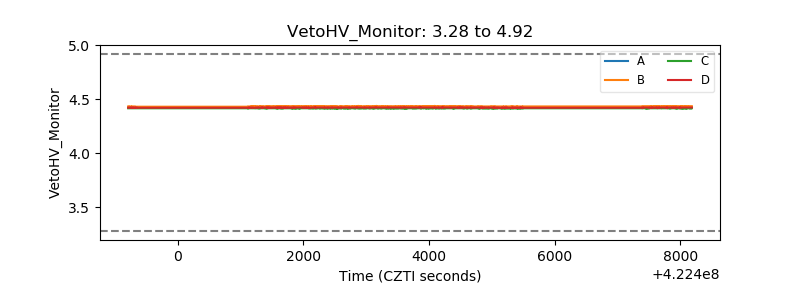 |
| Veto LLD | 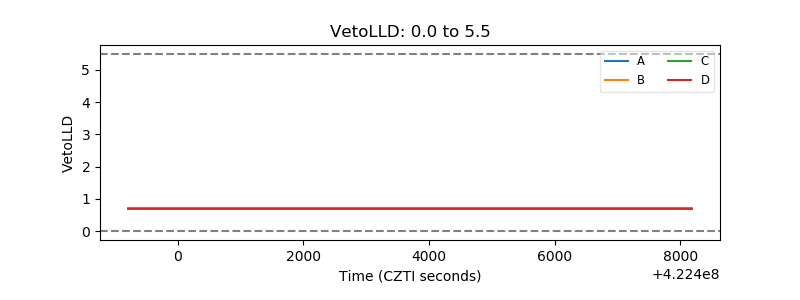 |
| Alpha Counter | 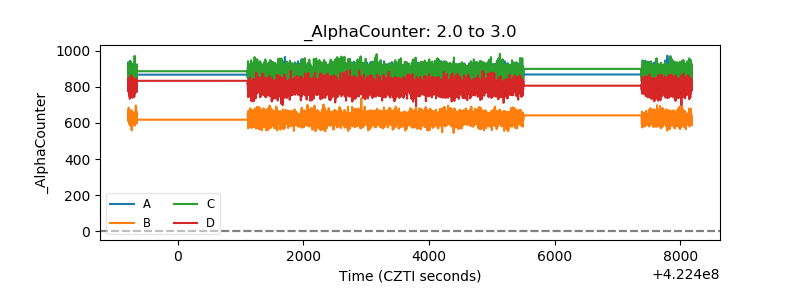 |
| _CPM_Rate | 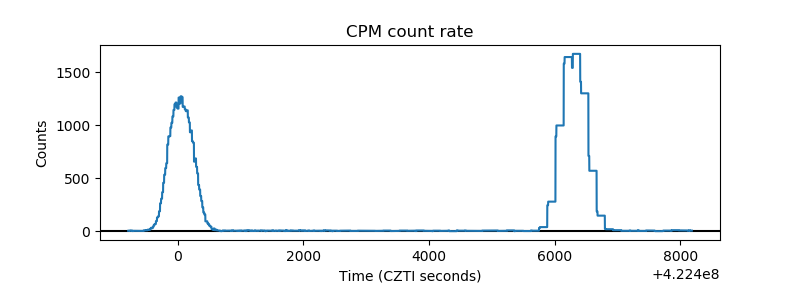 |
| CZT Counter | 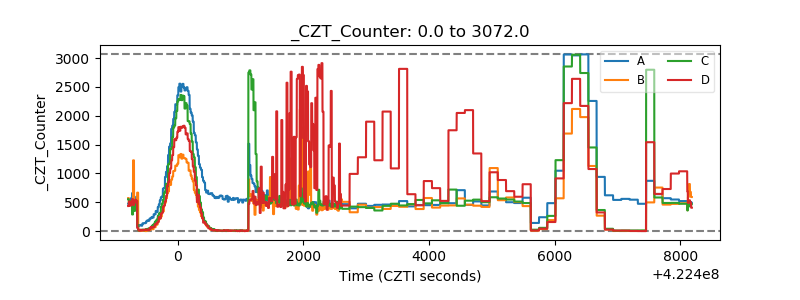 |
| +2.5 Volts monitor | 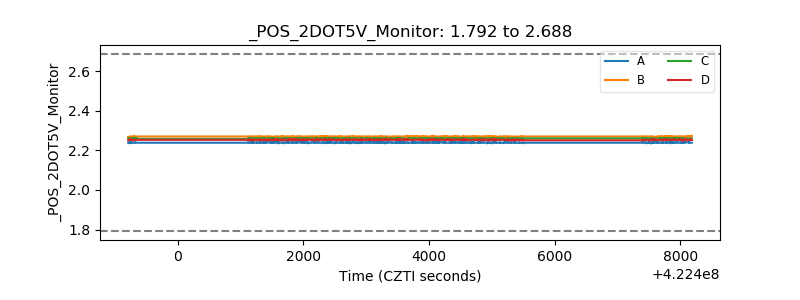 |
| +5 Volts monitor | 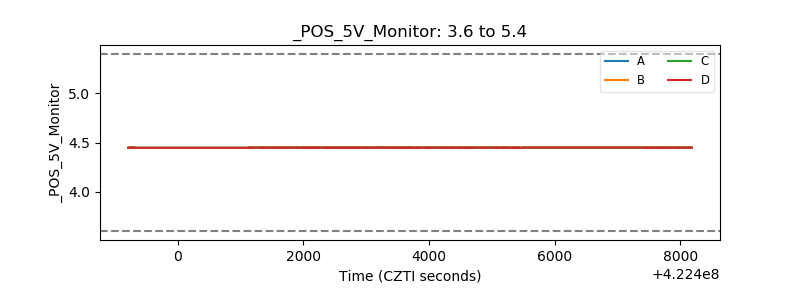 |
| _ROLL_ROT | 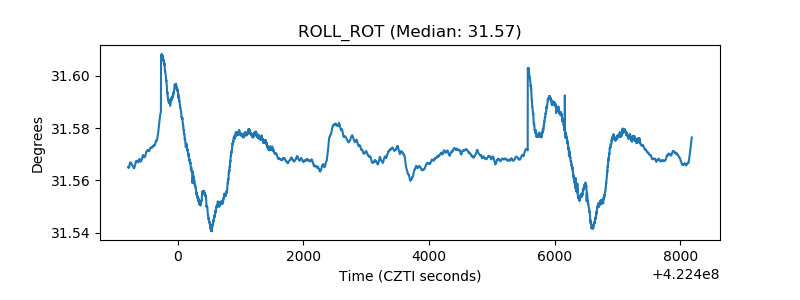 |
| _Roll_DEC | 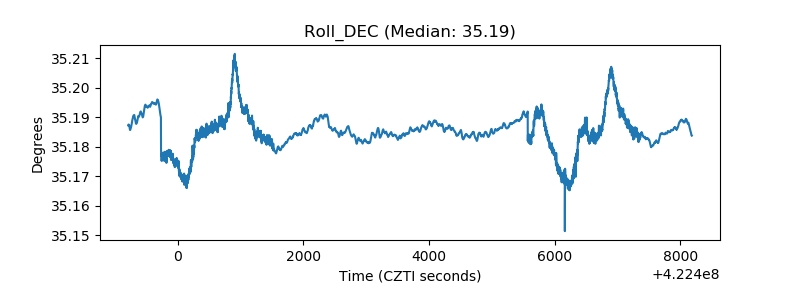 |
| _Roll_RA | 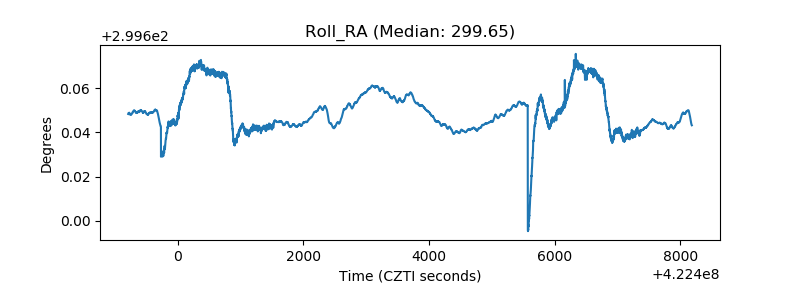 |
| Veto Counter | 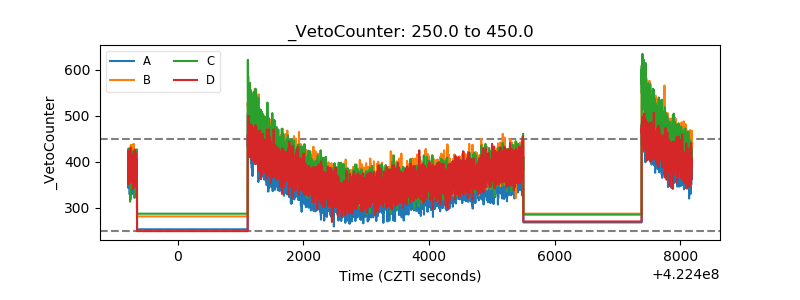 |