| Param | Original file | Final file |
|---|---|---|
| Filename | modeM0/AS1T05_105T01_9000005658_41343cztM0_level2.fits | modeM0/AS1T05_105T01_9000005658_41343cztM0_level2_quad_clean.evt |
| Size (bytes) | 414,501,120 | 88,810,560 |
| Size | 395.3 MB | 84.7 MB |
| Events in quadrant A | 2,841,482 | 627,175 |
| Events in quadrant B | 2,461,919 | 650,309 |
| Events in quadrant C | 3,059,396 | 581,924 |
| Events in quadrant D | 6,580,953 | 470,018 |
| Mode M9 | |||
|---|---|---|---|
| Quadrant | BADHDUFLAG | Total packets | Discarded packets |
| A | 0 | 39 | 0 |
| B | 0 | 39 | 0 |
| C | 0 | 39 | 0 |
| D | 0 | 39 | 0 |
| Mode SS | |||
|---|---|---|---|
| Quadrant | BADHDUFLAG | Total packets | Discarded packets |
| A | 0 | 106 | 0 |
| B | 0 | 106 | 0 |
| C | 0 | 106 | 0 |
| D | 0 | 106 | 0 |
| Mode M0 | |||
|---|---|---|---|
| Quadrant | BADHDUFLAG | Total packets | Discarded packets |
| A | 0 | 11540 | 3 |
| B | 0 | 10724 | 2 |
| C | 0 | 12182 | 2 |
| D | 0 | 23118 | 2 |
| Quadrant | Total seconds | Saturated seconds | Saturation percentage |
|---|---|---|---|
| A | 5139 | 21 | 0.408640% |
| B | 5139 | 17 | 0.330804% |
| C | 5139 | 257 | 5.000973% |
| D | 5139 | 1088 | 21.171434% |
Noise dominated data is calculated using 1-second bins in cleaned event files. If a bin has >2000 counts, and if more than 50% of those come from <1% of pixels, then it is considered to be noise-dominated and hence unusable.
| Quadrant | # 1 sec bins | Bins with >0 counts | Bins with >2000 counts | High rate bins dominated by noise | Noise dominated (total time) | Noise dominated (detector-on time) | Marked lightcurve |
|---|---|---|---|---|---|---|---|
| A | 8994 | 5141 | 14 | 14 | 0.16% | 0.27% | 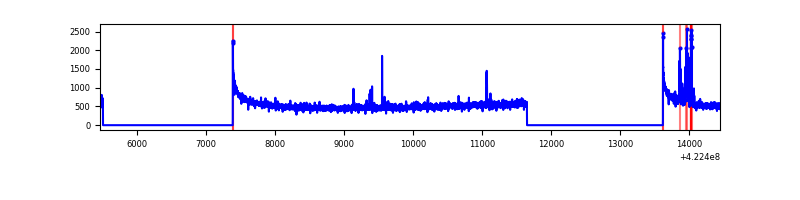 |
| B | 8994 | 5141 | 13 | 13 | 0.14% | 0.25% | 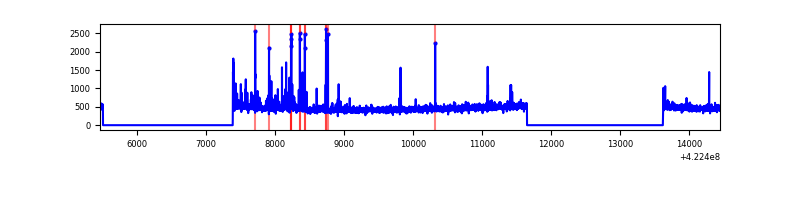 |
| C | 8994 | 5141 | 259 | 259 | 2.88% | 5.04% | 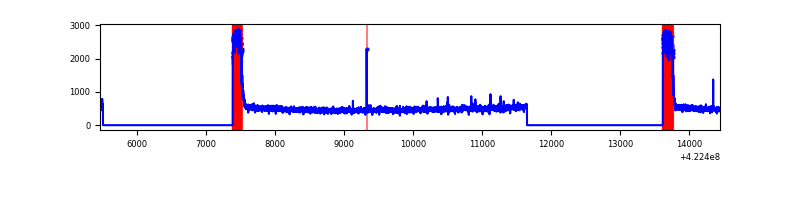 |
| D | 8994 | 5141 | 1168 | 1168 | 12.99% | 22.72% | 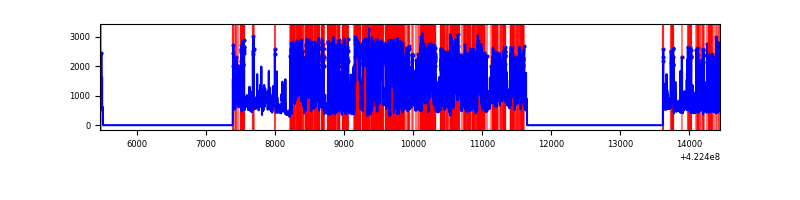 |
Top three noisy pixels from each quadrant. If the there are fewer than three noisy pixels in the level2.evt file, extra rows are filled as -1
| Pixel properties | Quadrant properties | ||||||
|---|---|---|---|---|---|---|---|
| Quadrant | DetID | PixID | Counts | Sigma | Mean | Median | Sigma |
| A | 10 | 83 | 486526 | 4092.03 | 578 | 569 | 118.8 |
| A | 7 | 3 | 96222 | 805.45 | 578 | 569 | 118.8 |
| A | 2 | 79 | 15276 | 123.84 | 578 | 569 | 118.8 |
| B | 0 | 190 | 89920 | 799.79 | 580 | 565 | 111.7 |
| B | 5 | 255 | 80082 | 711.74 | 580 | 565 | 111.7 |
| B | 12 | 111 | 13763 | 118.13 | 580 | 565 | 111.7 |
| C | 0 | 10 | 688834 | 5377.35 | 547 | 552 | 128.0 |
| C | 15 | 214 | 213182 | 1661.22 | 547 | 552 | 128.0 |
| C | 2 | 16 | 9680 | 71.31 | 547 | 552 | 128.0 |
| D | 1 | 47 | 2055397 | 16528.24 | 508 | 495 | 124.3 |
| D | 1 | 52 | 1928447 | 15507.14 | 508 | 495 | 124.3 |
| D | 13 | 249 | 393119 | 3158.0 | 508 | 495 | 124.3 |
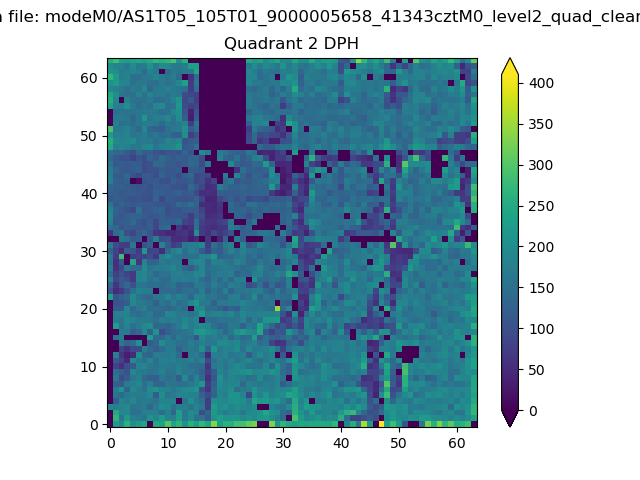
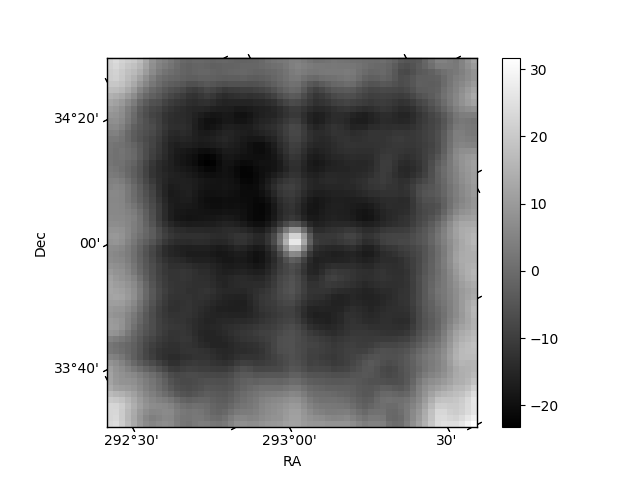
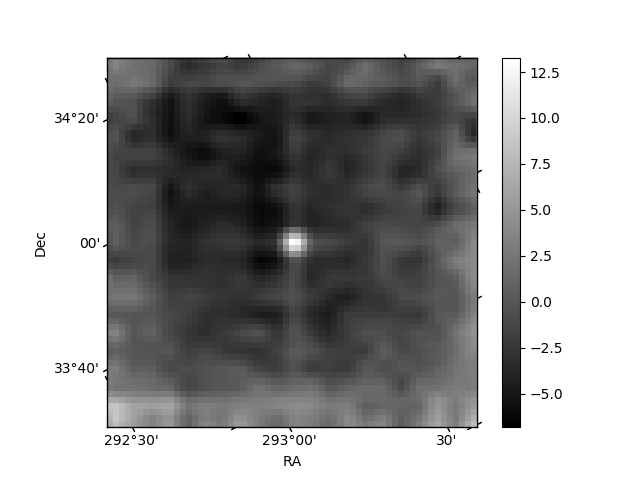
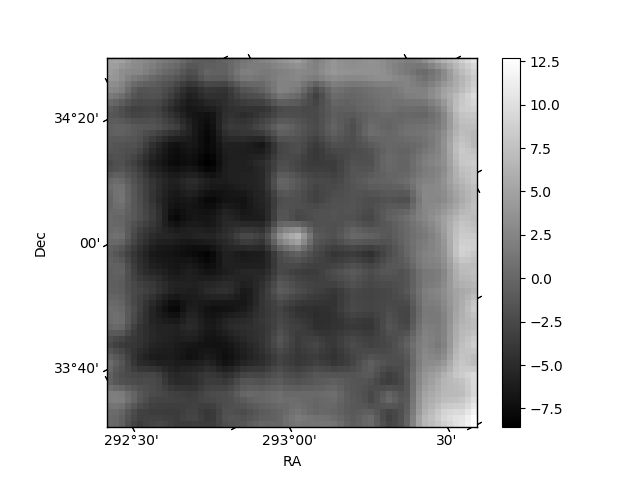
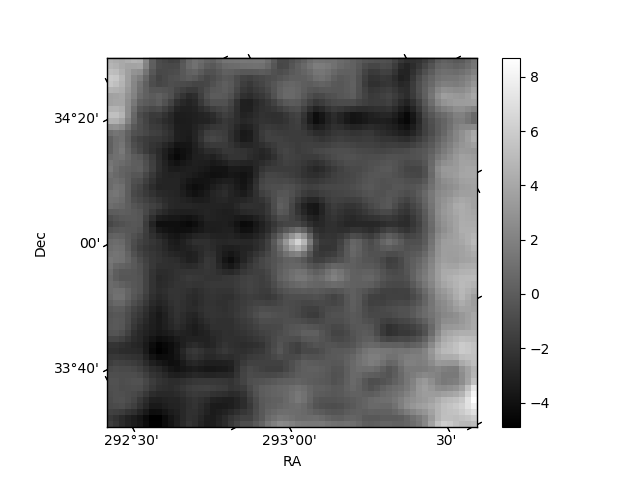
Histogram calculated using DETX and DETY for each event in the final _common_clean file
| Quadrant A | 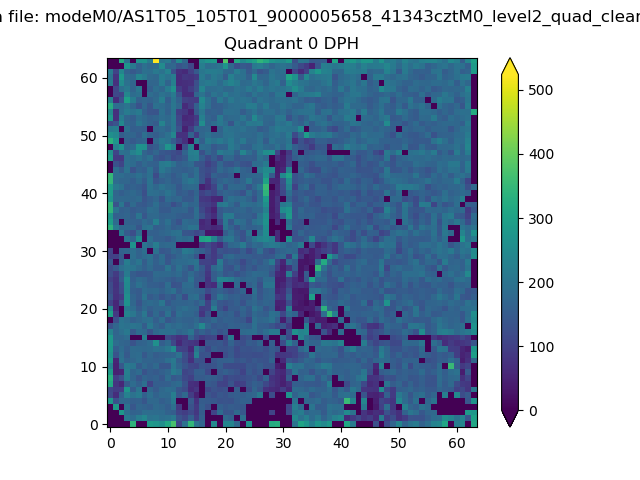 |
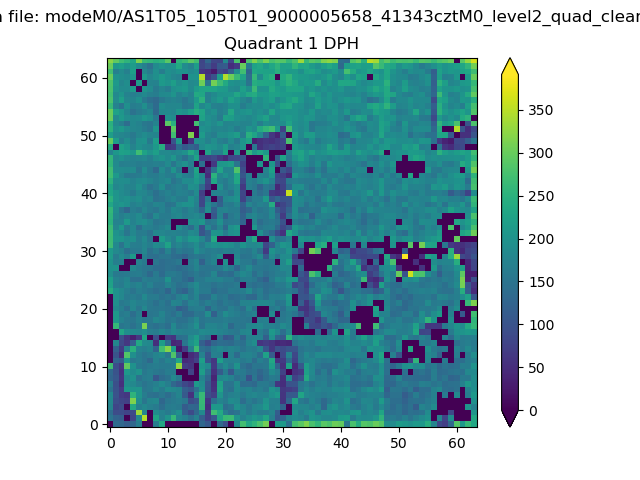 |
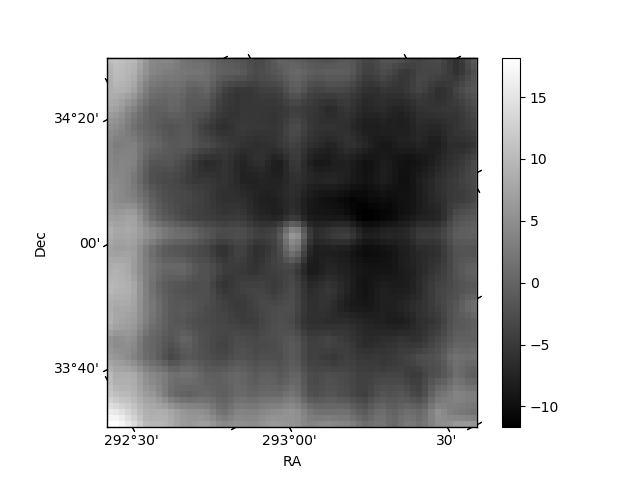
Quadrant B |
|---|---|---|---|
| Quadrant D | 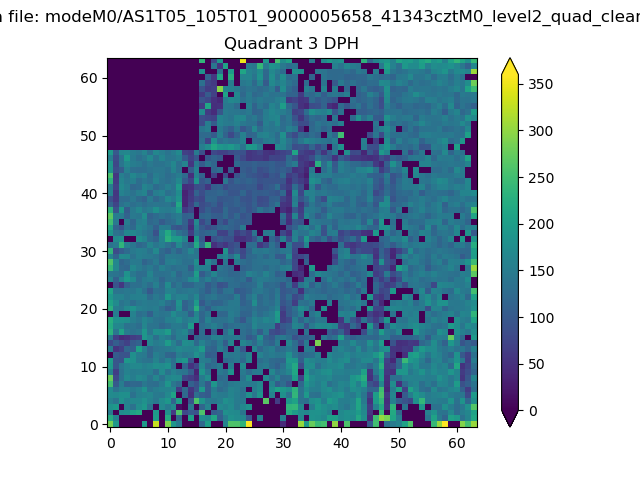 |
 |
Quadrant C |
| Plot type | Count rate plots | Images |
|---|---|---|
| Comparison with Poisson distribution Blue bars denote a histogram of data divided into 1 sec bins. Red curve is a Poisson curve with rate = median count rate of data. |
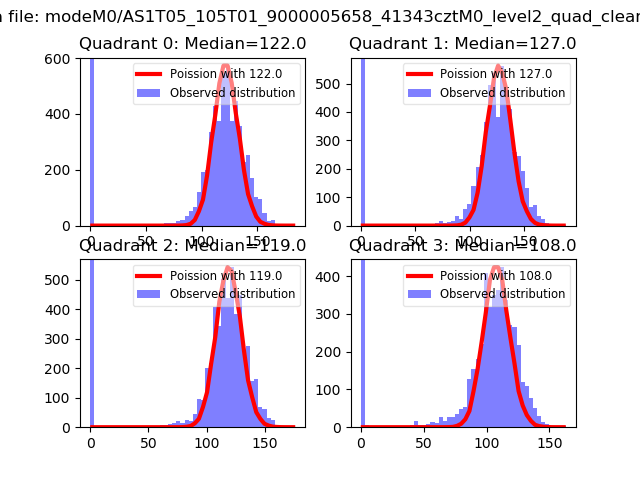 |
 |
| Quadrant-wise count rates Data is divided into 100 sec bins |
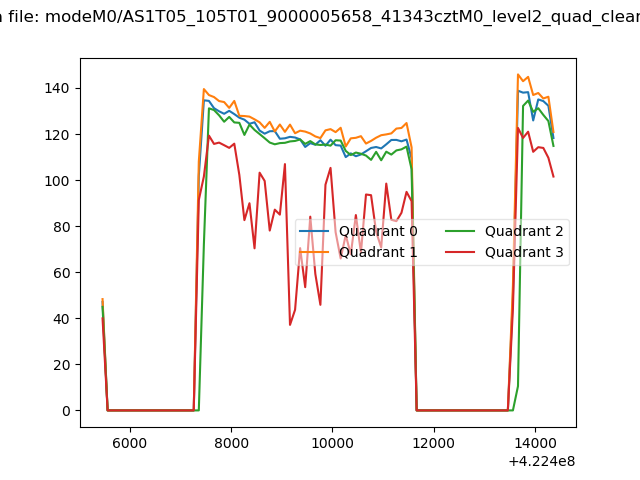 |
|
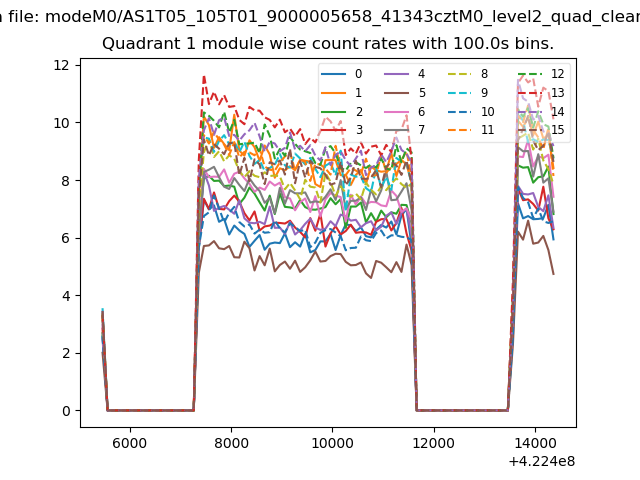
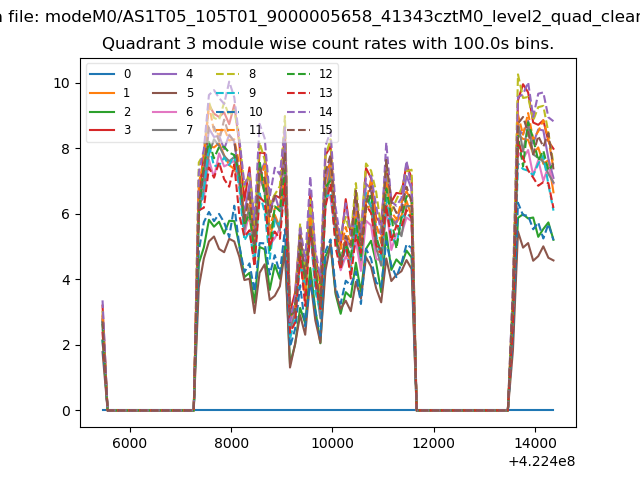
| Module-wise count rates for Quadrant A Data is divided into 100 sec bins |
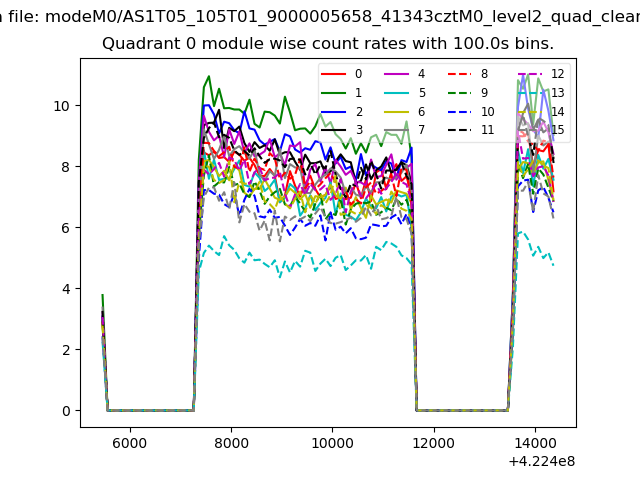 |
 |
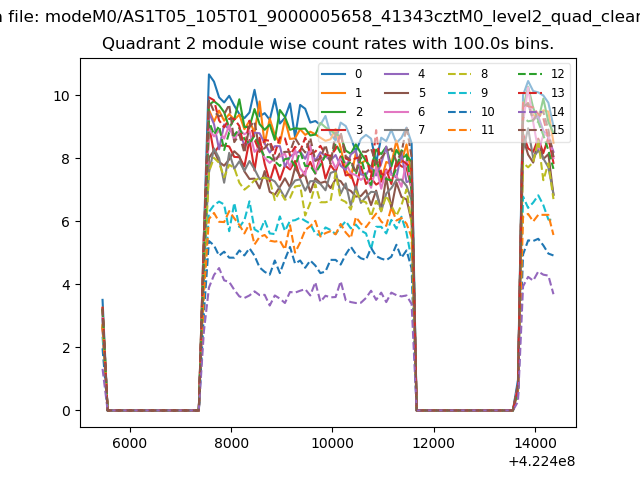
| Module-wise count rates for Quadrant B Data is divided into 100 sec bins |
 |
 |
| Module-wise count rates for Quadrant C Data is divided into 100 sec bins |
 |
 |
| Module-wise count rates for Quadrant D Data is divided into 100 sec bins |
 |
 |
| Parameter | Plot |
|---|---|
| CZT HV Monitor | 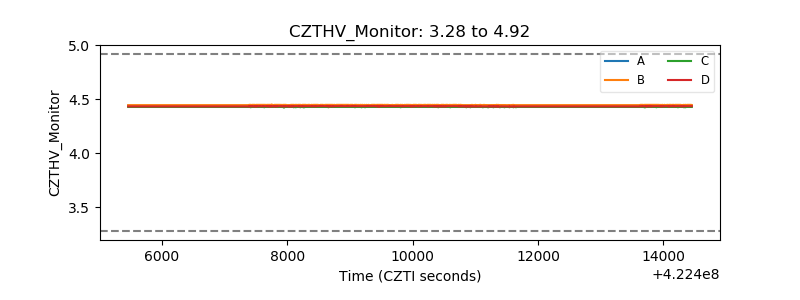 |
| D_VDD | 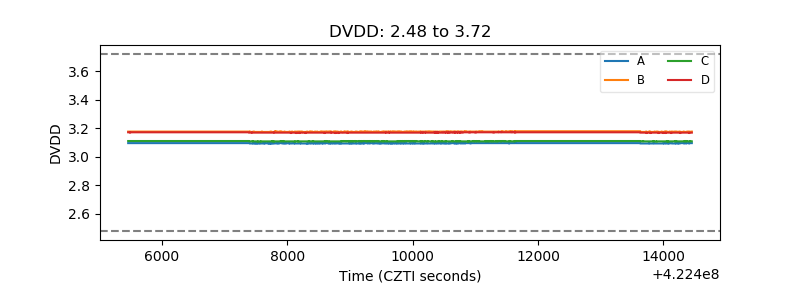 |
| Temperature 1 | 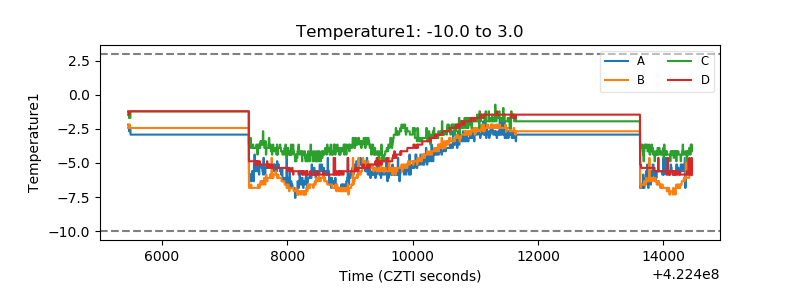 |
| Veto HV Monitor | 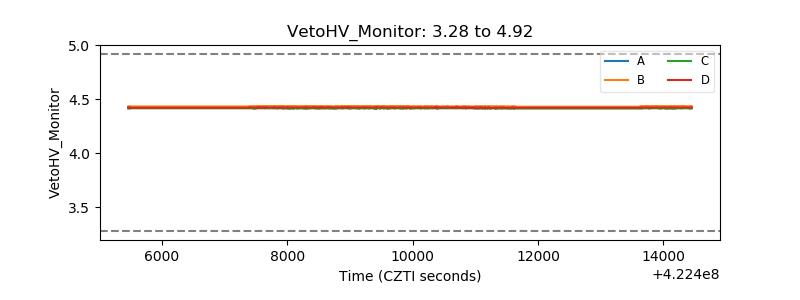 |
| Veto LLD | 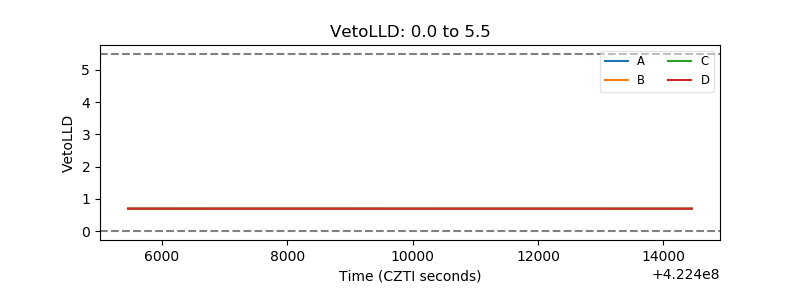 |
| Alpha Counter | 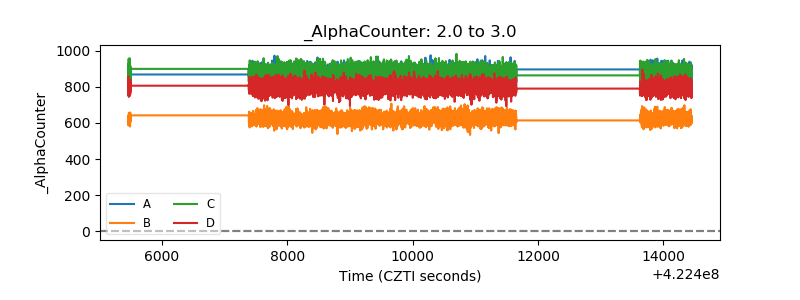 |
| _CPM_Rate | 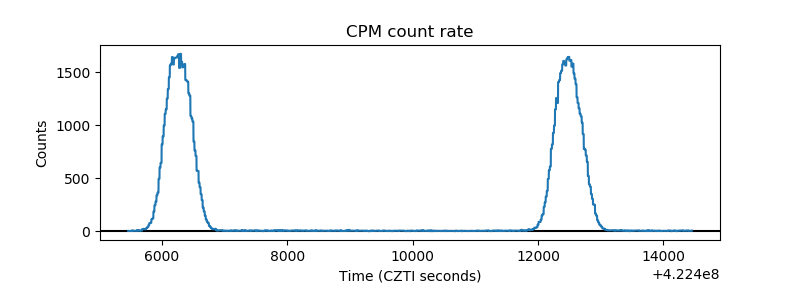 |
| CZT Counter | 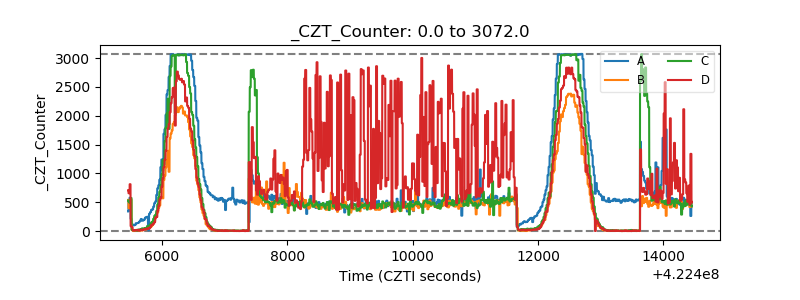 |
| +2.5 Volts monitor | 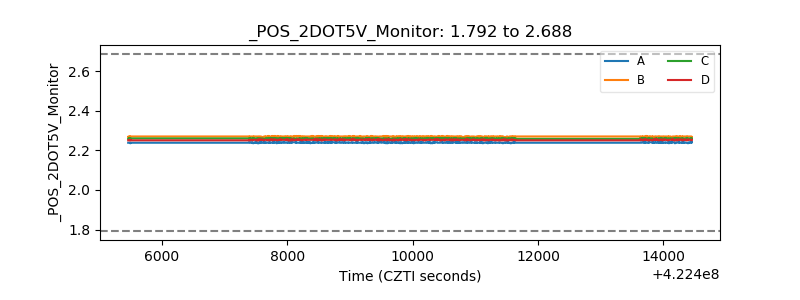 |
| +5 Volts monitor | 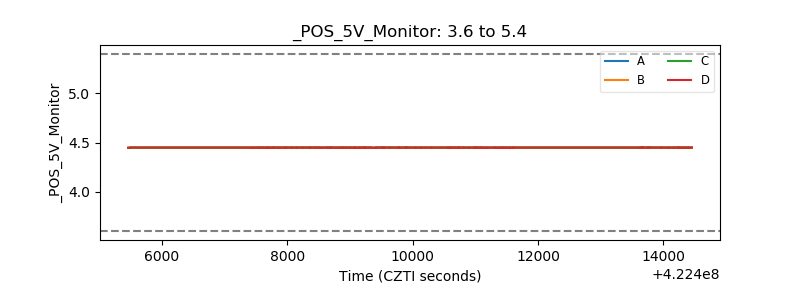 |
| _ROLL_ROT | 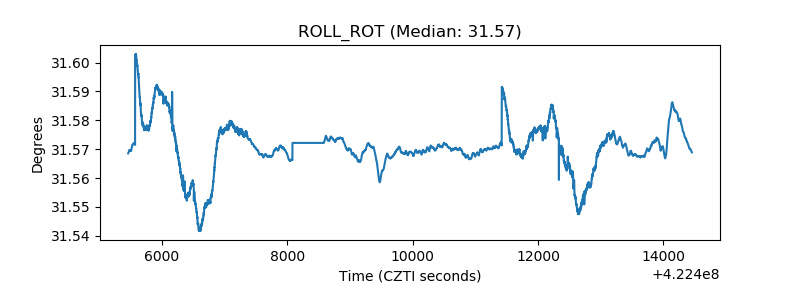 |
| _Roll_DEC | 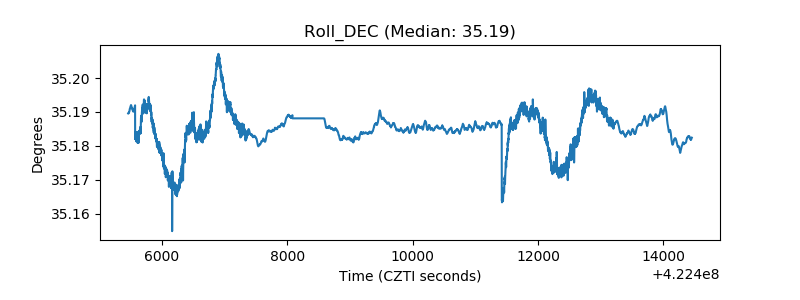 |
| _Roll_RA | 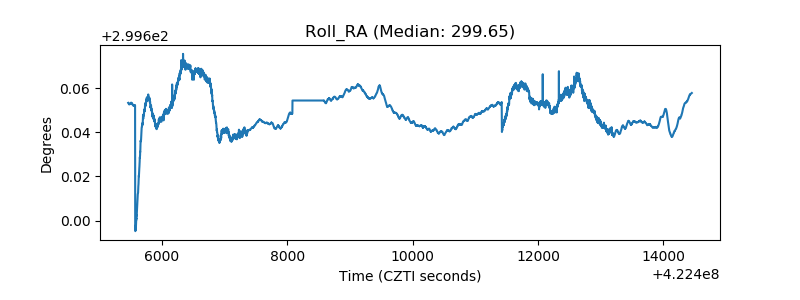 |
| Veto Counter | 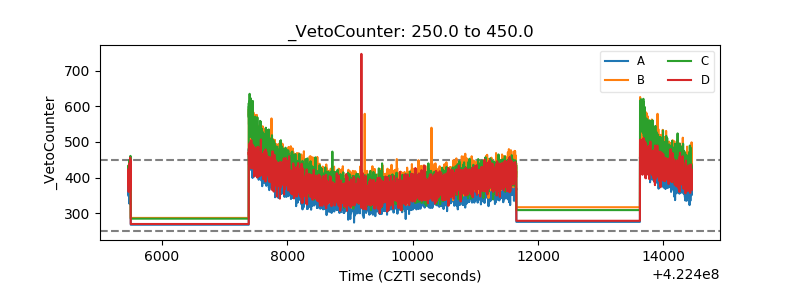 |