| Param | Original file | Final file |
|---|---|---|
| Filename | modeM0/AS1T05_105T01_9000005658_41344cztM0_level2.fits | modeM0/AS1T05_105T01_9000005658_41344cztM0_level2_quad_clean.evt |
| Size (bytes) | 1,329,410,880 | 319,187,520 |
| Size | 1.2 GB | 304.4 MB |
| Events in quadrant A | 9,894,664 | 2,201,352 |
| Events in quadrant B | 9,631,056 | 2,238,170 |
| Events in quadrant C | 10,315,190 | 2,129,042 |
| Events in quadrant D | 17,862,079 | 1,754,756 |
| Mode M9 | |||
|---|---|---|---|
| Quadrant | BADHDUFLAG | Total packets | Discarded packets |
| A | 0 | 84 | 12 |
| B | 0 | 82 | 5 |
| C | 0 | 84 | 6 |
| D | 0 | 80 | 6 |
| Mode SS | |||
|---|---|---|---|
| Quadrant | BADHDUFLAG | Total packets | Discarded packets |
| A | 0 | 420 | 18 |
| B | 0 | 422 | 20 |
| C | 0 | 419 | 22 |
| D | 0 | 418 | 23 |
| Mode M0 | |||
|---|---|---|---|
| Quadrant | BADHDUFLAG | Total packets | Discarded packets |
| A | 0 | 43856 | 2609 |
| B | 0 | 44314 | 2206 |
| C | 0 | 45465 | 2639 |
| D | 0 | 71411 | 4560 |
| Quadrant | Total seconds | Saturated seconds | Saturation percentage |
|---|---|---|---|
| A | 19489 | 25 | 0.128277% |
| B | 19500 | 189 | 0.969231% |
| C | 19526 | 453 | 2.319984% |
| D | 19345 | 2432 | 12.571724% |
Noise dominated data is calculated using 1-second bins in cleaned event files. If a bin has >2000 counts, and if more than 50% of those come from <1% of pixels, then it is considered to be noise-dominated and hence unusable.
| Quadrant | # 1 sec bins | Bins with >0 counts | Bins with >2000 counts | High rate bins dominated by noise | Noise dominated (total time) | Noise dominated (detector-on time) | Marked lightcurve |
|---|---|---|---|---|---|---|---|
| A | 30678 | 19868 | 10 | 10 | 0.03% | 0.05% | 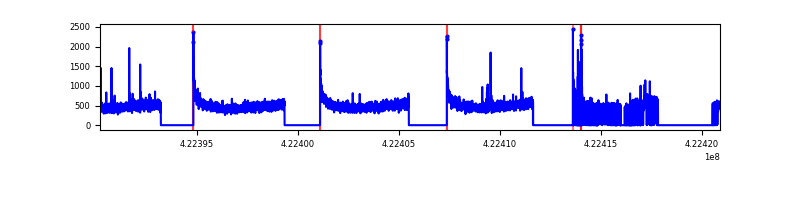 |
| B | 30678 | 19911 | 137 | 137 | 0.45% | 0.69% | 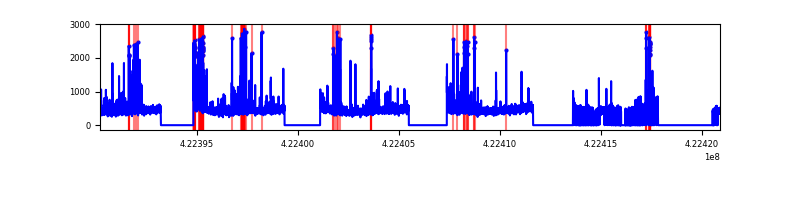 |
| C | 30678 | 19873 | 439 | 439 | 1.43% | 2.21% | 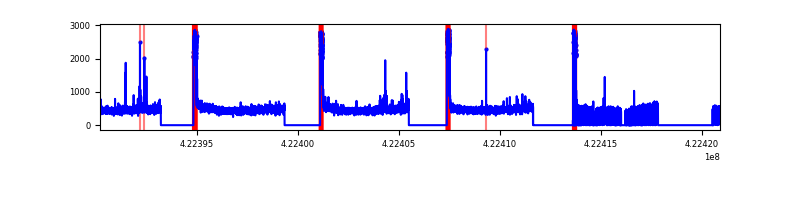 |
| D | 30678 | 19754 | 2558 | 2558 | 8.34% | 12.95% | 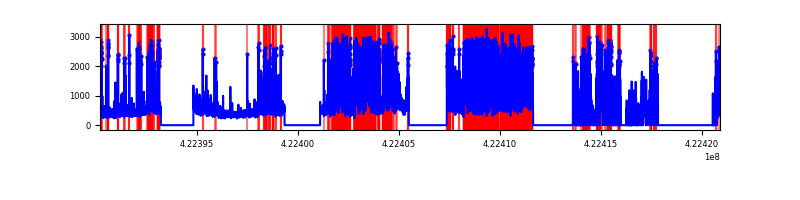 |
Top three noisy pixels from each quadrant. If the there are fewer than three noisy pixels in the level2.evt file, extra rows are filled as -1
| Pixel properties | Quadrant properties | ||||||
|---|---|---|---|---|---|---|---|
| Quadrant | DetID | PixID | Counts | Sigma | Mean | Median | Sigma |
| A | 10 | 83 | 1478224 | 3372.82 | 2150 | 2109 | 437.7 |
| A | 2 | 79 | 41282 | 89.51 | 2150 | 2109 | 437.7 |
| A | 7 | 3 | 41112 | 89.12 | 2150 | 2109 | 437.7 |
| B | 5 | 255 | 822478 | 2025.27 | 2135 | 2081 | 405.1 |
| B | 0 | 190 | 327736 | 803.93 | 2135 | 2081 | 405.1 |
| B | 0 | 229 | 71578 | 171.56 | 2135 | 2081 | 405.1 |
| C | 0 | 10 | 1328228 | 2779.61 | 2060 | 2078 | 477.1 |
| C | 15 | 214 | 803219 | 1679.19 | 2060 | 2078 | 477.1 |
| C | 2 | 16 | 39194 | 77.8 | 2060 | 2078 | 477.1 |
| D | 1 | 47 | 3105237 | 6542.92 | 1950 | 1897 | 474.3 |
| D | 1 | 52 | 2639665 | 5561.33 | 1950 | 1897 | 474.3 |
| D | 13 | 249 | 1883569 | 3967.22 | 1950 | 1897 | 474.3 |
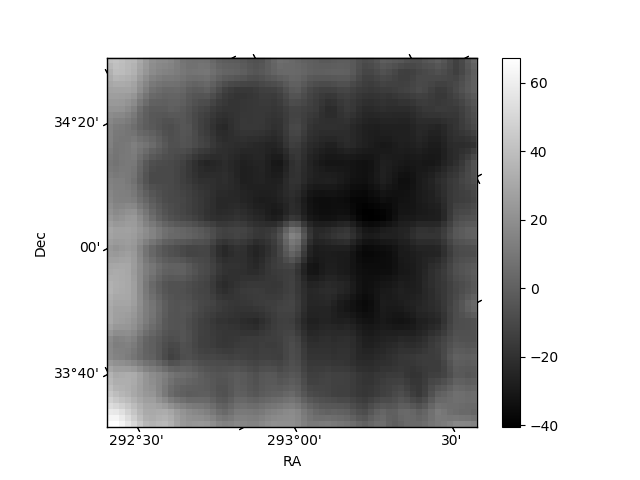
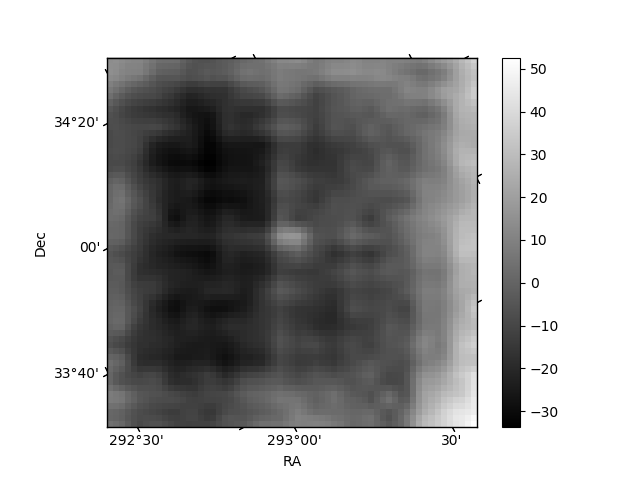
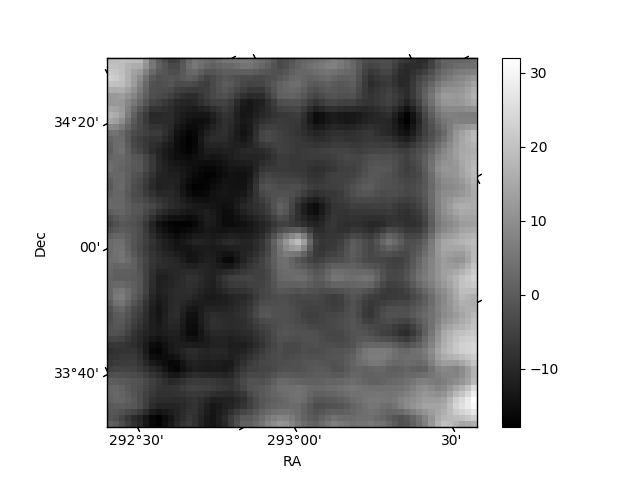
Histogram calculated using DETX and DETY for each event in the final _common_clean file
| Quadrant A | 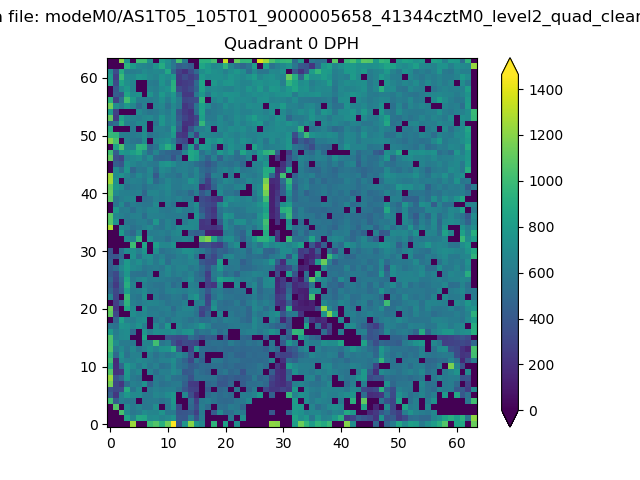 |
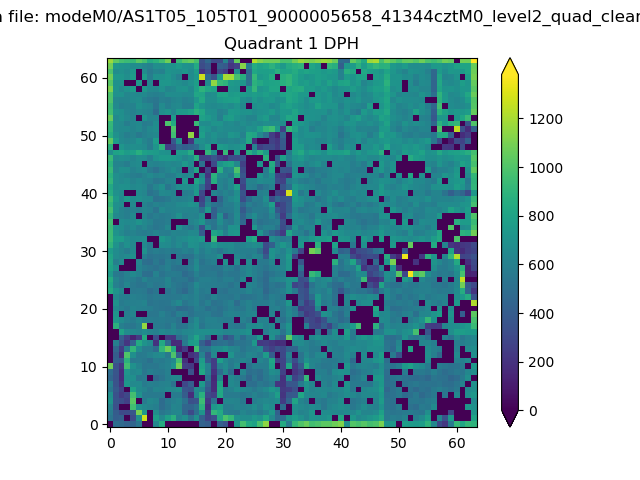 |
Quadrant B |
|---|---|---|---|
| Quadrant D | 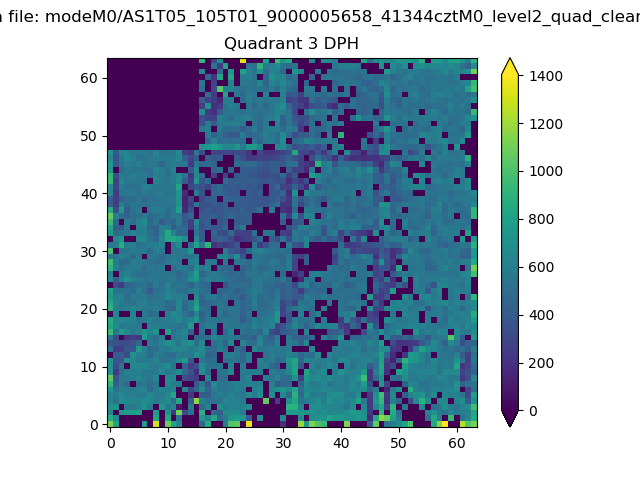 |
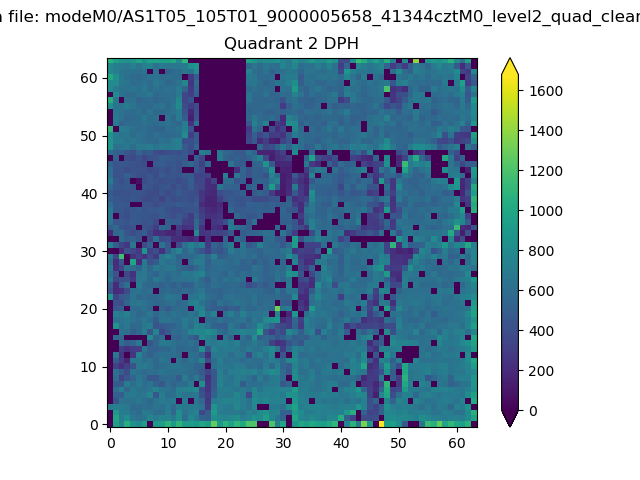 |
Quadrant C |
| Plot type | Count rate plots | Images |
|---|---|---|
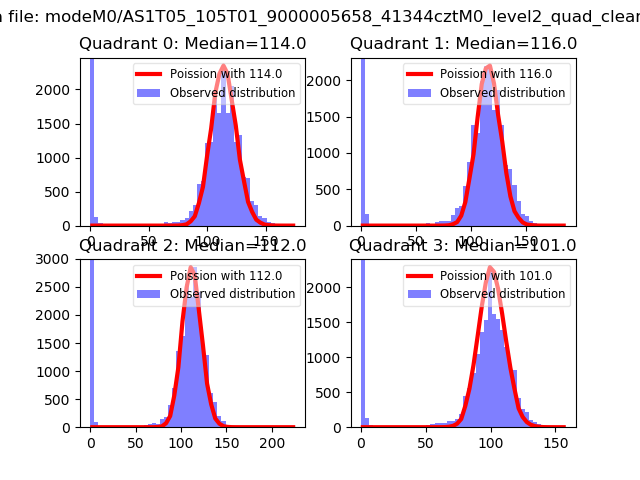
| Comparison with Poisson distribution Blue bars denote a histogram of data divided into 1 sec bins. Red curve is a Poisson curve with rate = median count rate of data. |
 |
 |
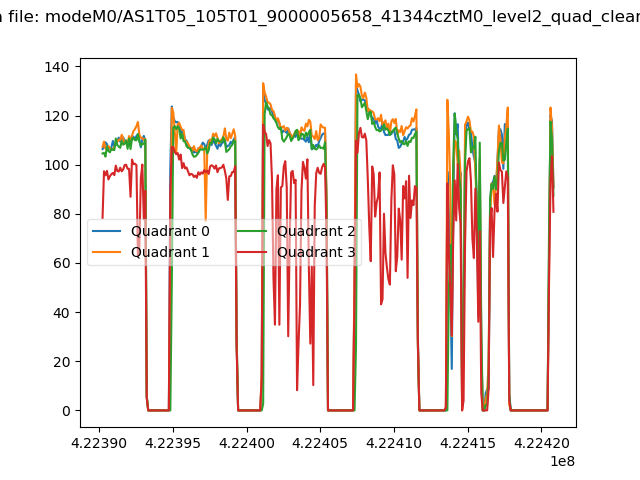
| Quadrant-wise count rates Data is divided into 100 sec bins |
 |
|
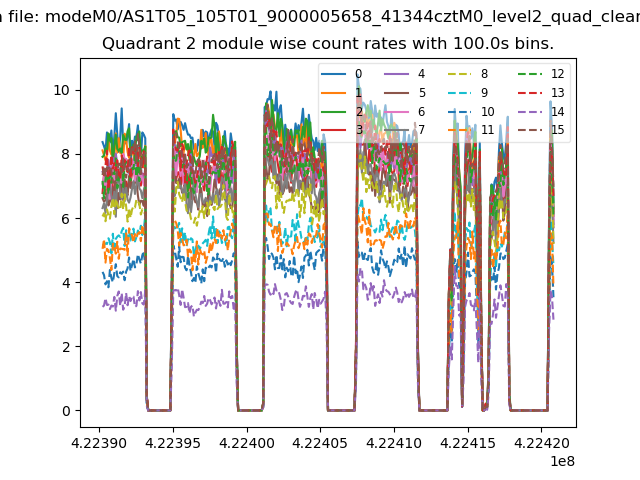
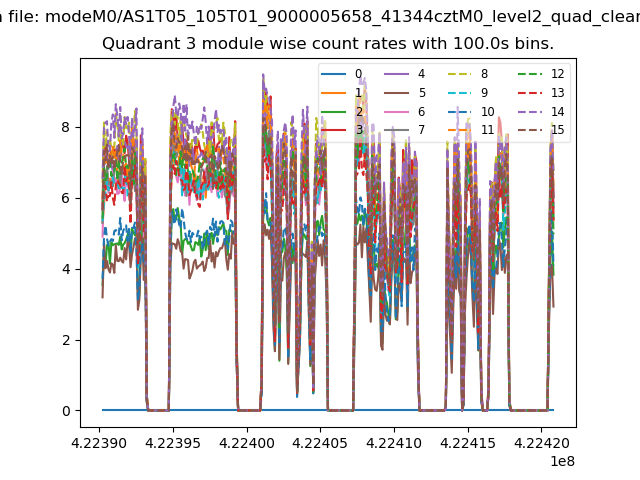
| Module-wise count rates for Quadrant A Data is divided into 100 sec bins |
 |
 |
| Module-wise count rates for Quadrant B Data is divided into 100 sec bins |
 |
 |
| Module-wise count rates for Quadrant C Data is divided into 100 sec bins |
 |
 |
| Module-wise count rates for Quadrant D Data is divided into 100 sec bins |
 |
 |
| Parameter | Plot |
|---|---|
| CZT HV Monitor | 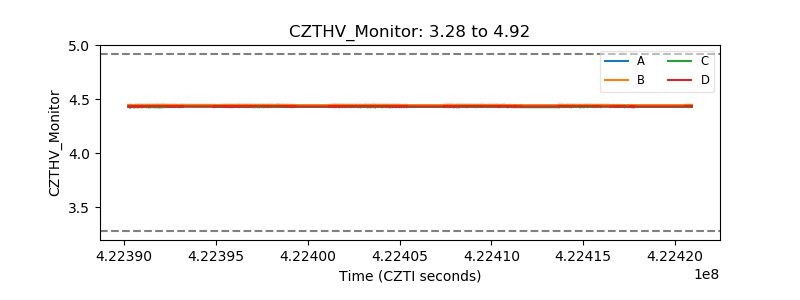 |
| D_VDD | 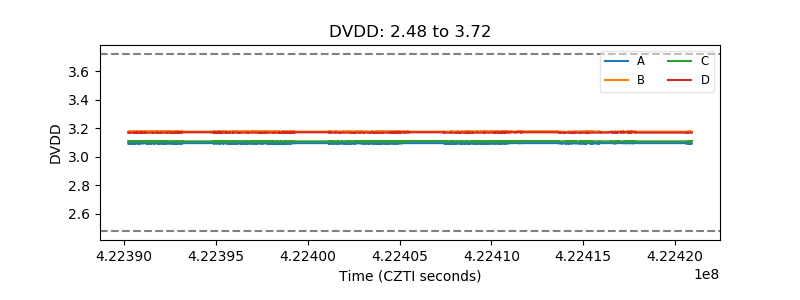 |
| Temperature 1 | 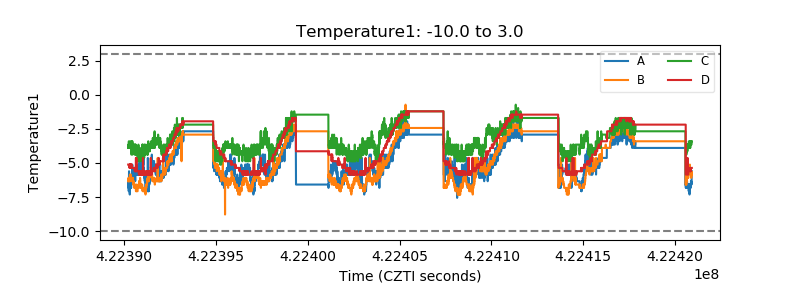 |
| Veto HV Monitor |  |
| Veto LLD | 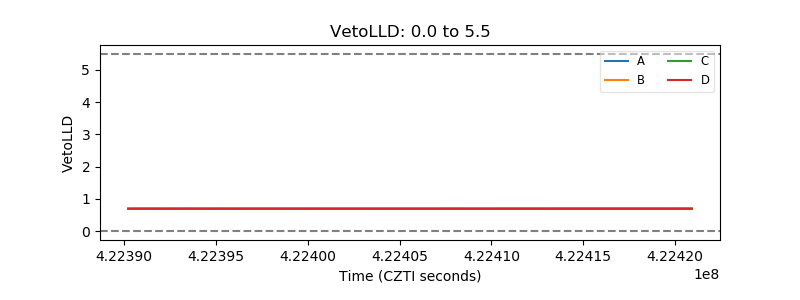 |
| Alpha Counter | 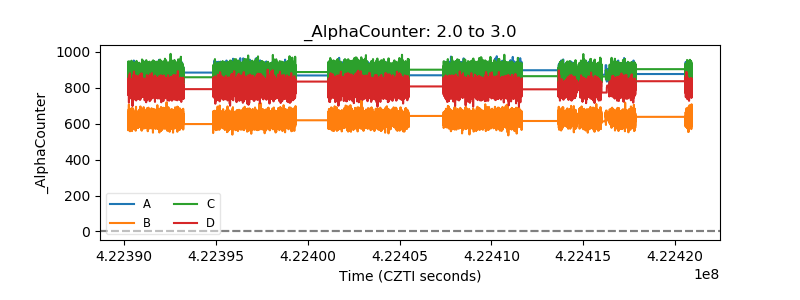 |
| _CPM_Rate | 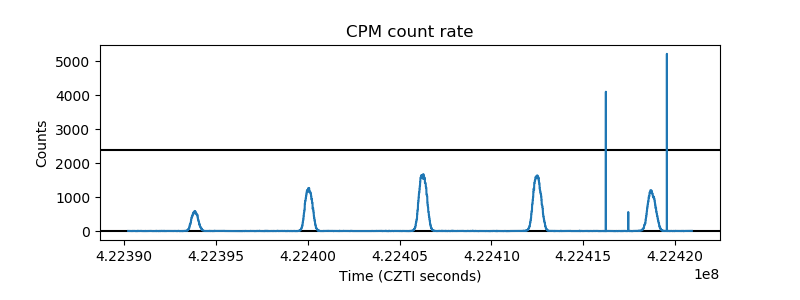 |
| CZT Counter | 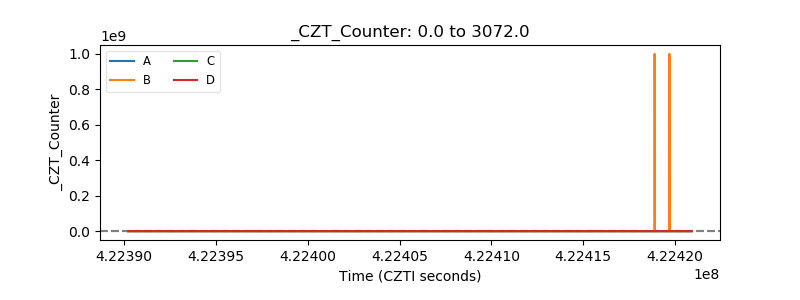 |
| +2.5 Volts monitor | 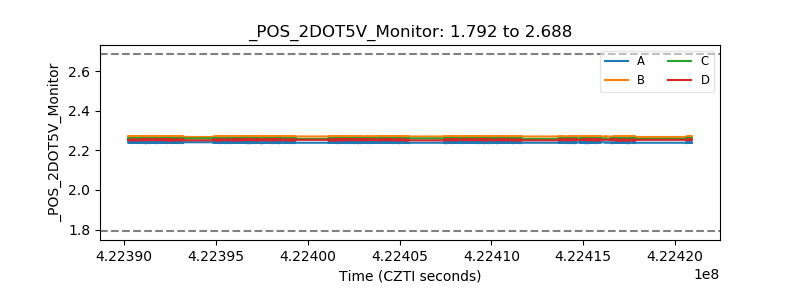 |
| +5 Volts monitor | 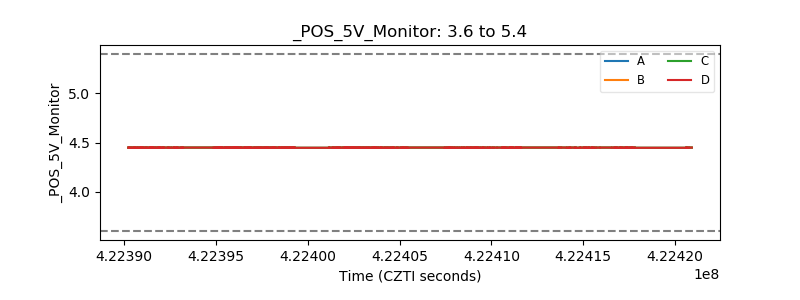 |
| _ROLL_ROT | 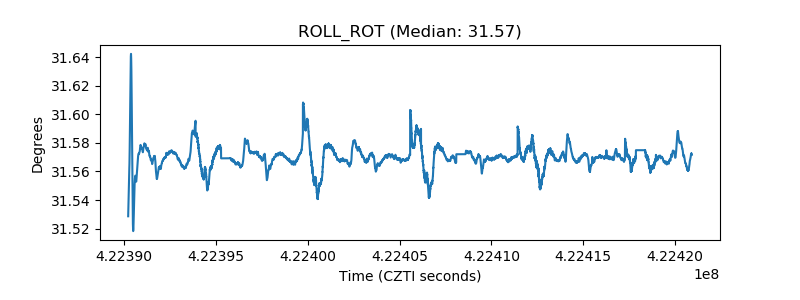 |
| _Roll_DEC | 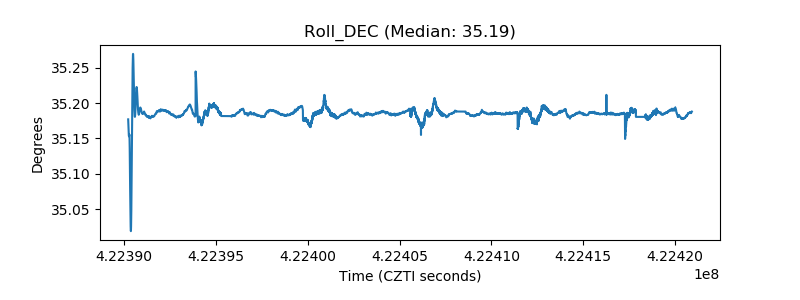 |
| _Roll_RA | 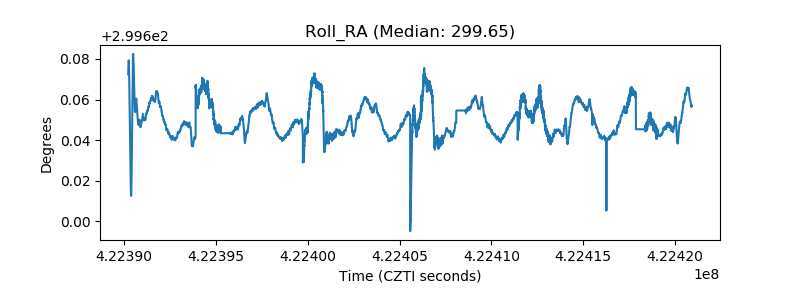 |
| Veto Counter | 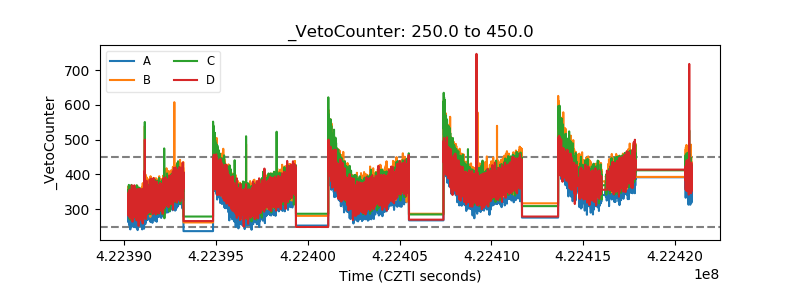 |