| Param | Original file | Final file |
|---|---|---|
| Filename | modeM0/AS1T05_105T01_9000005658_41345cztM0_level2.fits | modeM0/AS1T05_105T01_9000005658_41345cztM0_level2_quad_clean.evt |
| Size (bytes) | 138,401,280 | 38,931,840 |
| Size | 132.0 MB | 37.1 MB |
| Events in quadrant A | 1,242,829 | 255,214 |
| Events in quadrant B | 1,117,188 | 278,240 |
| Events in quadrant C | 1,261,392 | 247,305 |
| Events in quadrant D | 1,315,127 | 228,163 |
| Mode M9 | |||
|---|---|---|---|
| Quadrant | BADHDUFLAG | Total packets | Discarded packets |
| A | 0 | 19 | 5 |
| B | 0 | 17 | 3 |
| C | 0 | 19 | 5 |
| D | 0 | 21 | 6 |
| Mode SS | |||
|---|---|---|---|
| Quadrant | BADHDUFLAG | Total packets | Discarded packets |
| A | 0 | 87 | 39 |
| B | 0 | 88 | 36 |
| C | 0 | 87 | 37 |
| D | 0 | 87 | 43 |
| Mode M0 | |||
|---|---|---|---|
| Quadrant | BADHDUFLAG | Total packets | Discarded packets |
| A | 0 | 9456 | 4428 |
| B | 0 | 8784 | 3816 |
| C | 0 | 9912 | 4774 |
| D | 0 | 10524 | 4976 |
| Quadrant | Total seconds | Saturated seconds | Saturation percentage |
|---|---|---|---|
| A | 2311 | 1 | 0.043271% |
| B | 2423 | 5 | 0.206356% |
| C | 2341 | 42 | 1.794105% |
| D | 2343 | 50 | 2.134016% |
Noise dominated data is calculated using 1-second bins in cleaned event files. If a bin has >2000 counts, and if more than 50% of those come from <1% of pixels, then it is considered to be noise-dominated and hence unusable.
| Quadrant | # 1 sec bins | Bins with >0 counts | Bins with >2000 counts | High rate bins dominated by noise | Noise dominated (total time) | Noise dominated (detector-on time) | Marked lightcurve |
|---|---|---|---|---|---|---|---|
| A | 7218 | 2737 | 0 | 0 | 0.00% | 0.00% | 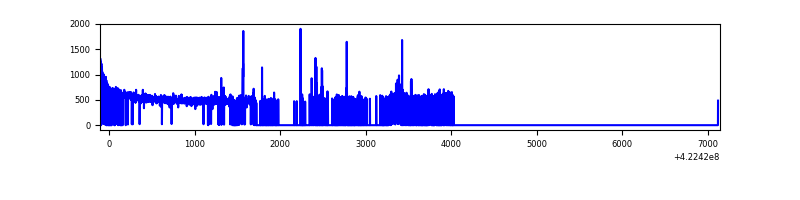 |
| B | 7247 | 2826 | 0 | 0 | 0.00% | 0.00% | 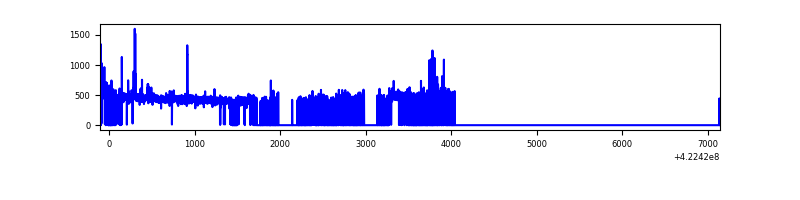 |
| C | 4128 | 2746 | 39 | 39 | 0.94% | 1.42% | 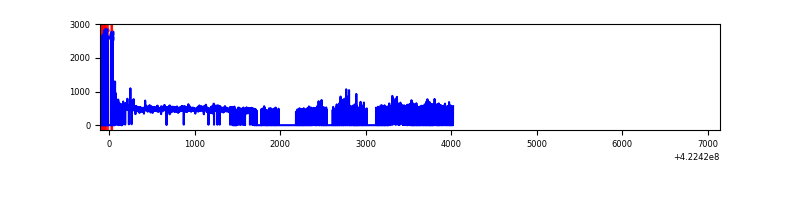 |
| D | 7233 | 2752 | 50 | 50 | 0.69% | 1.82% | 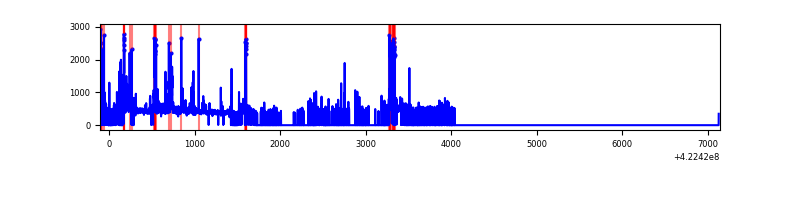 |
Top three noisy pixels from each quadrant. If the there are fewer than three noisy pixels in the level2.evt file, extra rows are filled as -1
| Pixel properties | Quadrant properties | ||||||
|---|---|---|---|---|---|---|---|
| Quadrant | DetID | PixID | Counts | Sigma | Mean | Median | Sigma |
| A | 10 | 83 | 206105 | 3829.13 | 259 | 255 | 53.8 |
| A | 2 | 79 | 28496 | 525.33 | 259 | 255 | 53.8 |
| A | 12 | 189 | 4039 | 70.39 | 259 | 255 | 53.8 |
| B | 0 | 190 | 29291 | 541.04 | 270 | 265 | 53.6 |
| B | 5 | 255 | 16734 | 306.98 | 270 | 265 | 53.6 |
| B | 0 | 155 | 6917 | 123.99 | 270 | 265 | 53.6 |
| C | 0 | 10 | 163170 | 2704.0 | 250 | 251 | 60.3 |
| C | 15 | 214 | 98686 | 1633.75 | 250 | 251 | 60.3 |
| C | 7 | 220 | 21004 | 344.44 | 250 | 251 | 60.3 |
| D | 13 | 249 | 144521 | 2330.69 | 248 | 242 | 61.9 |
| D | 1 | 47 | 107340 | 1730.06 | 248 | 242 | 61.9 |
| D | 5 | 222 | 76243 | 1227.72 | 248 | 242 | 61.9 |
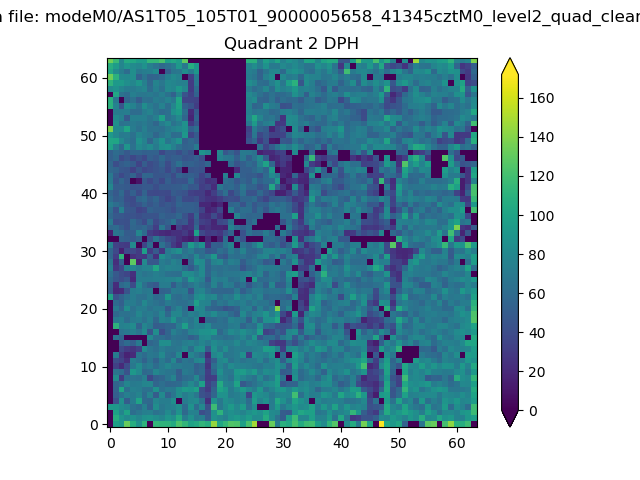
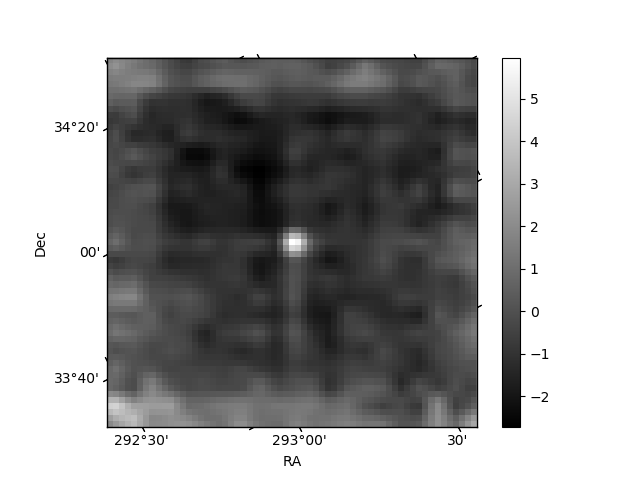
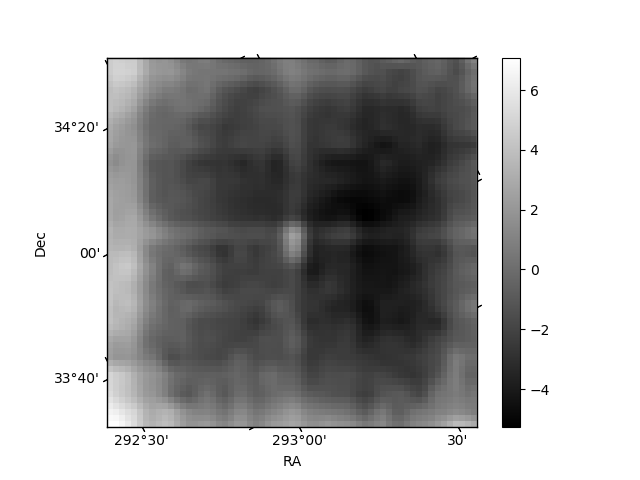
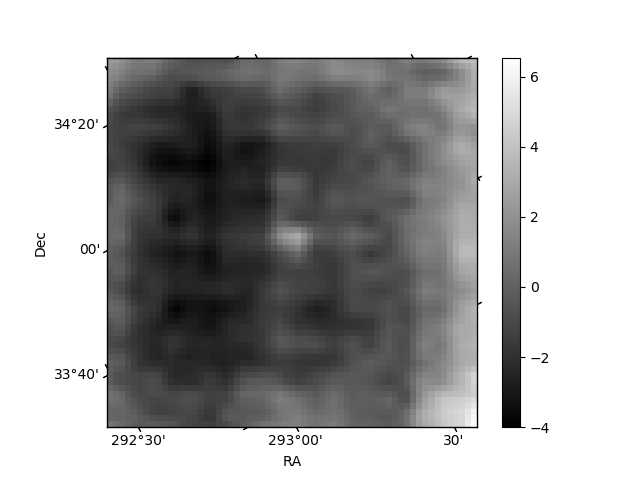
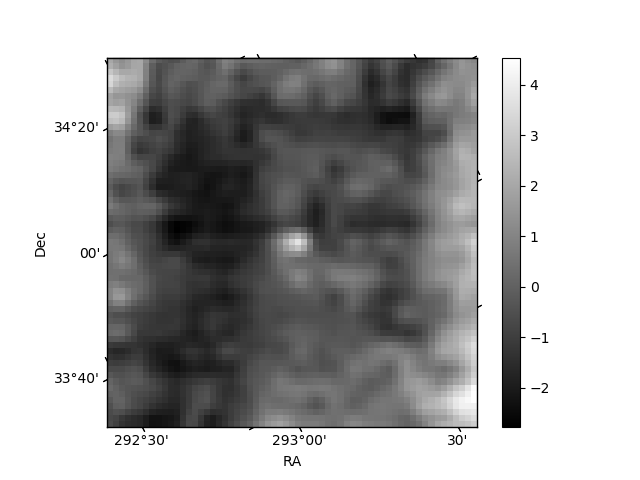
Histogram calculated using DETX and DETY for each event in the final _common_clean file
| Quadrant A | 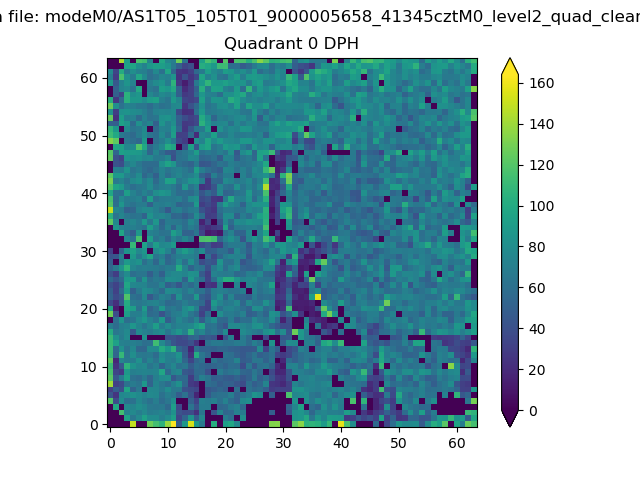 |
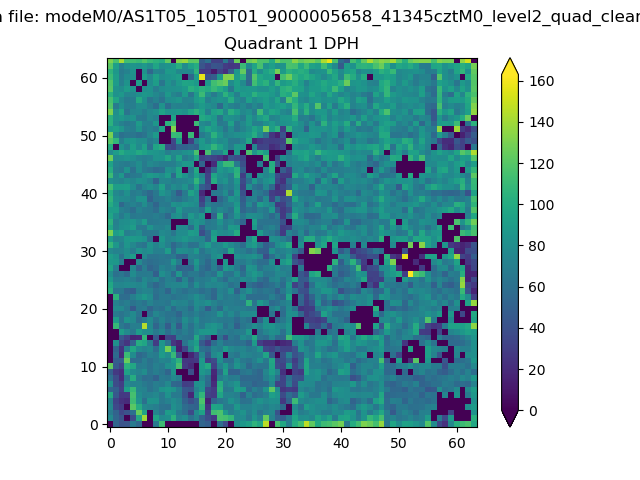 |
Quadrant B |
|---|---|---|---|
| Quadrant D | 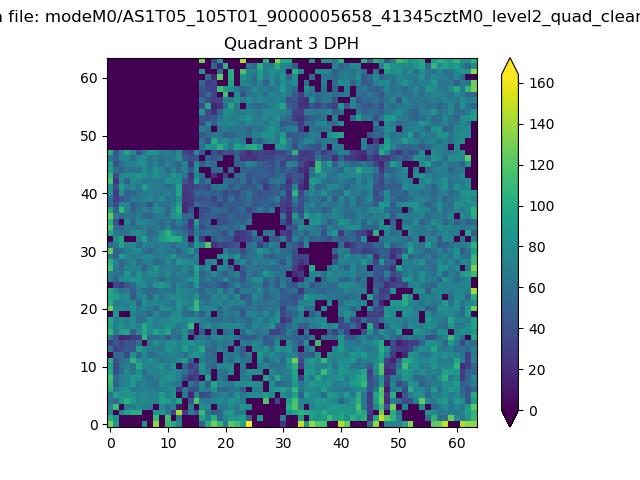 |
 |
Quadrant C |
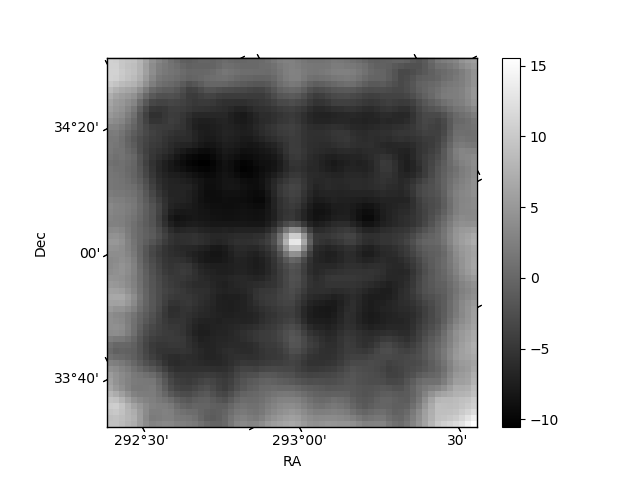
| Plot type | Count rate plots | Images |
|---|---|---|
| Comparison with Poisson distribution Blue bars denote a histogram of data divided into 1 sec bins. Red curve is a Poisson curve with rate = median count rate of data. |
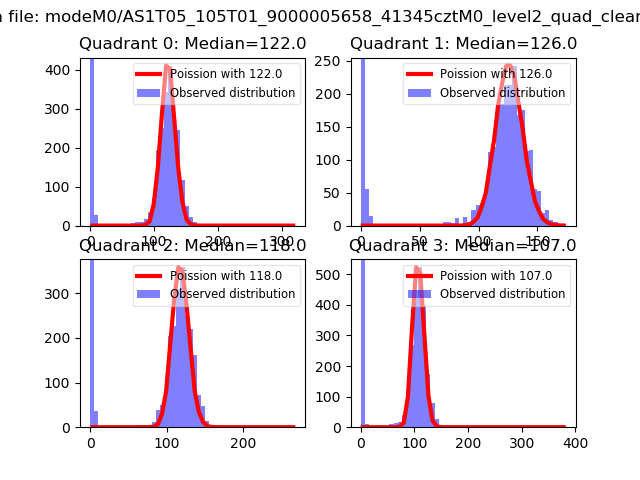 |
 |
| Quadrant-wise count rates Data is divided into 100 sec bins |
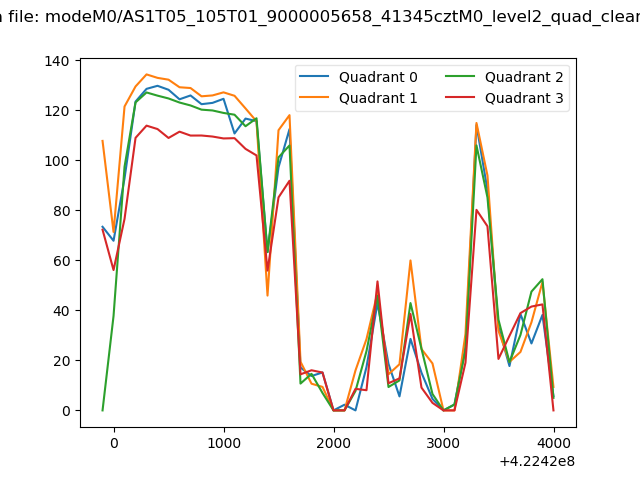 |
|
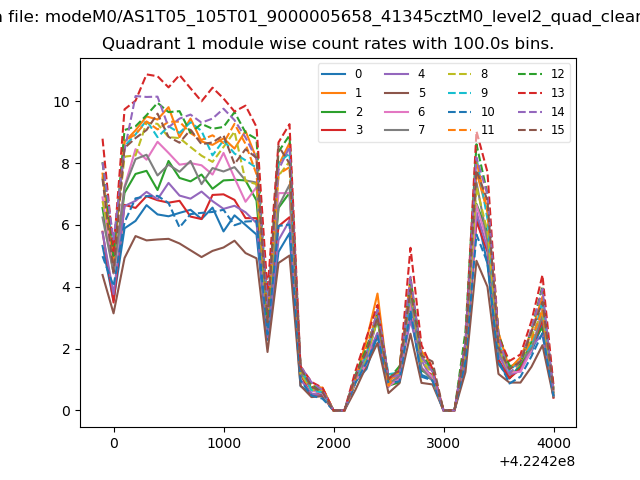
| Module-wise count rates for Quadrant A Data is divided into 100 sec bins |
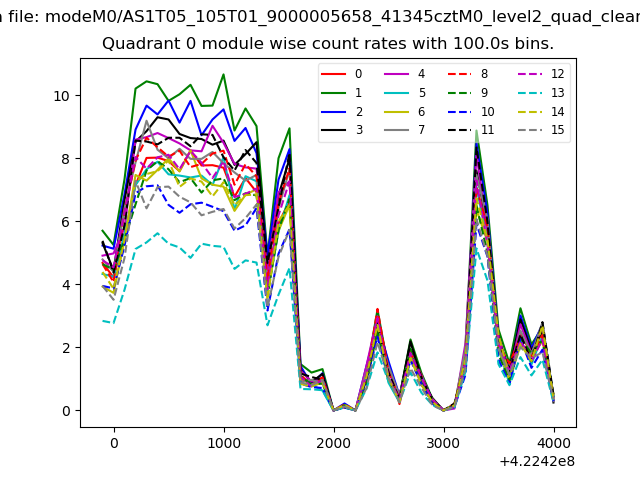 |
 |
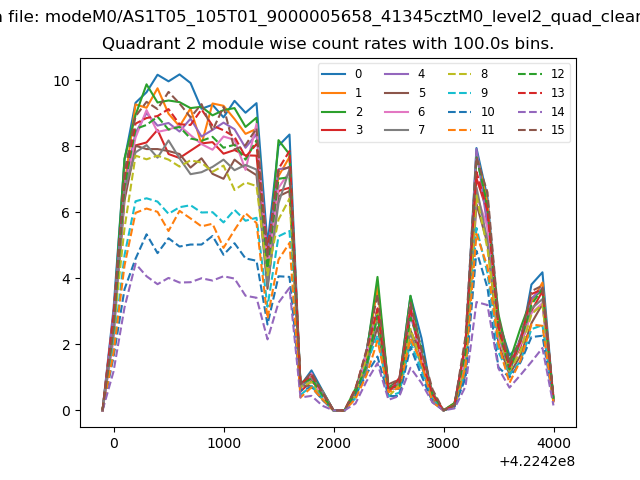
| Module-wise count rates for Quadrant B Data is divided into 100 sec bins |
 |
 |
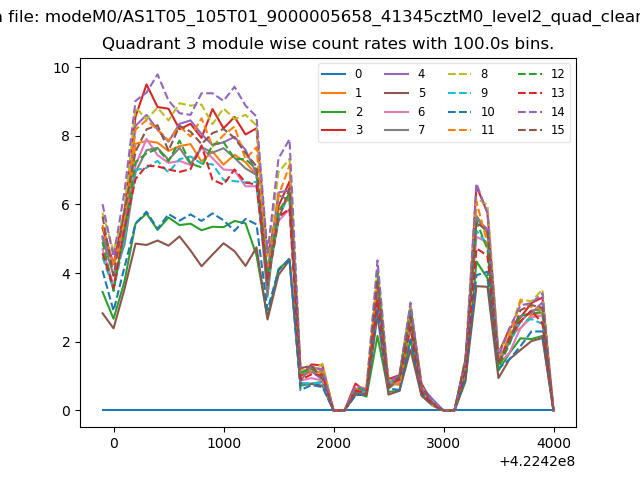
| Module-wise count rates for Quadrant C Data is divided into 100 sec bins |
 |
 |
| Module-wise count rates for Quadrant D Data is divided into 100 sec bins |
 |
 |
| Parameter | Plot |
|---|---|
| CZT HV Monitor | 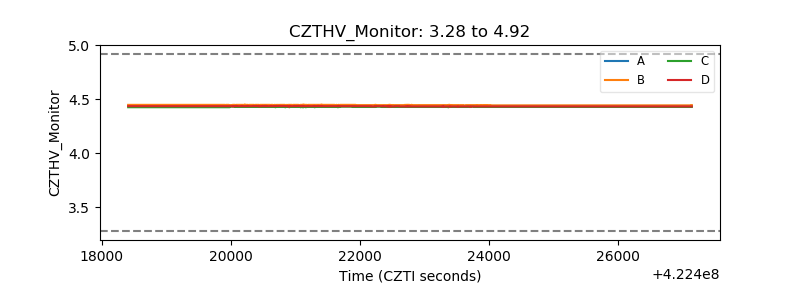 |
| D_VDD | 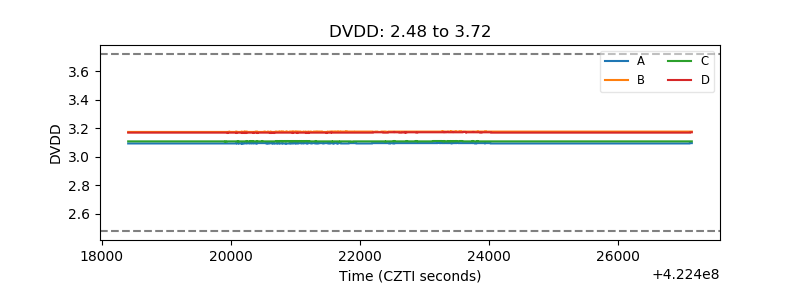 |
| Temperature 1 | 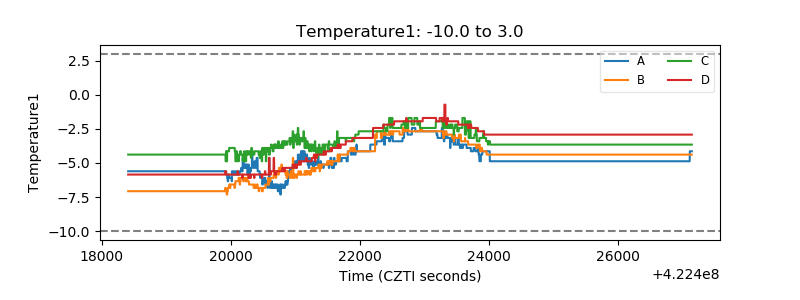 |
| Veto HV Monitor | 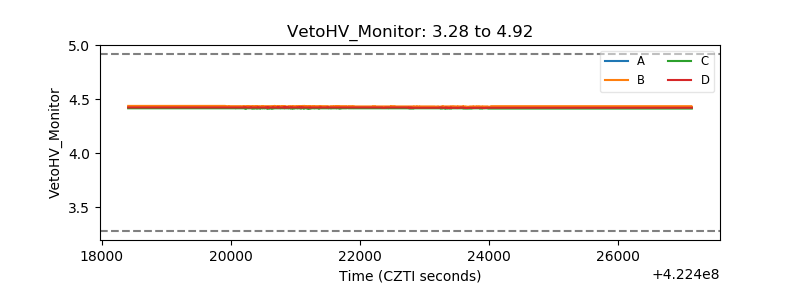 |
| Veto LLD | 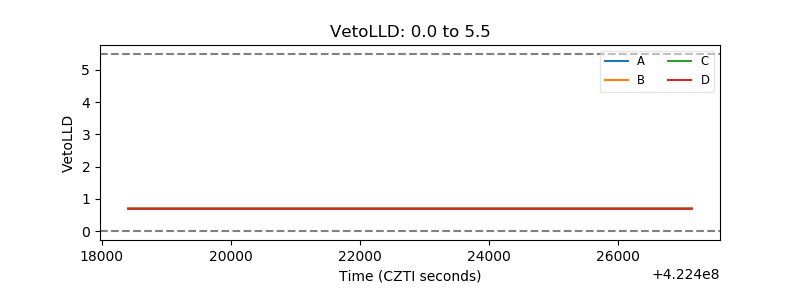 |
| Alpha Counter | 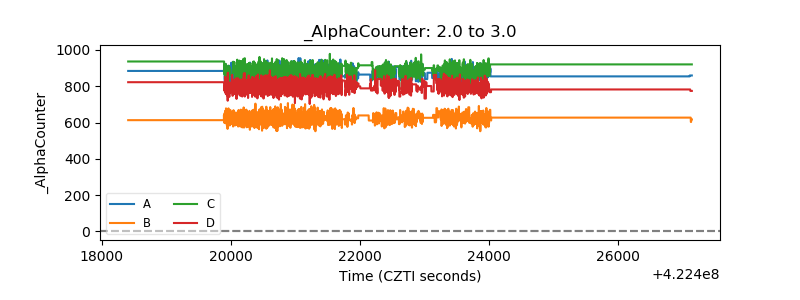 |
| _CPM_Rate | 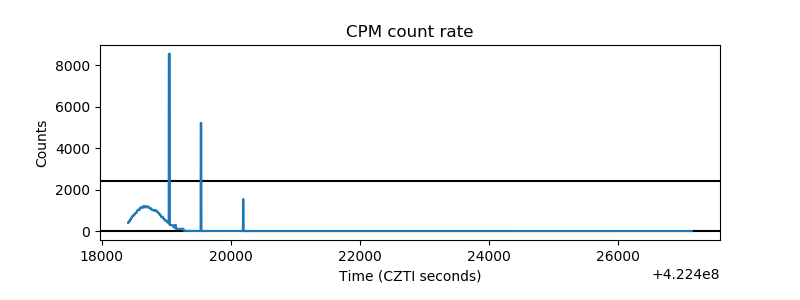 |
| CZT Counter | 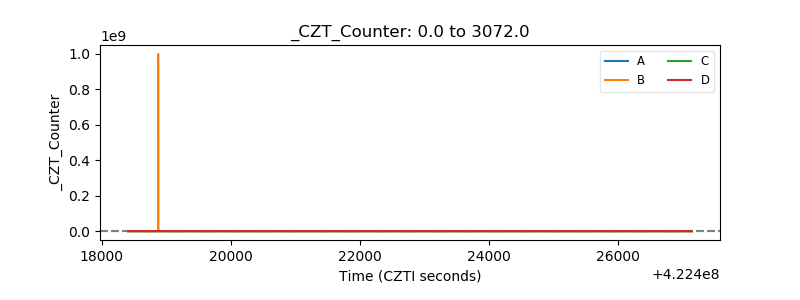 |
| +2.5 Volts monitor | 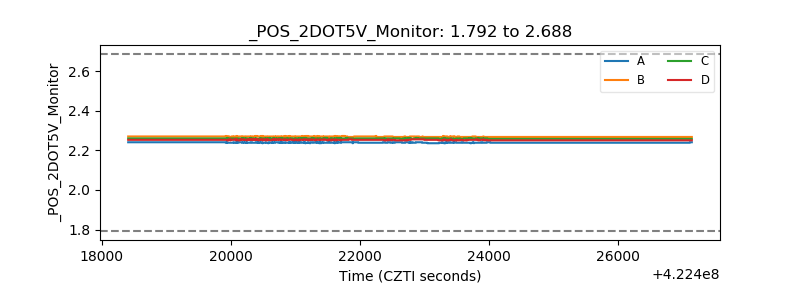 |
| +5 Volts monitor | 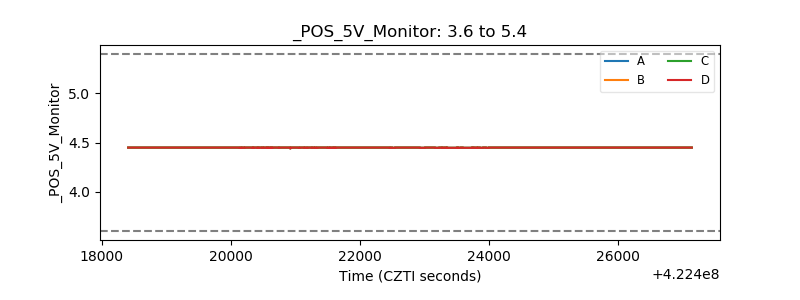 |
| _ROLL_ROT | 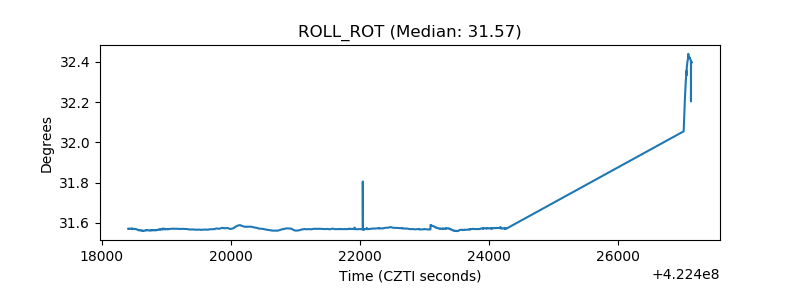 |
| _Roll_DEC | 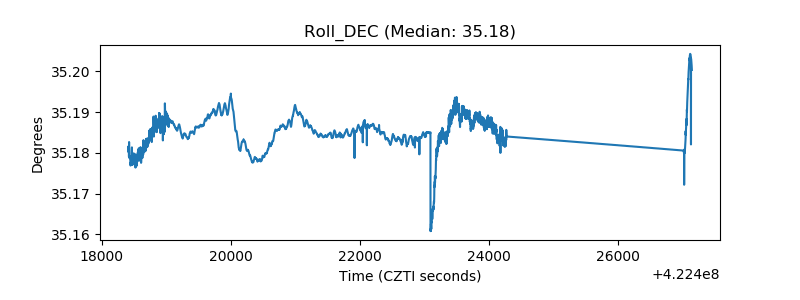 |
| _Roll_RA | 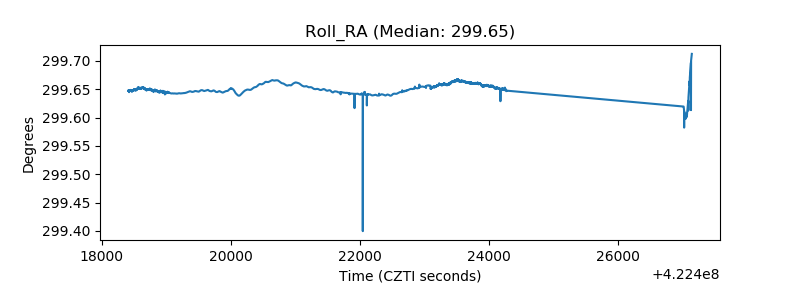 |
| Veto Counter | 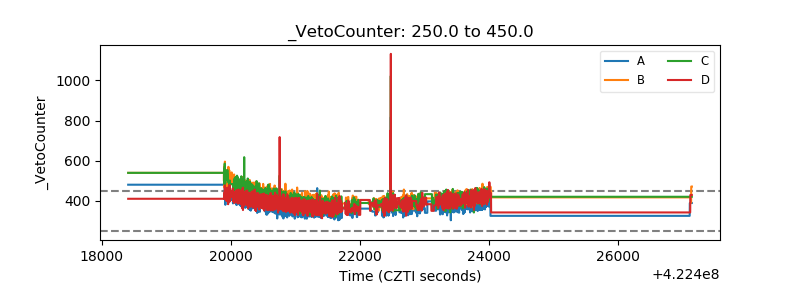 |