| Param | Original file | Final file |
|---|---|---|
| Filename | modeM0/AS1T05_105T01_9000005658_41346cztM0_level2.fits | modeM0/AS1T05_105T01_9000005658_41346cztM0_level2_quad_clean.evt |
| Size (bytes) | 331,905,600 | 78,503,040 |
| Size | 316.5 MB | 74.9 MB |
| Events in quadrant A | 2,579,018 | 545,403 |
| Events in quadrant B | 2,505,778 | 542,358 |
| Events in quadrant C | 3,352,266 | 496,205 |
| Events in quadrant D | 3,479,473 | 460,791 |
| Mode M9 | |||
|---|---|---|---|
| Quadrant | BADHDUFLAG | Total packets | Discarded packets |
| A | 0 | 25 | 0 |
| B | 0 | 25 | 0 |
| C | 0 | 25 | 0 |
| D | 0 | 26 | 0 |
| Mode SS | |||
|---|---|---|---|
| Quadrant | BADHDUFLAG | Total packets | Discarded packets |
| A | 0 | 102 | 5 |
| B | 0 | 102 | 4 |
| C | 0 | 103 | 8 |
| D | 0 | 101 | 5 |
| Mode M0 | |||
|---|---|---|---|
| Quadrant | BADHDUFLAG | Total packets | Discarded packets |
| A | 0 | 11036 | 558 |
| B | 0 | 11496 | 835 |
| C | 0 | 13935 | 919 |
| D | 0 | 14444 | 680 |
| Quadrant | Total seconds | Saturated seconds | Saturation percentage |
|---|---|---|---|
| A | 4757 | 11 | 0.231238% |
| B | 4735 | 137 | 2.893347% |
| C | 4714 | 238 | 5.048791% |
| D | 4737 | 280 | 5.910914% |
Noise dominated data is calculated using 1-second bins in cleaned event files. If a bin has >2000 counts, and if more than 50% of those come from <1% of pixels, then it is considered to be noise-dominated and hence unusable.
| Quadrant | # 1 sec bins | Bins with >0 counts | Bins with >2000 counts | High rate bins dominated by noise | Noise dominated (total time) | Noise dominated (detector-on time) | Marked lightcurve |
|---|---|---|---|---|---|---|---|
| A | 7147 | 4917 | 4 | 4 | 0.06% | 0.08% | 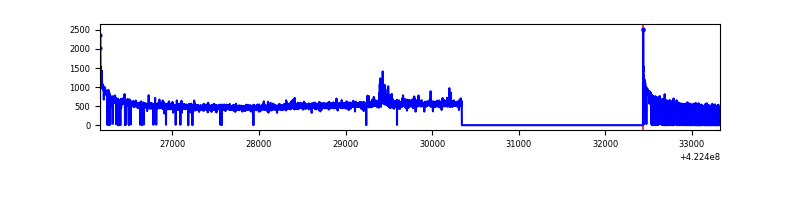 |
| B | 7150 | 4890 | 130 | 130 | 1.82% | 2.66% | 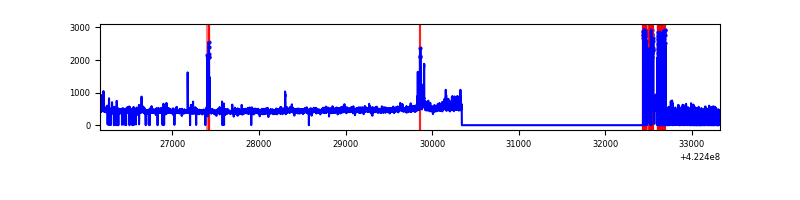 |
| C | 7143 | 4878 | 229 | 229 | 3.21% | 4.69% | 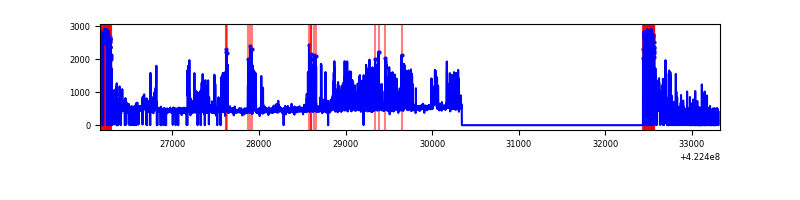 |
| D | 7158 | 4916 | 280 | 280 | 3.91% | 5.70% | 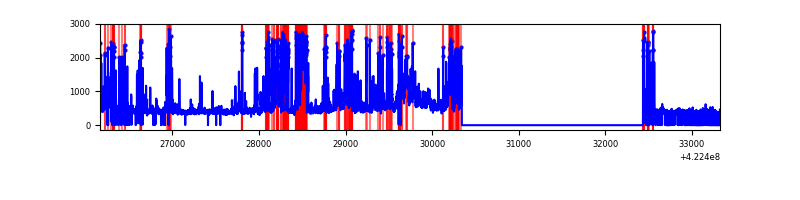 |
Top three noisy pixels from each quadrant. If the there are fewer than three noisy pixels in the level2.evt file, extra rows are filled as -1
| Pixel properties | Quadrant properties | ||||||
|---|---|---|---|---|---|---|---|
| Quadrant | DetID | PixID | Counts | Sigma | Mean | Median | Sigma |
| A | 10 | 83 | 470958 | 4268.93 | 531 | 521 | 110.2 |
| A | 13 | 248 | 28854 | 257.1 | 531 | 521 | 110.2 |
| A | 12 | 189 | 20098 | 177.65 | 531 | 521 | 110.2 |
| B | 15 | 35 | 319690 | 3165.24 | 516 | 502 | 100.8 |
| B | 0 | 190 | 63419 | 623.92 | 516 | 502 | 100.8 |
| B | 5 | 255 | 59256 | 582.64 | 516 | 502 | 100.8 |
| C | 7 | 220 | 617502 | 5372.41 | 489 | 492 | 114.8 |
| C | 0 | 10 | 608050 | 5290.11 | 489 | 492 | 114.8 |
| C | 15 | 214 | 197212 | 1712.87 | 489 | 492 | 114.8 |
| D | 13 | 249 | 900645 | 7223.91 | 499 | 484 | 124.6 |
| D | 1 | 47 | 312029 | 2500.19 | 499 | 484 | 124.6 |
| D | 5 | 222 | 163536 | 1308.51 | 499 | 484 | 124.6 |
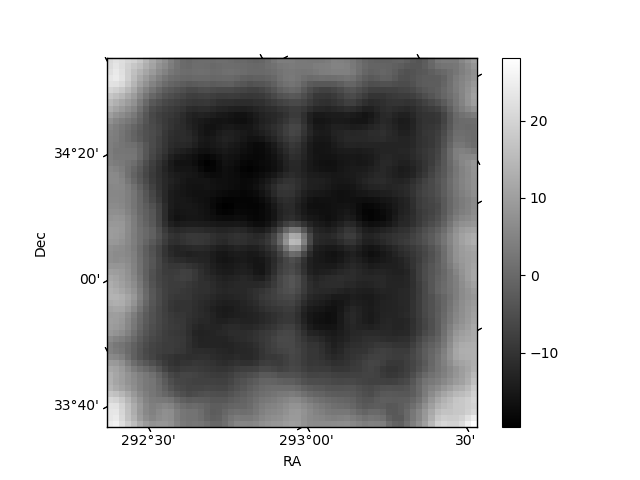
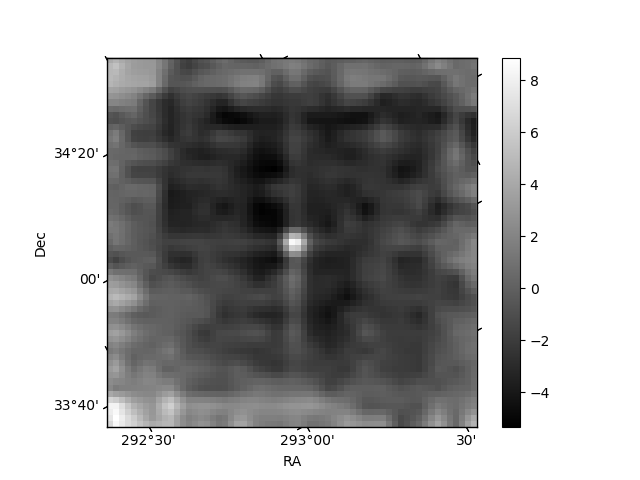
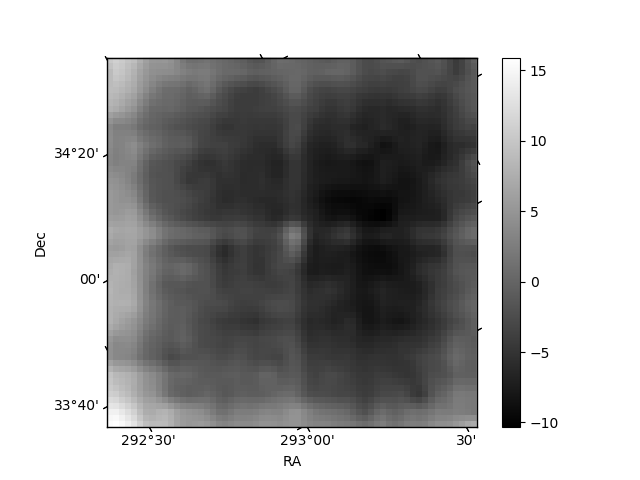
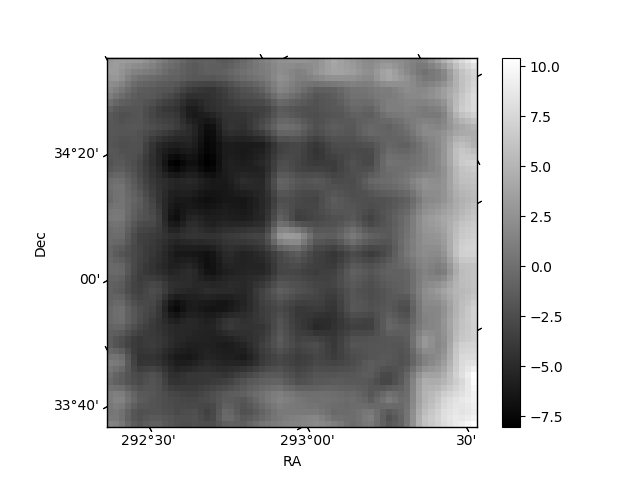
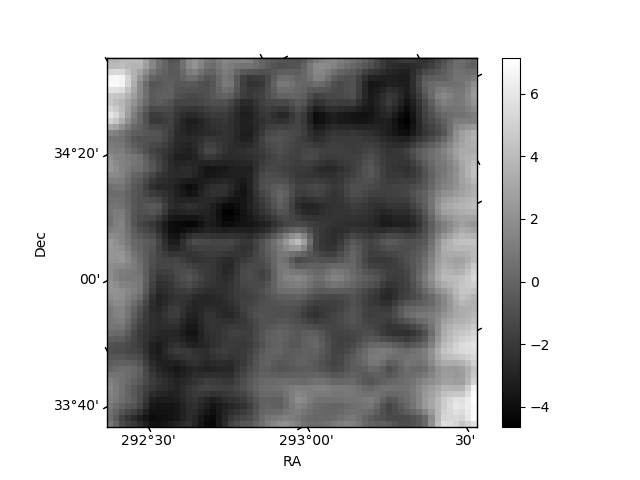
Histogram calculated using DETX and DETY for each event in the final _common_clean file
| Quadrant A | 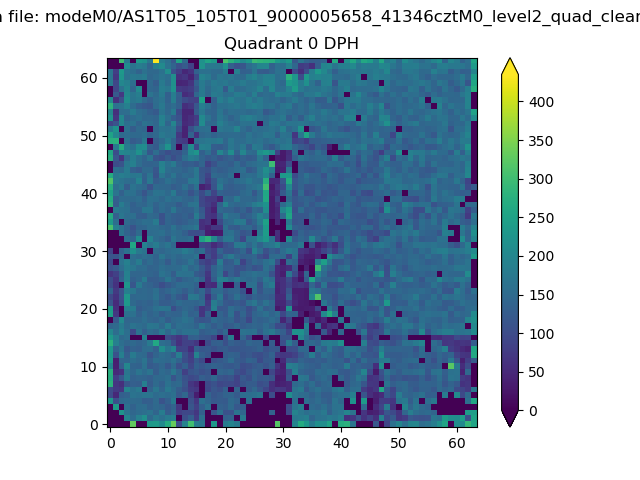 |
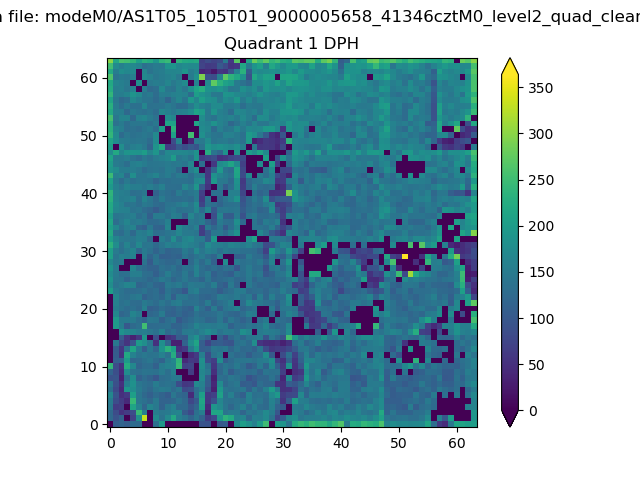 |
Quadrant B |
|---|---|---|---|
| Quadrant D | 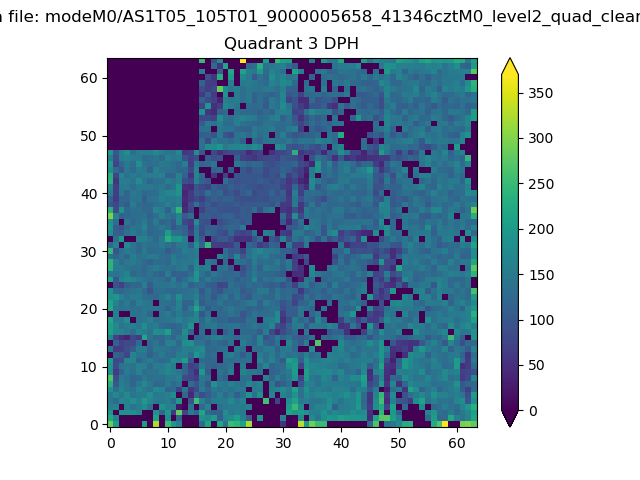 |
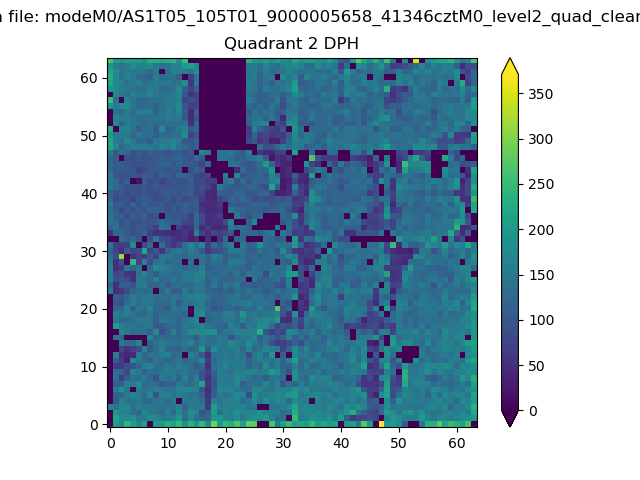 |
Quadrant C |
| Plot type | Count rate plots | Images |
|---|---|---|
| Comparison with Poisson distribution Blue bars denote a histogram of data divided into 1 sec bins. Red curve is a Poisson curve with rate = median count rate of data. |
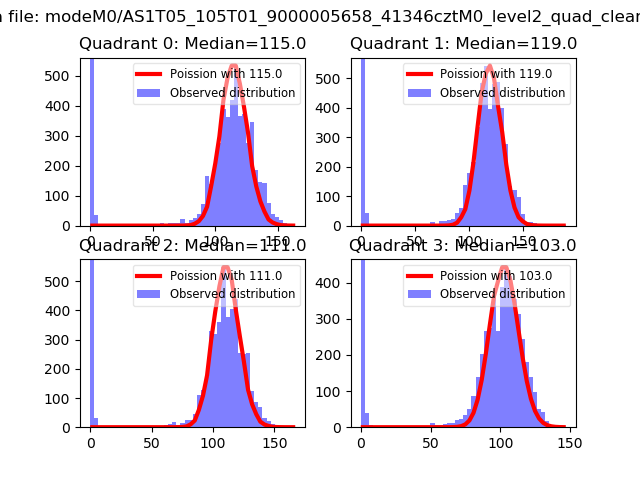 |
 |
| Quadrant-wise count rates Data is divided into 100 sec bins |
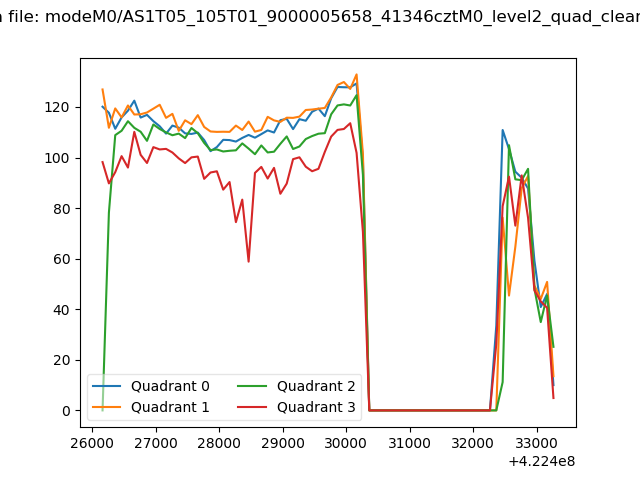 |
|
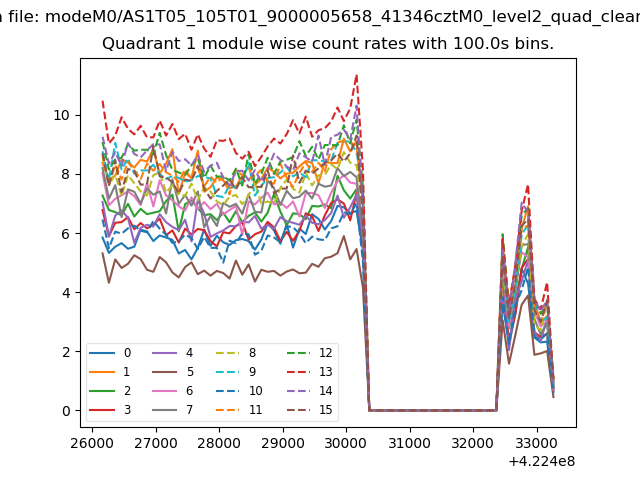
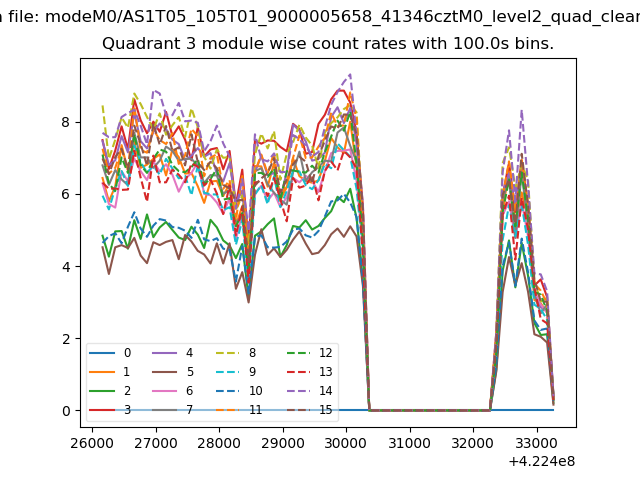
| Module-wise count rates for Quadrant A Data is divided into 100 sec bins |
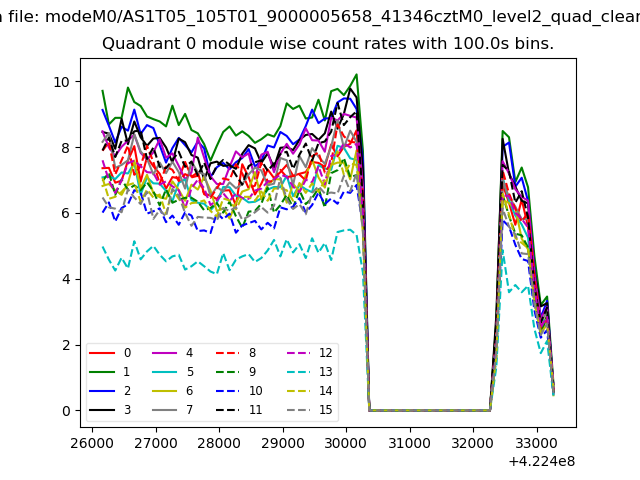 |
 |
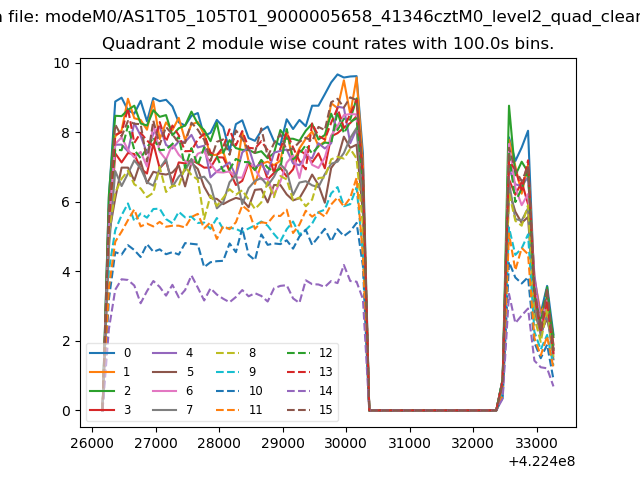
| Module-wise count rates for Quadrant B Data is divided into 100 sec bins |
 |
 |
| Module-wise count rates for Quadrant C Data is divided into 100 sec bins |
 |
 |
| Module-wise count rates for Quadrant D Data is divided into 100 sec bins |
 |
 |
| Parameter | Plot |
|---|---|
| CZT HV Monitor |  |
| D_VDD | 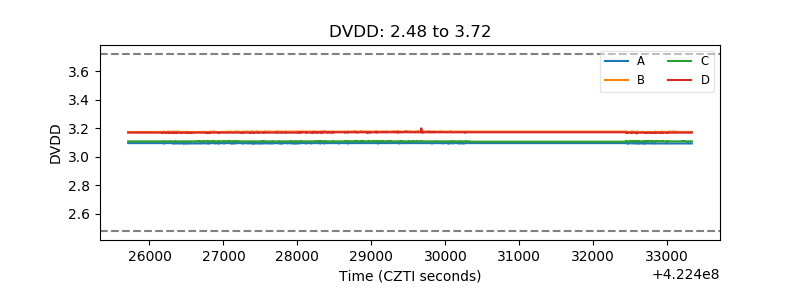 |
| Temperature 1 | 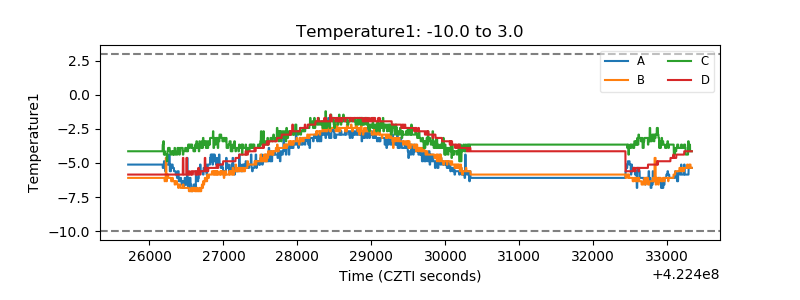 |
| Veto HV Monitor | 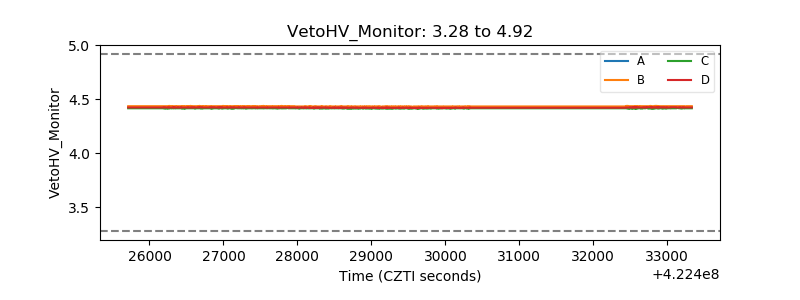 |
| Veto LLD | 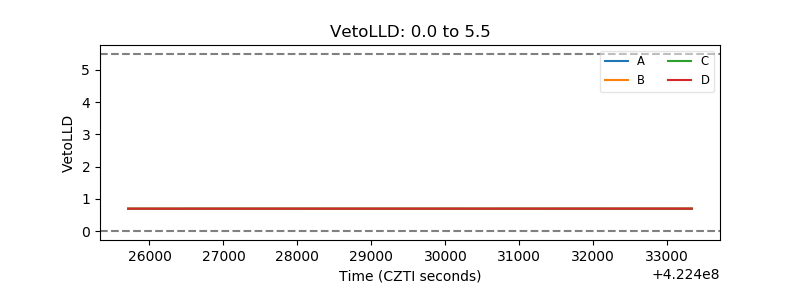 |
| Alpha Counter | 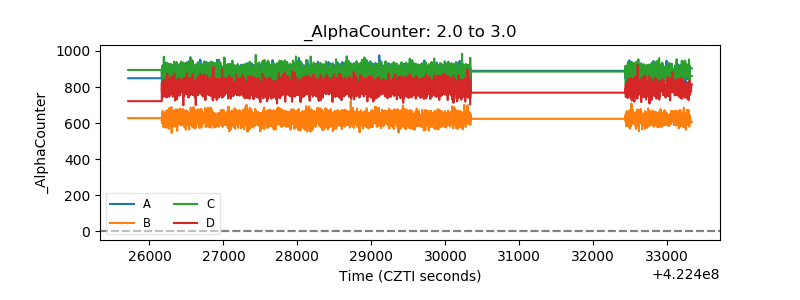 |
| _CPM_Rate | 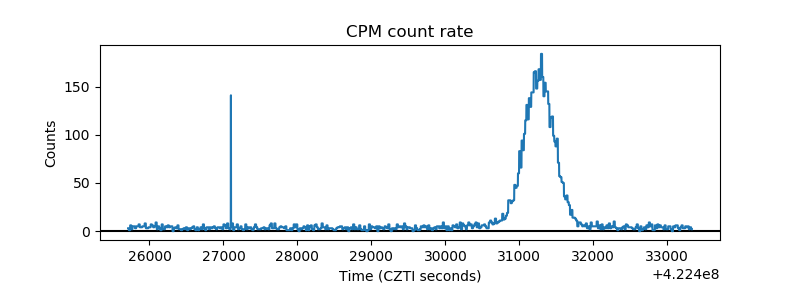 |
| CZT Counter | 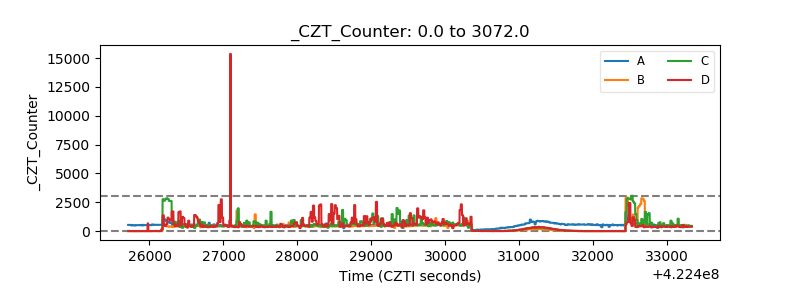 |
| +2.5 Volts monitor | 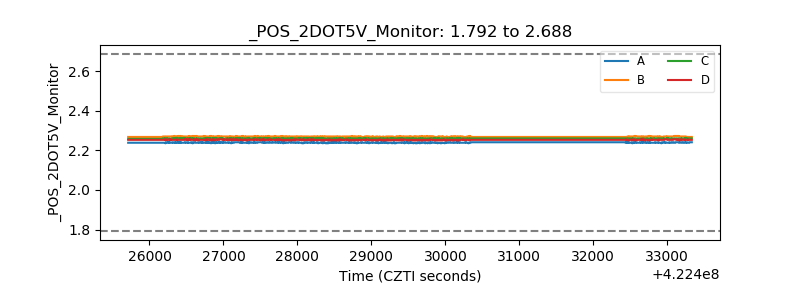 |
| +5 Volts monitor | 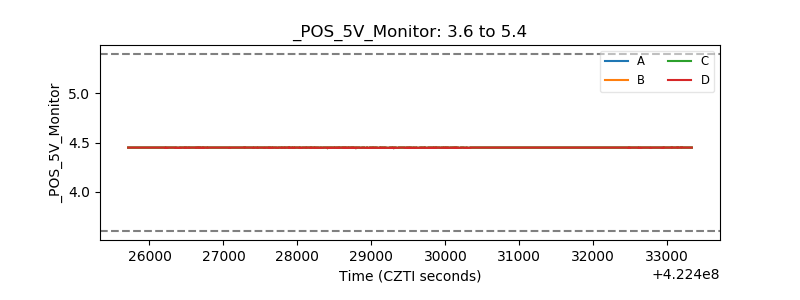 |
| _ROLL_ROT | 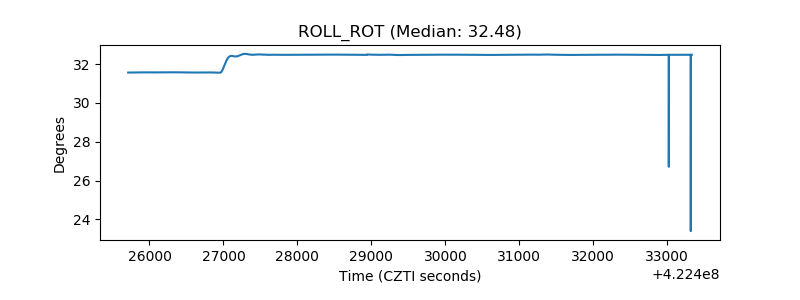 |
| _Roll_DEC |  |
| _Roll_RA | 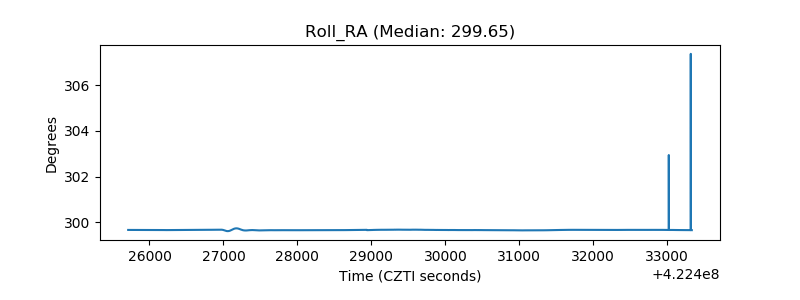 |
| Veto Counter | 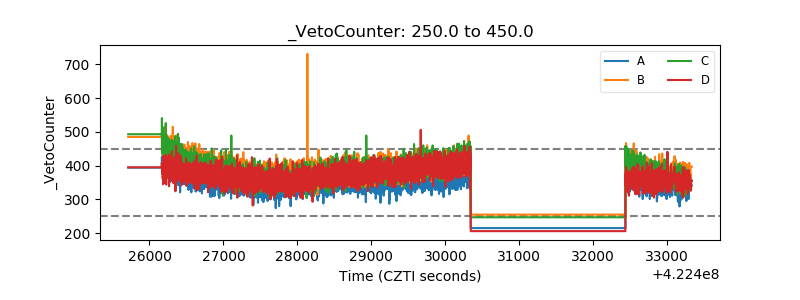 |