| Param | Original file | Final file |
|---|---|---|
| Filename | modeM0/AS1T05_105T01_9000005658_41347cztM0_level2.fits | modeM0/AS1T05_105T01_9000005658_41347cztM0_level2_quad_clean.evt |
| Size (bytes) | 348,923,520 | 82,650,240 |
| Size | 332.8 MB | 78.8 MB |
| Events in quadrant A | 2,647,207 | 576,038 |
| Events in quadrant B | 2,694,093 | 577,905 |
| Events in quadrant C | 2,952,949 | 536,908 |
| Events in quadrant D | 4,224,241 | 454,418 |
| Mode M9 | |||
|---|---|---|---|
| Quadrant | BADHDUFLAG | Total packets | Discarded packets |
| A | 0 | 19 | 0 |
| B | 0 | 19 | 0 |
| C | 0 | 19 | 0 |
| D | 0 | 19 | 0 |
| Mode SS | |||
|---|---|---|---|
| Quadrant | BADHDUFLAG | Total packets | Discarded packets |
| A | 0 | 105 | 0 |
| B | 0 | 106 | 0 |
| C | 0 | 105 | 1 |
| D | 0 | 106 | 0 |
| Mode M0 | |||
|---|---|---|---|
| Quadrant | BADHDUFLAG | Total packets | Discarded packets |
| A | 0 | 10851 | 76 |
| B | 0 | 11662 | 181 |
| C | 0 | 12101 | 166 |
| D | 0 | 16390 | 186 |
| Quadrant | Total seconds | Saturated seconds | Saturation percentage |
|---|---|---|---|
| A | 5104 | 5 | 0.097962% |
| B | 5099 | 128 | 2.510296% |
| C | 5097 | 187 | 3.668825% |
| D | 5087 | 658 | 12.934932% |
Noise dominated data is calculated using 1-second bins in cleaned event files. If a bin has >2000 counts, and if more than 50% of those come from <1% of pixels, then it is considered to be noise-dominated and hence unusable.
| Quadrant | # 1 sec bins | Bins with >0 counts | Bins with >2000 counts | High rate bins dominated by noise | Noise dominated (total time) | Noise dominated (detector-on time) | Marked lightcurve |
|---|---|---|---|---|---|---|---|
| A | 7062 | 5138 | 2 | 2 | 0.03% | 0.04% | 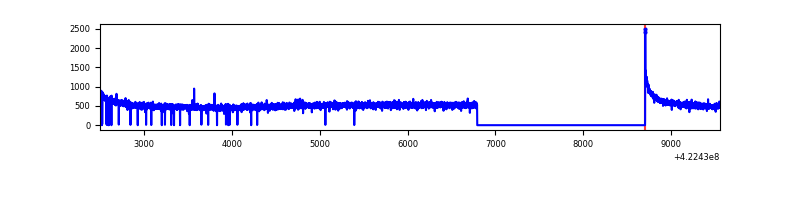 |
| B | 7062 | 5121 | 115 | 115 | 1.63% | 2.25% | 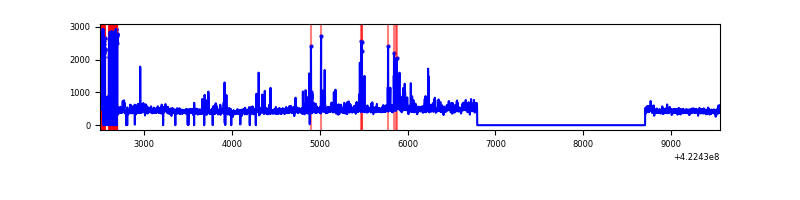 |
| C | 7062 | 5126 | 185 | 185 | 2.62% | 3.61% | 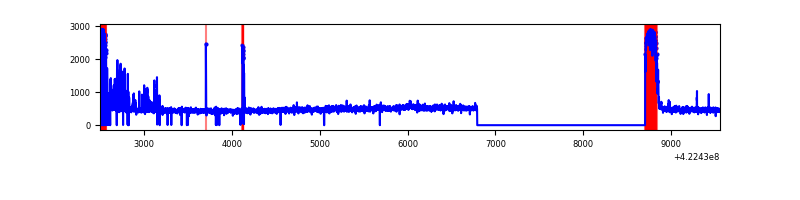 |
| D | 7062 | 5123 | 601 | 601 | 8.51% | 11.73% | 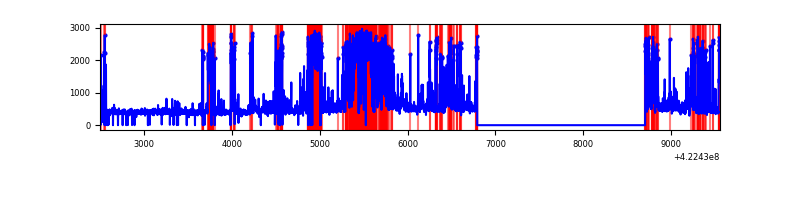 |
Top three noisy pixels from each quadrant. If the there are fewer than three noisy pixels in the level2.evt file, extra rows are filled as -1
| Pixel properties | Quadrant properties | ||||||
|---|---|---|---|---|---|---|---|
| Quadrant | DetID | PixID | Counts | Sigma | Mean | Median | Sigma |
| A | 10 | 83 | 454161 | 3901.07 | 565 | 554 | 116.3 |
| A | 13 | 6 | 8167 | 65.47 | 565 | 554 | 116.3 |
| A | 3 | 137 | 6410 | 50.36 | 565 | 554 | 116.3 |
| B | 15 | 35 | 283486 | 2598.94 | 552 | 537 | 108.9 |
| B | 5 | 255 | 126751 | 1159.3 | 552 | 537 | 108.9 |
| B | 0 | 190 | 105994 | 968.64 | 552 | 537 | 108.9 |
| C | 0 | 10 | 537794 | 4279.87 | 533 | 536 | 125.5 |
| C | 15 | 214 | 217237 | 1726.27 | 533 | 536 | 125.5 |
| C | 7 | 220 | 79065 | 625.57 | 533 | 536 | 125.5 |
| D | 13 | 249 | 1053933 | 8238.6 | 510 | 494 | 127.9 |
| D | 1 | 47 | 638801 | 4991.99 | 510 | 494 | 127.9 |
| D | 5 | 222 | 318337 | 2485.75 | 510 | 494 | 127.9 |
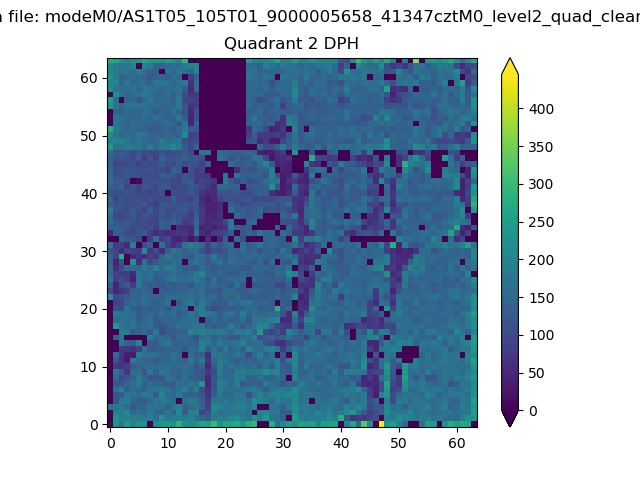
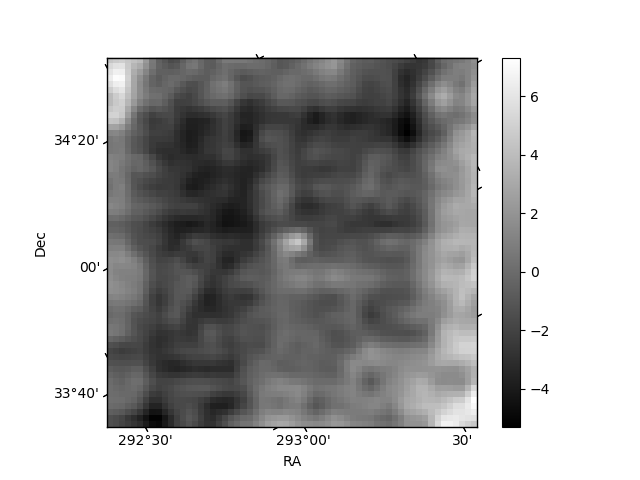
Histogram calculated using DETX and DETY for each event in the final _common_clean file
| Quadrant A | 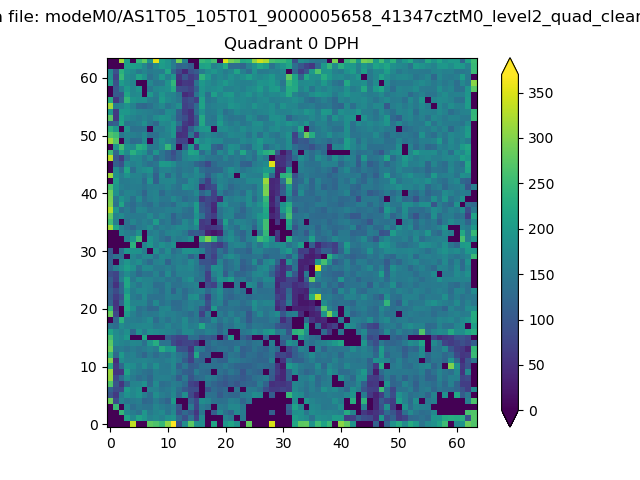 |
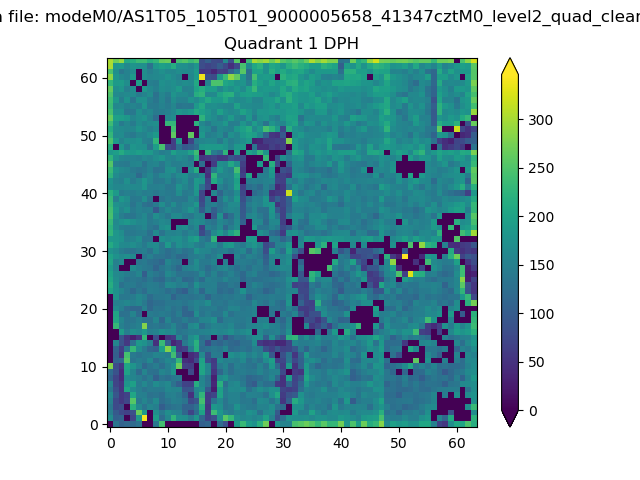 |
Quadrant B |
|---|---|---|---|
| Quadrant D | 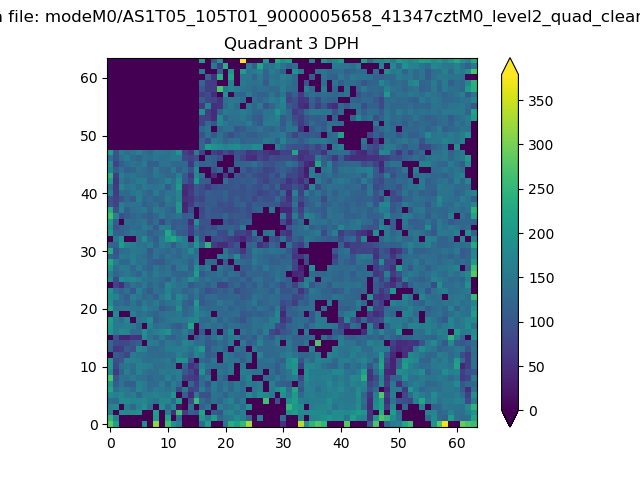 |
 |
Quadrant C |
| Plot type | Count rate plots | Images |
|---|---|---|
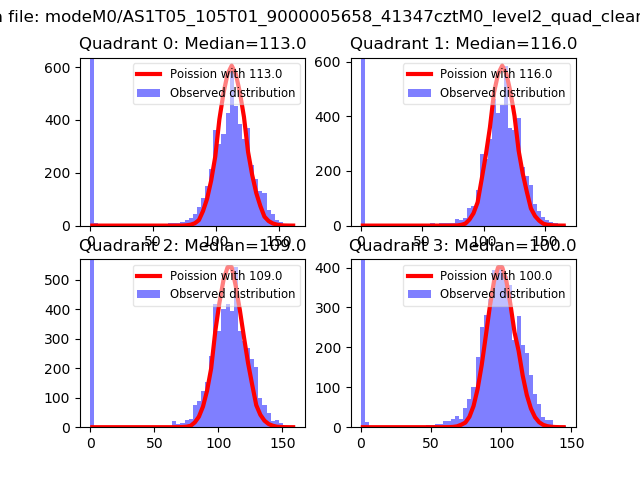
| Comparison with Poisson distribution Blue bars denote a histogram of data divided into 1 sec bins. Red curve is a Poisson curve with rate = median count rate of data. |
 |
 |
| Quadrant-wise count rates Data is divided into 100 sec bins |
 |
|
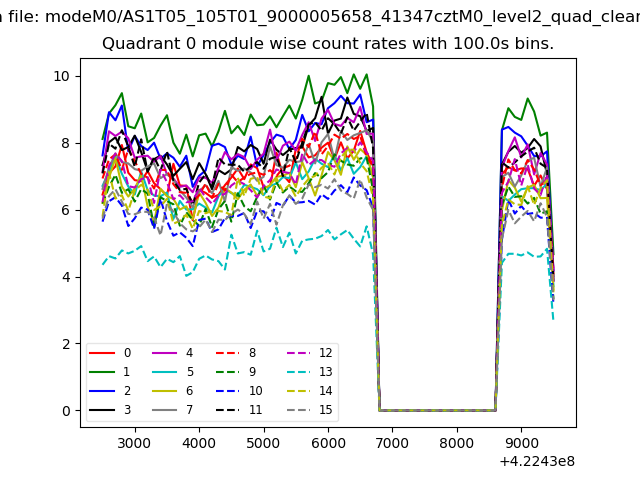
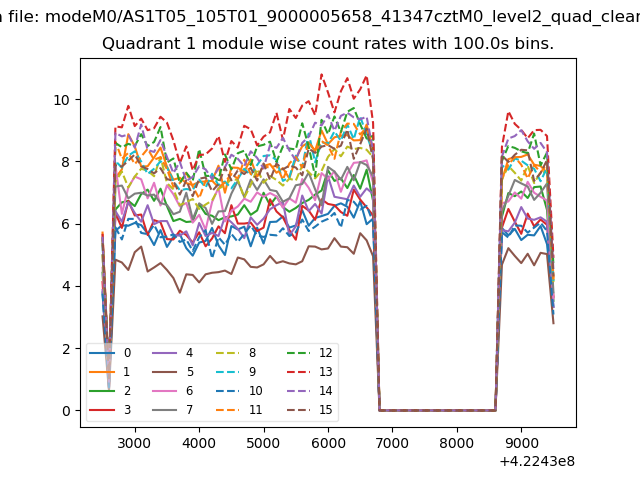
| Module-wise count rates for Quadrant A Data is divided into 100 sec bins |
 |
 |
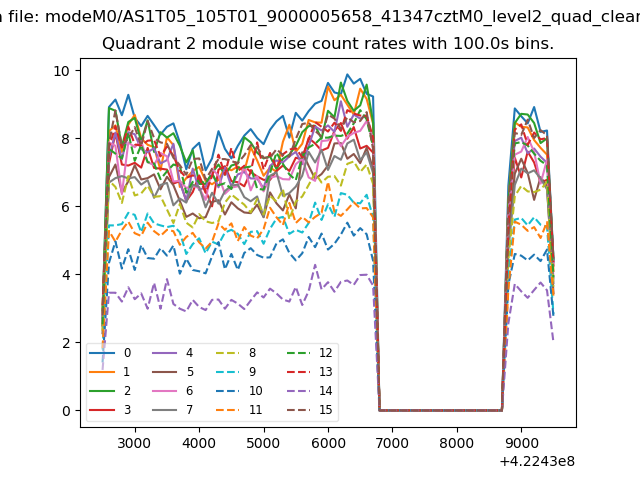
| Module-wise count rates for Quadrant B Data is divided into 100 sec bins |
 |
 |
| Module-wise count rates for Quadrant C Data is divided into 100 sec bins |
 |
 |
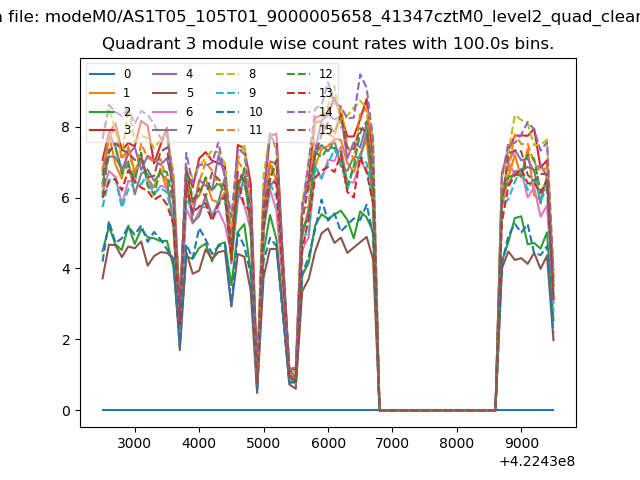
| Module-wise count rates for Quadrant D Data is divided into 100 sec bins |
 |
 |
| Parameter | Plot |
|---|---|
| CZT HV Monitor | 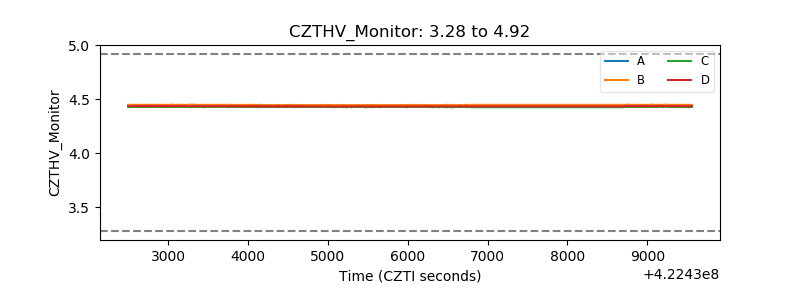 |
| D_VDD | 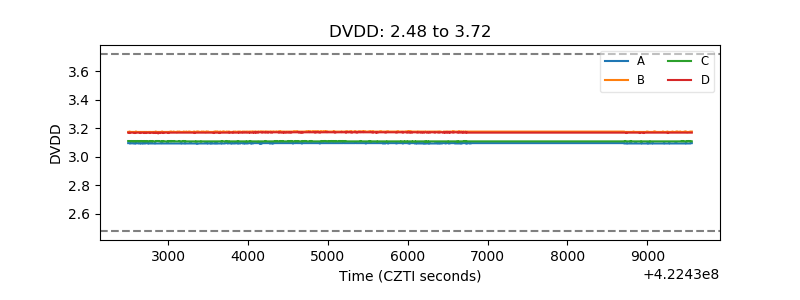 |
| Temperature 1 | 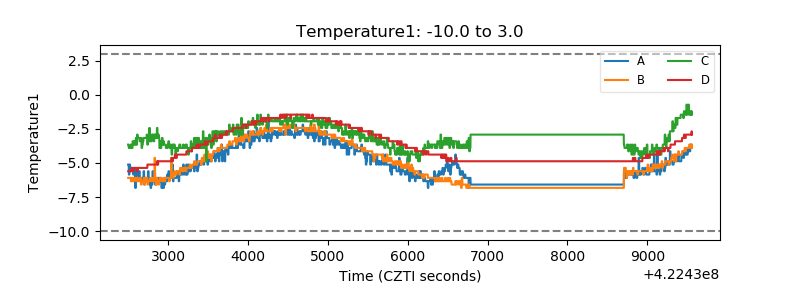 |
| Veto HV Monitor | 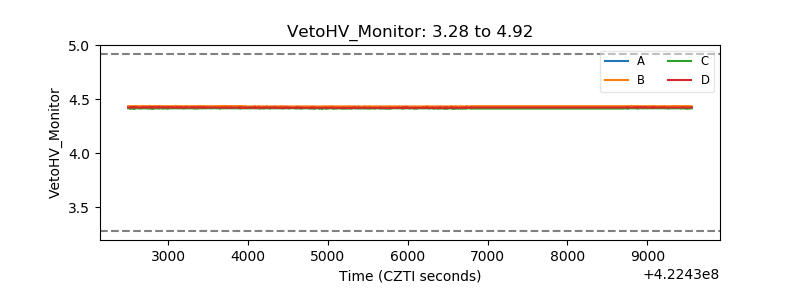 |
| Veto LLD | 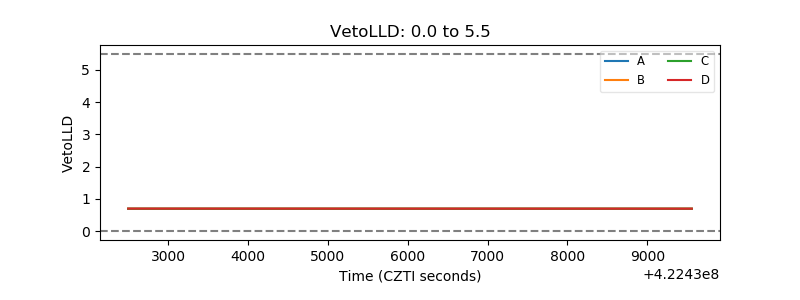 |
| Alpha Counter | 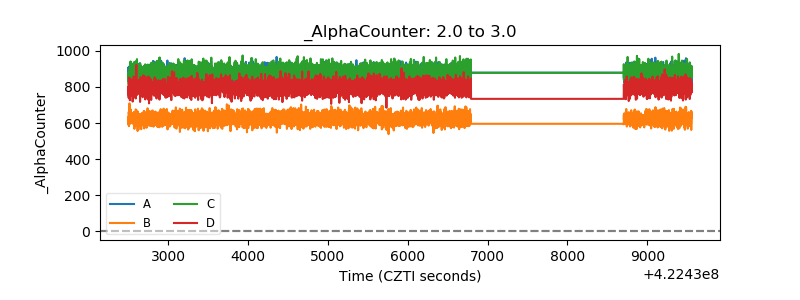 |
| _CPM_Rate | 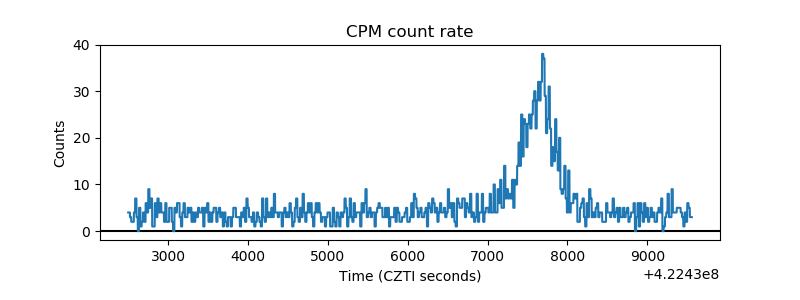 |
| CZT Counter | 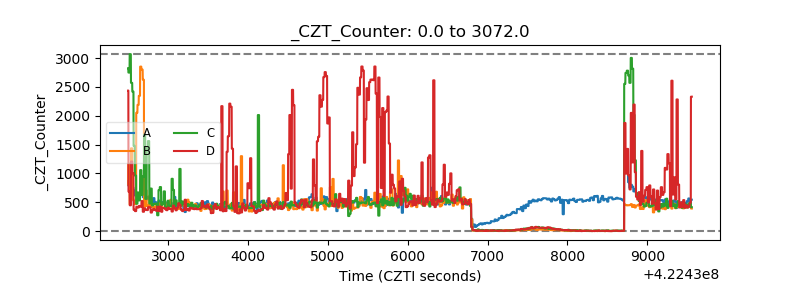 |
| +2.5 Volts monitor | 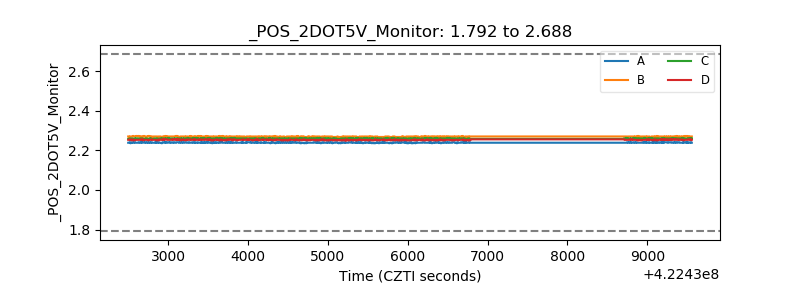 |
| +5 Volts monitor | 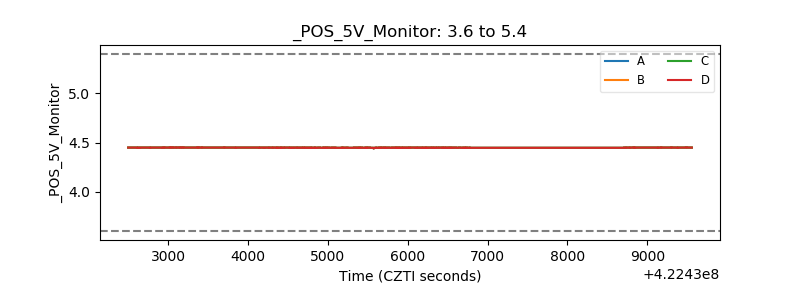 |
| _ROLL_ROT | 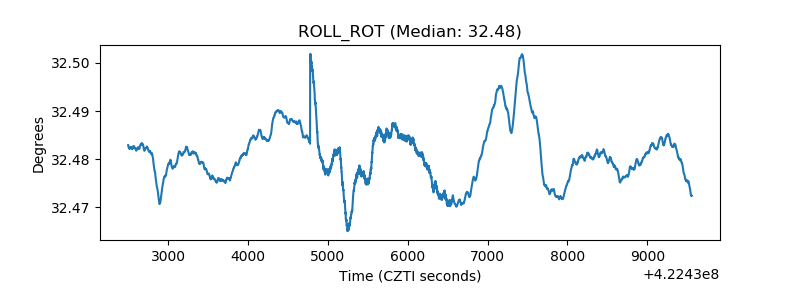 |
| _Roll_DEC | 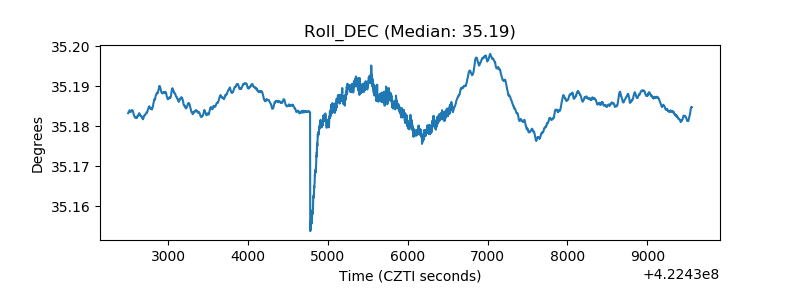 |
| _Roll_RA | 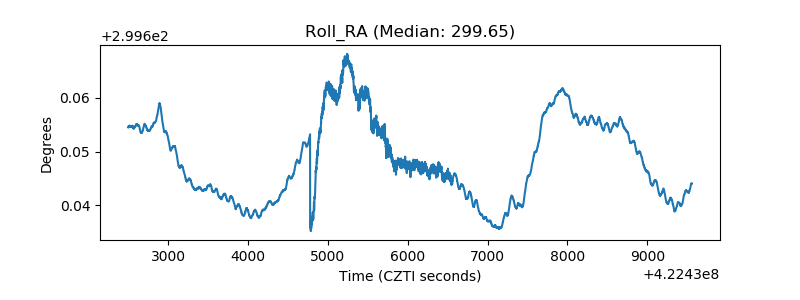 |
| Veto Counter | 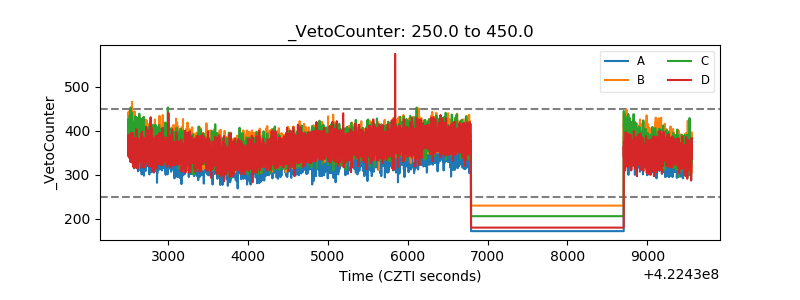 |