| Param | Original file | Final file |
|---|---|---|
| Filename | modeM0/AS1T05_105T01_9000005658_41348cztM0_level2.fits | modeM0/AS1T05_105T01_9000005658_41348cztM0_level2_quad_clean.evt |
| Size (bytes) | 1,543,328,640 | 376,490,880 |
| Size | 1.4 GB | 359.0 MB |
| Events in quadrant A | 12,238,154 | 2,600,418 |
| Events in quadrant B | 11,456,651 | 2,651,950 |
| Events in quadrant C | 13,124,206 | 2,444,973 |
| Events in quadrant D | 18,567,277 | 2,151,448 |
| Mode M9 | |||
|---|---|---|---|
| Quadrant | BADHDUFLAG | Total packets | Discarded packets |
| A | 0 | 96 | 0 |
| B | 0 | 96 | 0 |
| C | 0 | 96 | 0 |
| D | 0 | 96 | 0 |
| Mode SS | |||
|---|---|---|---|
| Quadrant | BADHDUFLAG | Total packets | Discarded packets |
| A | 0 | 462 | 0 |
| B | 0 | 462 | 0 |
| C | 0 | 462 | 0 |
| D | 0 | 462 | 0 |
| Mode M0 | |||
|---|---|---|---|
| Quadrant | BADHDUFLAG | Total packets | Discarded packets |
| A | 0 | 49480 | 6 |
| B | 0 | 49240 | 5 |
| C | 0 | 52932 | 5 |
| D | 0 | 70897 | 5 |
| Quadrant | Total seconds | Saturated seconds | Saturation percentage |
|---|---|---|---|
| A | 22533 | 112 | 0.497049% |
| B | 22533 | 358 | 1.588781% |
| C | 22533 | 705 | 3.128745% |
| D | 22533 | 2082 | 9.239782% |
Noise dominated data is calculated using 1-second bins in cleaned event files. If a bin has >2000 counts, and if more than 50% of those come from <1% of pixels, then it is considered to be noise-dominated and hence unusable.
| Quadrant | # 1 sec bins | Bins with >0 counts | Bins with >2000 counts | High rate bins dominated by noise | Noise dominated (total time) | Noise dominated (detector-on time) | Marked lightcurve |
|---|---|---|---|---|---|---|---|
| A | 32276 | 22537 | 80 | 80 | 0.25% | 0.35% | 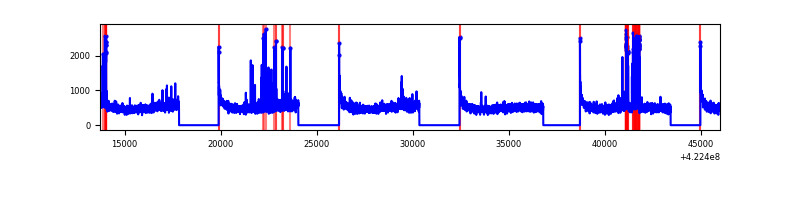 |
| B | 32276 | 22538 | 300 | 300 | 0.93% | 1.33% | 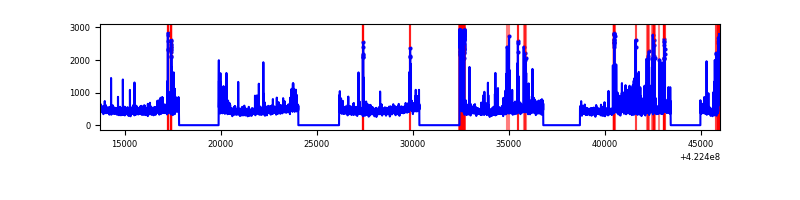 |
| C | 32276 | 22538 | 699 | 699 | 2.17% | 3.10% | 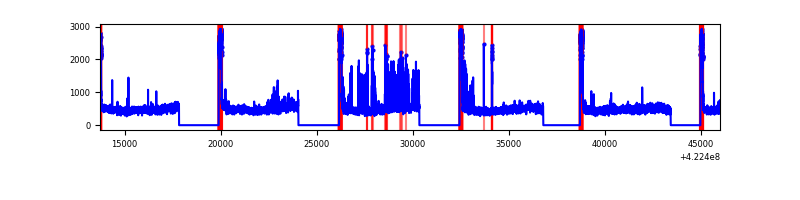 |
| D | 32276 | 22535 | 2035 | 2035 | 6.30% | 9.03% | 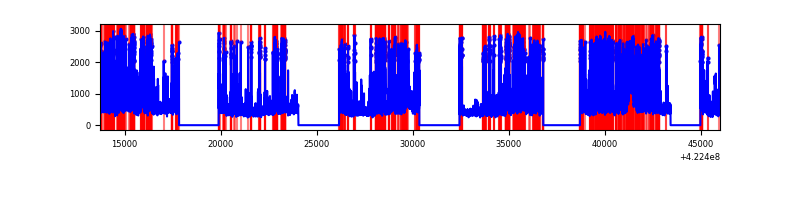 |
Top three noisy pixels from each quadrant. If the there are fewer than three noisy pixels in the level2.evt file, extra rows are filled as -1
| Pixel properties | Quadrant properties | ||||||
|---|---|---|---|---|---|---|---|
| Quadrant | DetID | PixID | Counts | Sigma | Mean | Median | Sigma |
| A | 10 | 83 | 1896364 | 3707.67 | 2522 | 2478 | 510.8 |
| A | 13 | 248 | 285703 | 554.47 | 2522 | 2478 | 510.8 |
| A | 2 | 79 | 141639 | 272.44 | 2522 | 2478 | 510.8 |
| B | 5 | 255 | 636550 | 1333.43 | 2488 | 2422 | 475.6 |
| B | 15 | 35 | 433369 | 906.19 | 2488 | 2422 | 475.6 |
| B | 0 | 190 | 375230 | 783.93 | 2488 | 2422 | 475.6 |
| C | 0 | 10 | 2044259 | 3694.32 | 2390 | 2404 | 552.7 |
| C | 15 | 214 | 941758 | 1699.57 | 2390 | 2404 | 552.7 |
| C | 7 | 220 | 724317 | 1306.15 | 2390 | 2404 | 552.7 |
| D | 13 | 249 | 3809518 | 6634.04 | 2342 | 2276 | 573.9 |
| D | 1 | 47 | 3278648 | 5709.01 | 2342 | 2276 | 573.9 |
| D | 5 | 222 | 1282834 | 2231.35 | 2342 | 2276 | 573.9 |
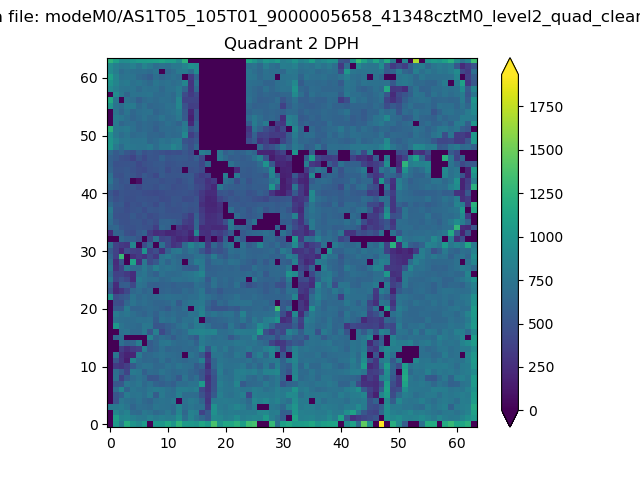
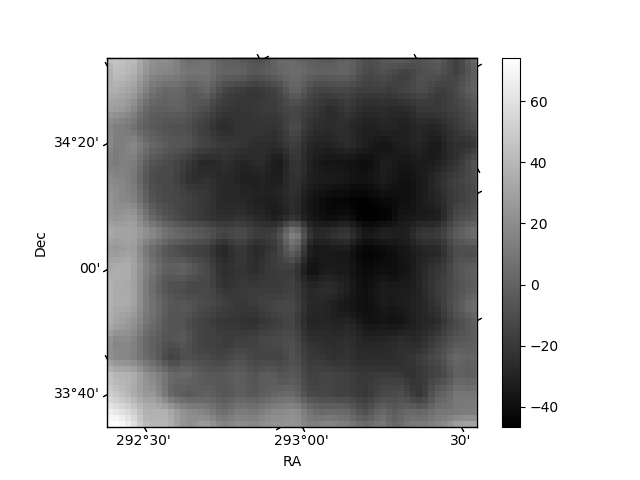
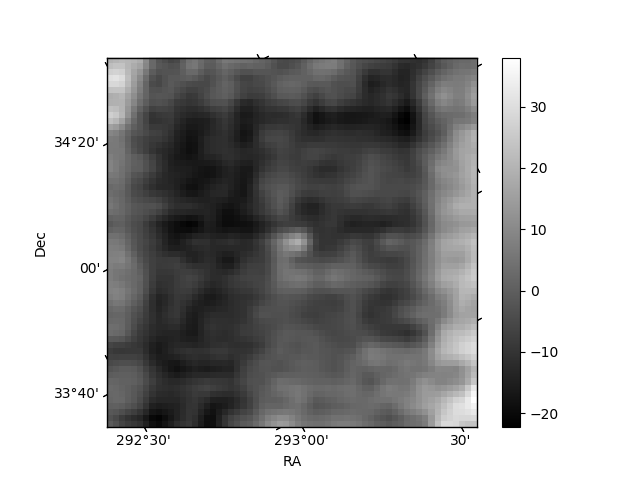
Histogram calculated using DETX and DETY for each event in the final _common_clean file
| Quadrant A | 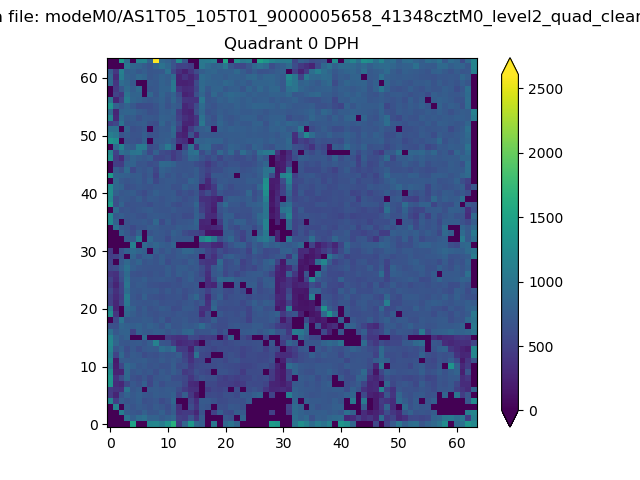 |
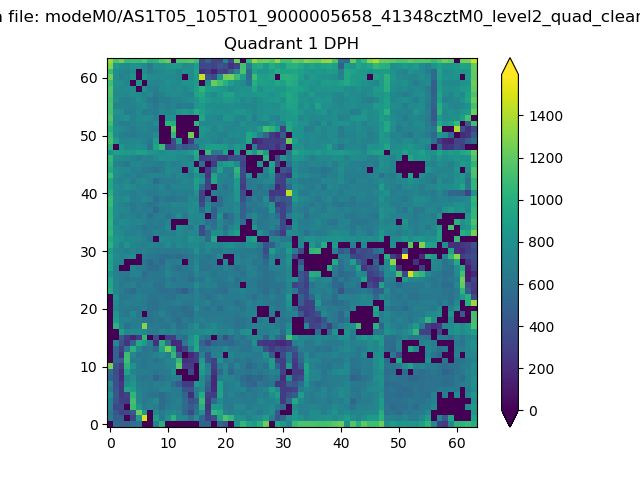 |
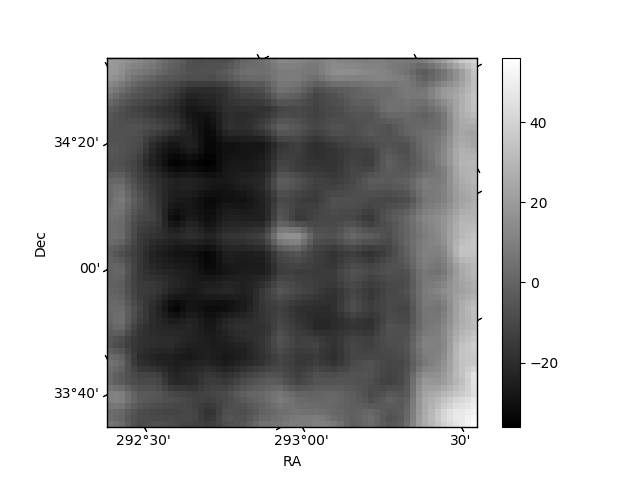
Quadrant B |
|---|---|---|---|
| Quadrant D | 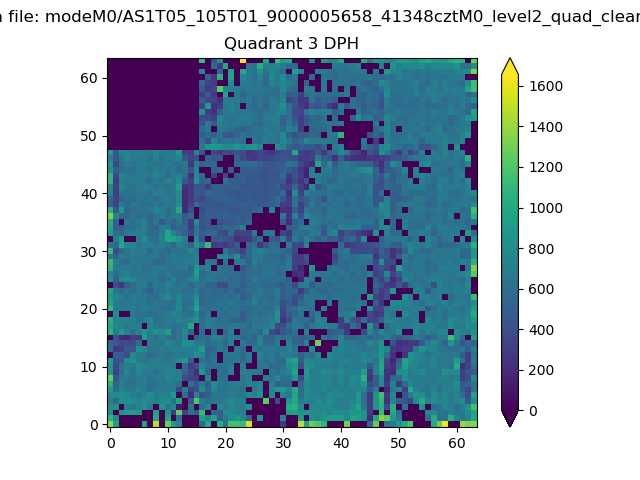 |
 |
Quadrant C |
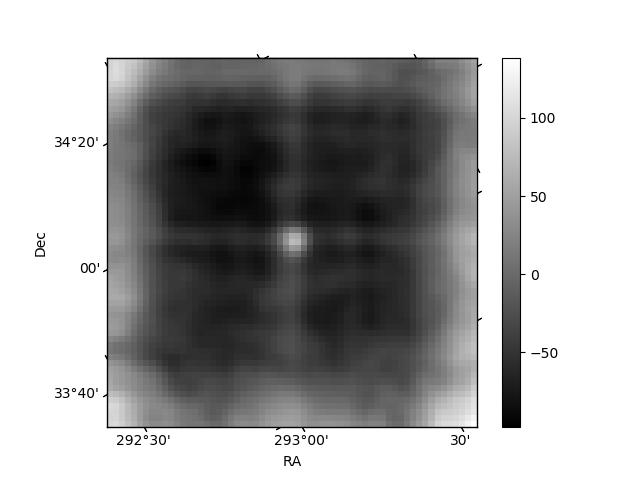
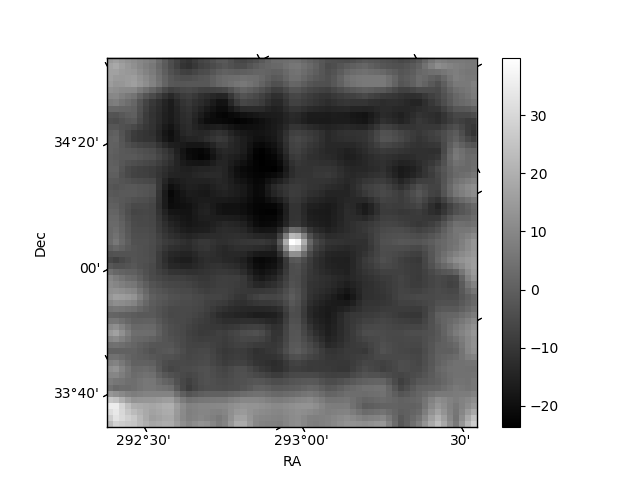
| Plot type | Count rate plots | Images |
|---|---|---|
| Comparison with Poisson distribution Blue bars denote a histogram of data divided into 1 sec bins. Red curve is a Poisson curve with rate = median count rate of data. |
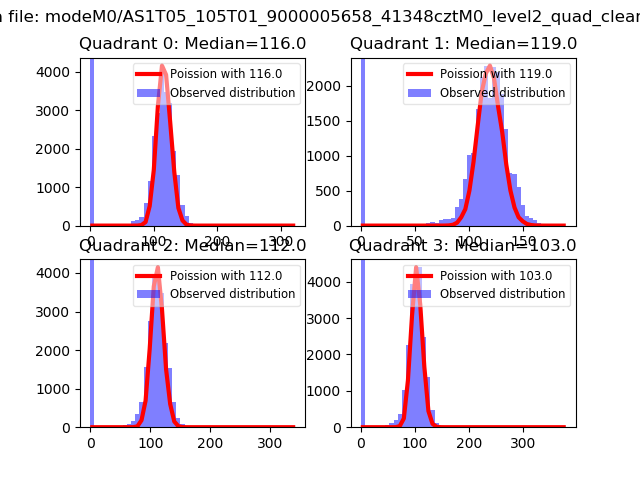 |
 |
| Quadrant-wise count rates Data is divided into 100 sec bins |
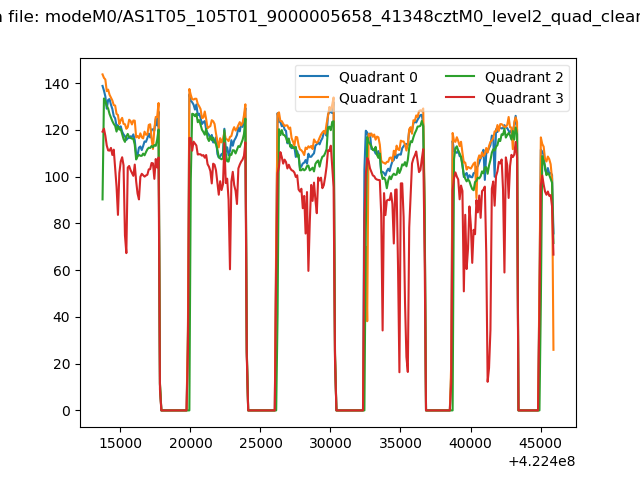 |
|
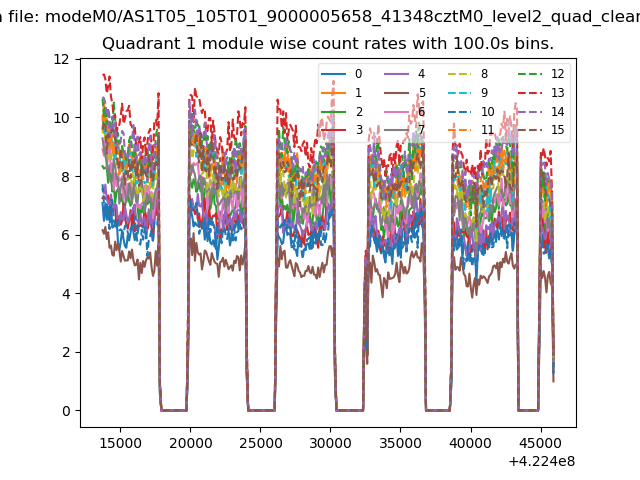
| Module-wise count rates for Quadrant A Data is divided into 100 sec bins |
 |
 |
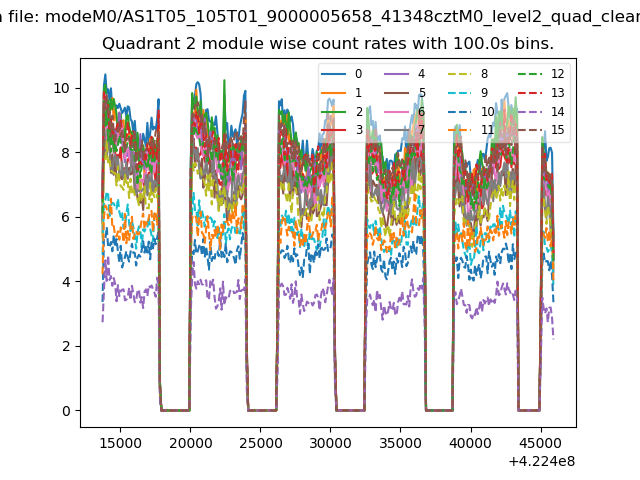
| Module-wise count rates for Quadrant B Data is divided into 100 sec bins |
 |
 |
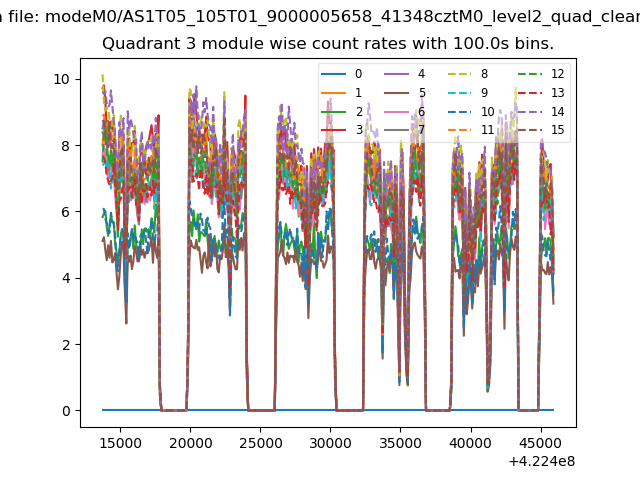
| Module-wise count rates for Quadrant C Data is divided into 100 sec bins |
 |
 |
| Module-wise count rates for Quadrant D Data is divided into 100 sec bins |
 |
 |
| Parameter | Plot |
|---|---|
| CZT HV Monitor | 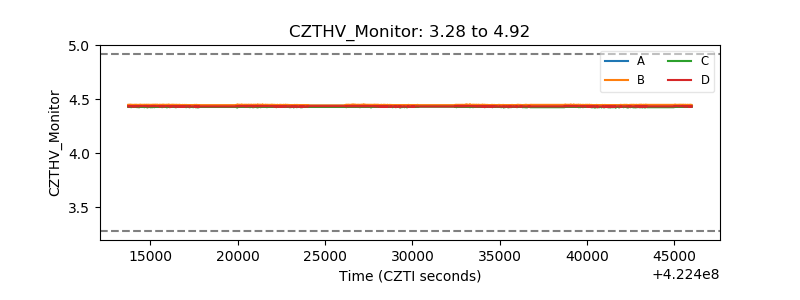 |
| D_VDD | 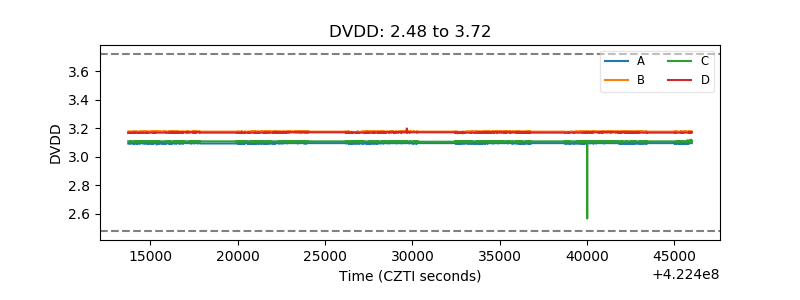 |
| Temperature 1 | 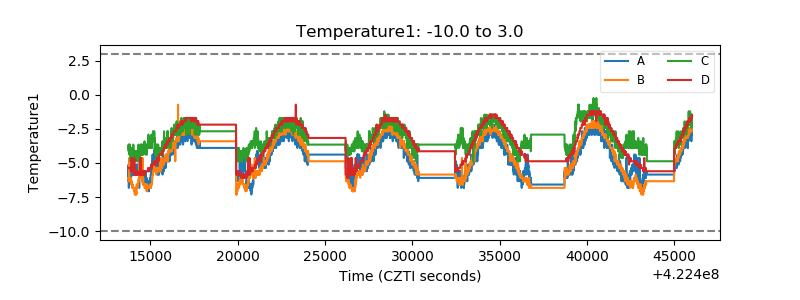 |
| Veto HV Monitor | 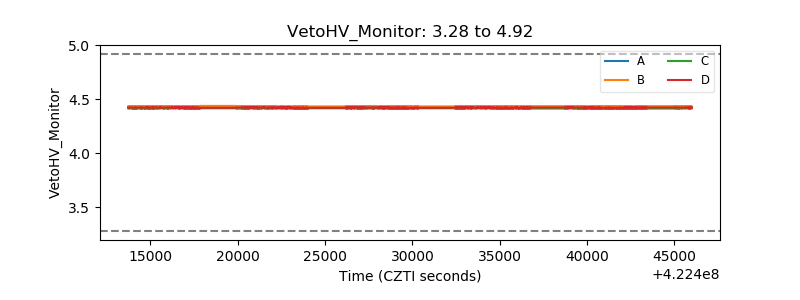 |
| Veto LLD | 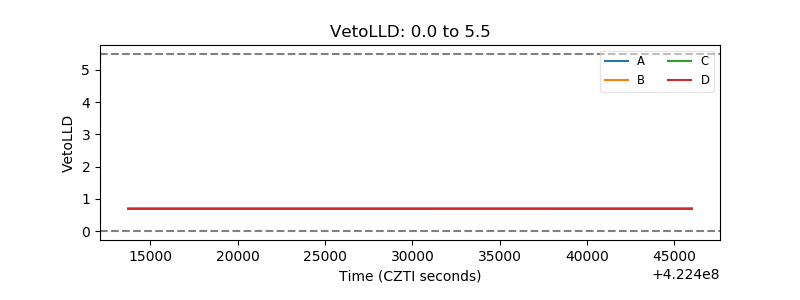 |
| Alpha Counter | 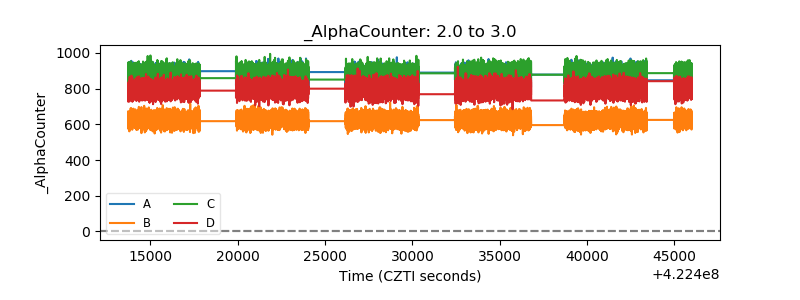 |
| _CPM_Rate | 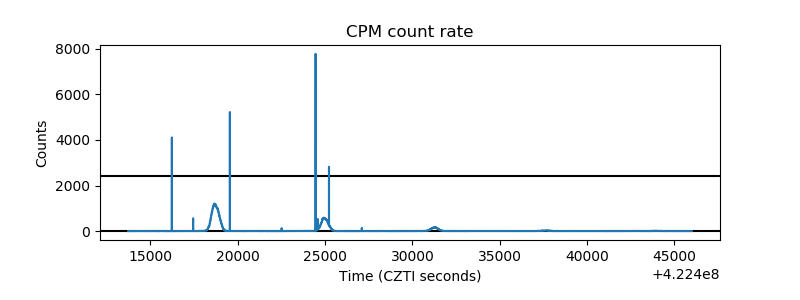 |
| CZT Counter | 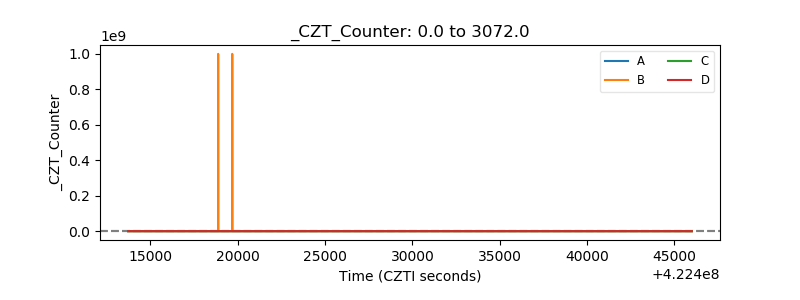 |
| +2.5 Volts monitor | 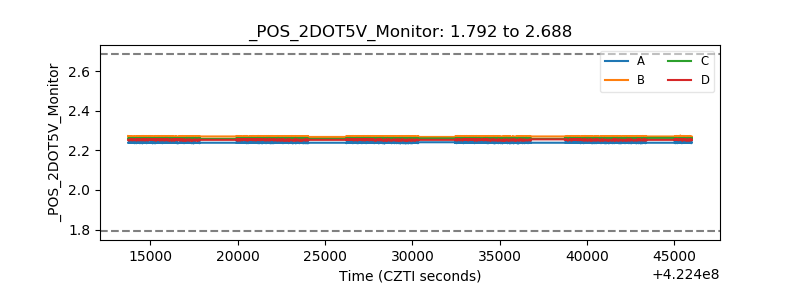 |
| +5 Volts monitor | 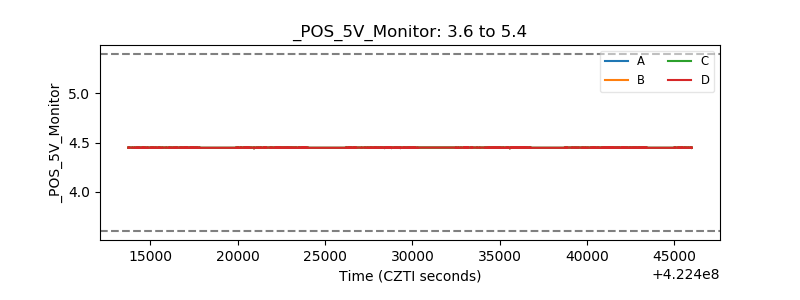 |
| _ROLL_ROT | 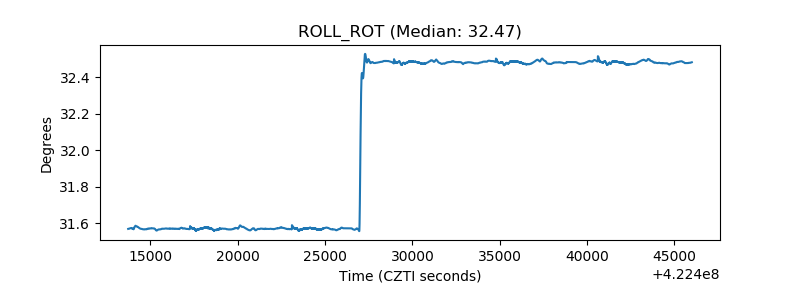 |
| _Roll_DEC | 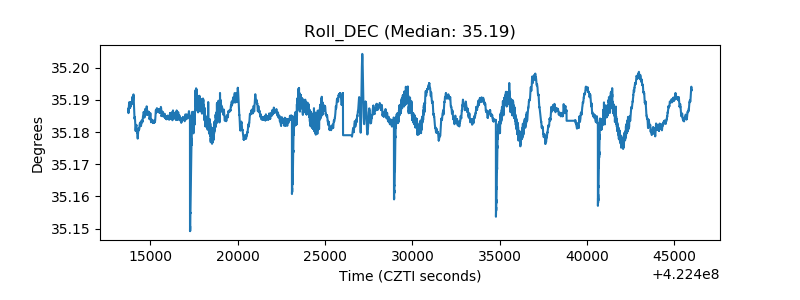 |
| _Roll_RA | 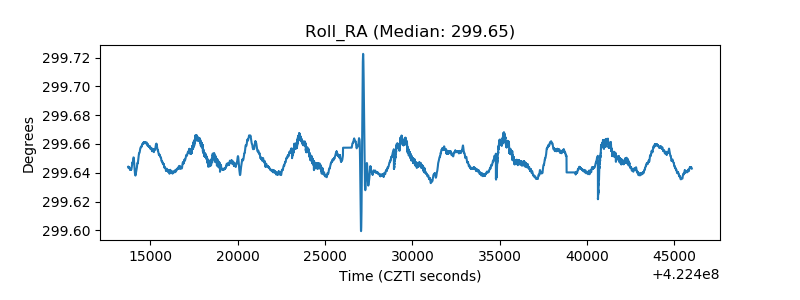 |
| Veto Counter | 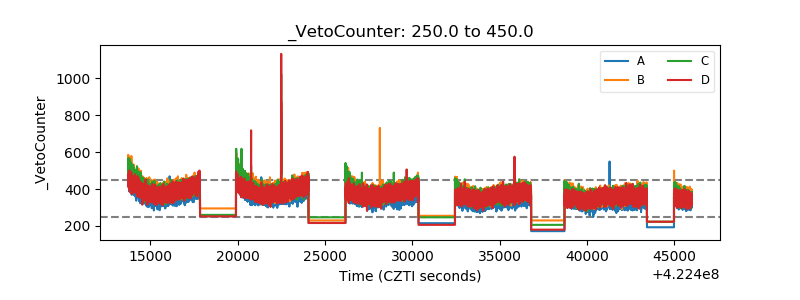 |