| Param | Original file | Final file |
|---|---|---|
| Filename | modeM0/AS1T05_105T01_9000005658_41349cztM0_level2.fits | modeM0/AS1T05_105T01_9000005658_41349cztM0_level2_quad_clean.evt |
| Size (bytes) | 378,964,800 | 93,798,720 |
| Size | 361.4 MB | 89.5 MB |
| Events in quadrant A | 3,186,679 | 639,050 |
| Events in quadrant B | 3,234,112 | 644,336 |
| Events in quadrant C | 3,284,834 | 591,664 |
| Events in quadrant D | 3,870,435 | 559,292 |
| Mode M9 | |||
|---|---|---|---|
| Quadrant | BADHDUFLAG | Total packets | Discarded packets |
| A | 0 | 23 | 0 |
| B | 0 | 23 | 0 |
| C | 0 | 23 | 0 |
| D | 0 | 24 | 0 |
| Mode SS | |||
|---|---|---|---|
| Quadrant | BADHDUFLAG | Total packets | Discarded packets |
| A | 0 | 118 | 0 |
| B | 0 | 118 | 0 |
| C | 0 | 118 | 0 |
| D | 0 | 118 | 0 |
| Mode M0 | |||
|---|---|---|---|
| Quadrant | BADHDUFLAG | Total packets | Discarded packets |
| A | 0 | 12845 | 3 |
| B | 0 | 13441 | 2 |
| C | 0 | 13263 | 2 |
| D | 0 | 15361 | 2 |
| Quadrant | Total seconds | Saturated seconds | Saturation percentage |
|---|---|---|---|
| A | 5805 | 34 | 0.585702% |
| B | 5805 | 125 | 2.153316% |
| C | 5805 | 225 | 3.875969% |
| D | 5805 | 159 | 2.739018% |
Noise dominated data is calculated using 1-second bins in cleaned event files. If a bin has >2000 counts, and if more than 50% of those come from <1% of pixels, then it is considered to be noise-dominated and hence unusable.
| Quadrant | # 1 sec bins | Bins with >0 counts | Bins with >2000 counts | High rate bins dominated by noise | Noise dominated (total time) | Noise dominated (detector-on time) | Marked lightcurve |
|---|---|---|---|---|---|---|---|
| A | 7148 | 5806 | 26 | 26 | 0.36% | 0.45% | 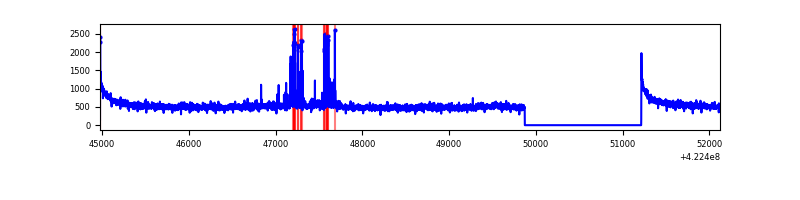 |
| B | 7148 | 5805 | 104 | 104 | 1.45% | 1.79% | 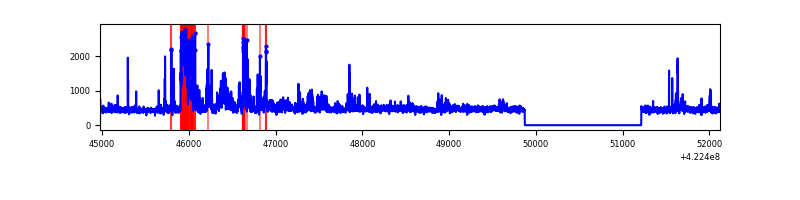 |
| C | 7148 | 5806 | 227 | 227 | 3.18% | 3.91% | 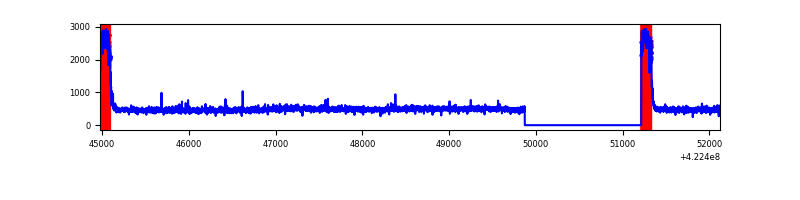 |
| D | 7148 | 5806 | 180 | 180 | 2.52% | 3.10% | 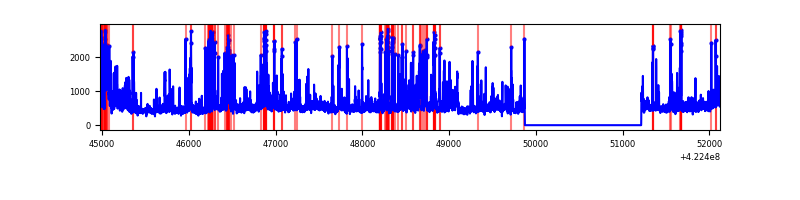 |
Top three noisy pixels from each quadrant. If the there are fewer than three noisy pixels in the level2.evt file, extra rows are filled as -1
| Pixel properties | Quadrant properties | ||||||
|---|---|---|---|---|---|---|---|
| Quadrant | DetID | PixID | Counts | Sigma | Mean | Median | Sigma |
| A | 10 | 83 | 541876 | 4090.26 | 640 | 627 | 132.3 |
| A | 13 | 248 | 132258 | 994.74 | 640 | 627 | 132.3 |
| A | 12 | 189 | 24358 | 179.34 | 640 | 627 | 132.3 |
| B | 5 | 255 | 597367 | 4827.9 | 631 | 612 | 123.6 |
| B | 0 | 190 | 107922 | 868.17 | 631 | 612 | 123.6 |
| B | 0 | 155 | 25337 | 200.03 | 631 | 612 | 123.6 |
| C | 0 | 10 | 652456 | 4529.01 | 607 | 610 | 143.9 |
| C | 15 | 214 | 247326 | 1714.18 | 607 | 610 | 143.9 |
| C | 8 | 128 | 5024 | 30.66 | 607 | 610 | 143.9 |
| D | 1 | 47 | 487853 | 3246.64 | 613 | 595 | 150.1 |
| D | 13 | 249 | 377853 | 2513.7 | 613 | 595 | 150.1 |
| D | 1 | 52 | 321979 | 2141.41 | 613 | 595 | 150.1 |
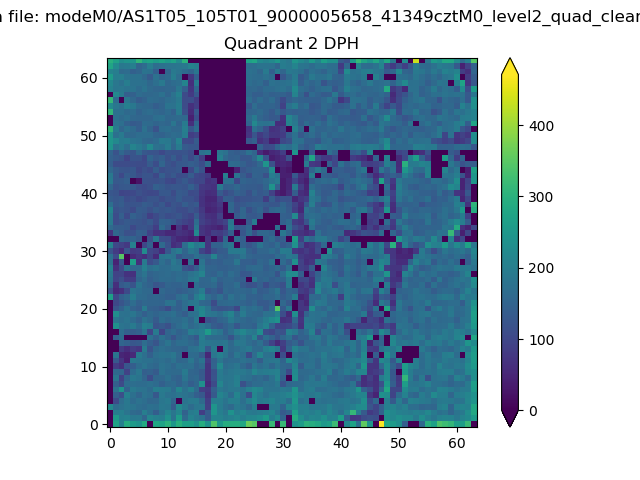
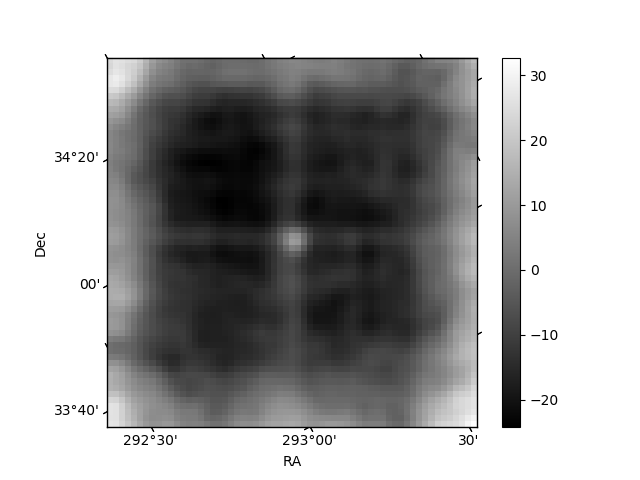
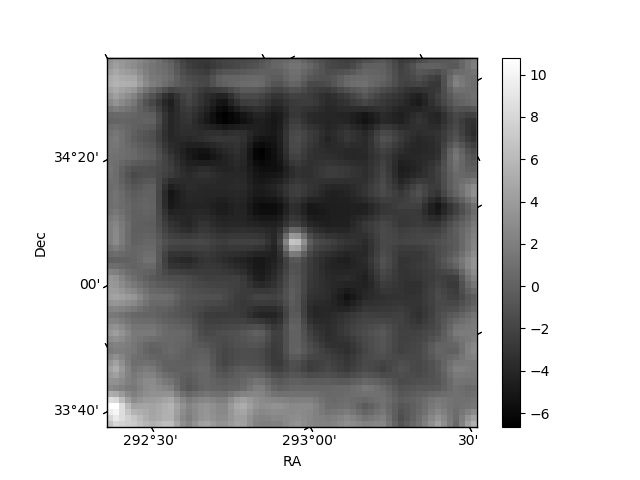
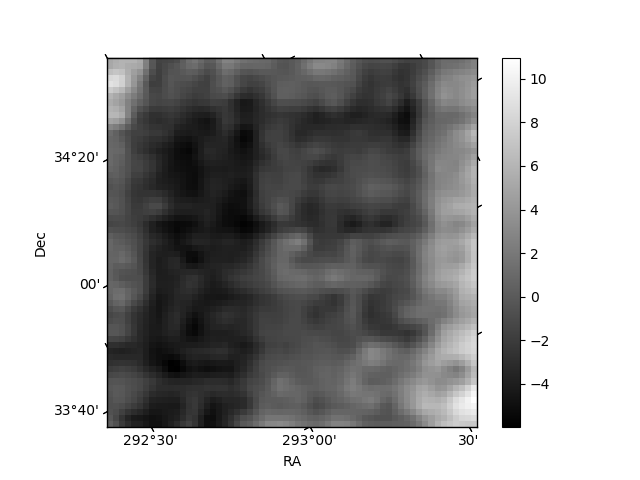
Histogram calculated using DETX and DETY for each event in the final _common_clean file
| Quadrant A | 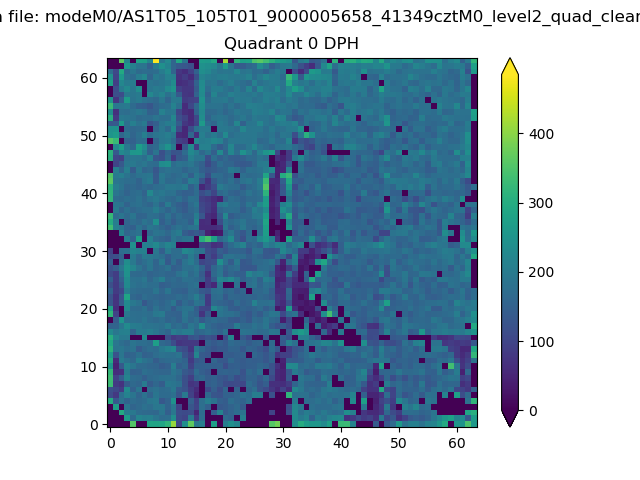 |
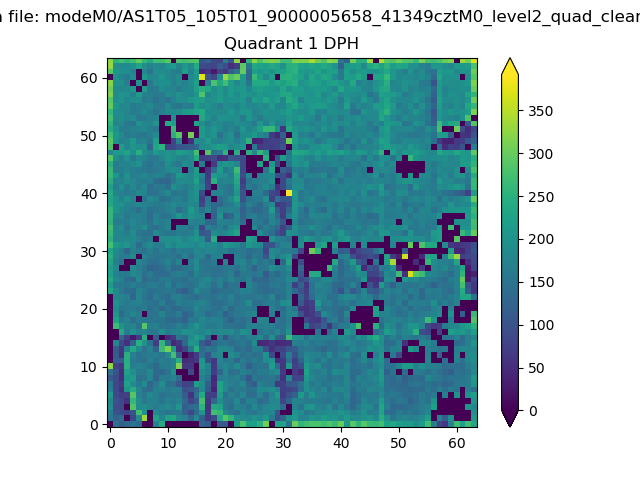 |
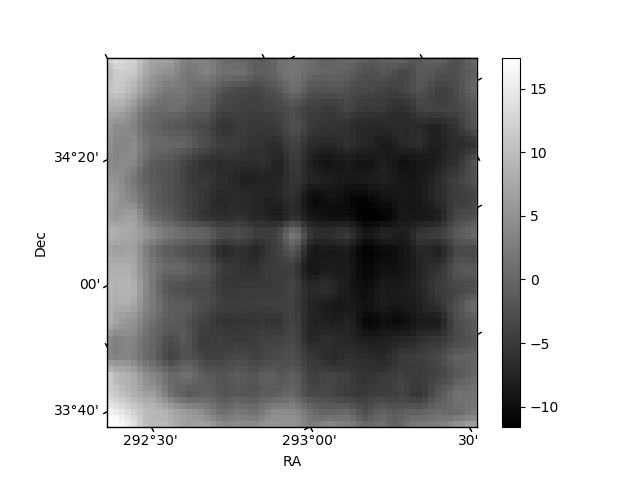
Quadrant B |
|---|---|---|---|
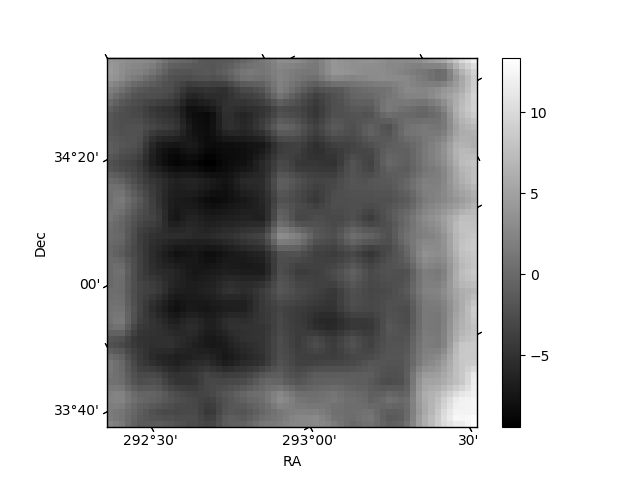
| Quadrant D | 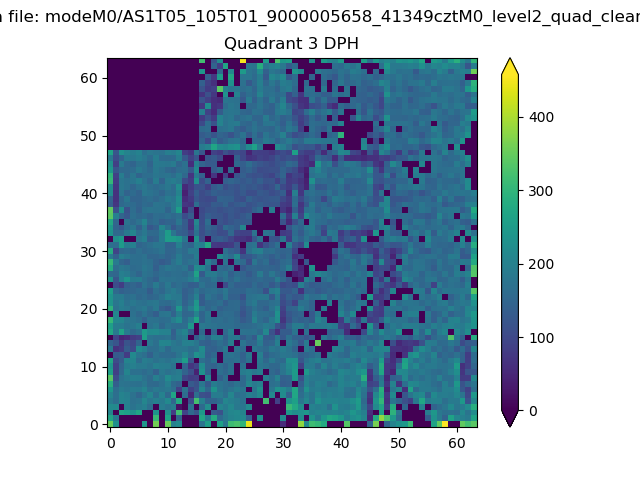 |
 |
Quadrant C |
| Plot type | Count rate plots | Images |
|---|---|---|
| Comparison with Poisson distribution Blue bars denote a histogram of data divided into 1 sec bins. Red curve is a Poisson curve with rate = median count rate of data. |
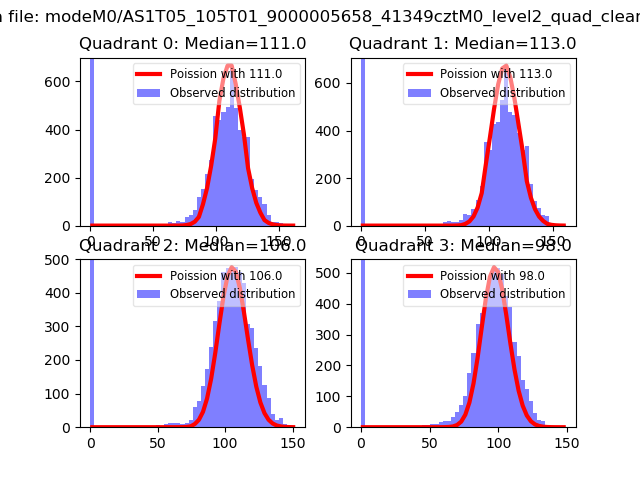 |
 |
| Quadrant-wise count rates Data is divided into 100 sec bins |
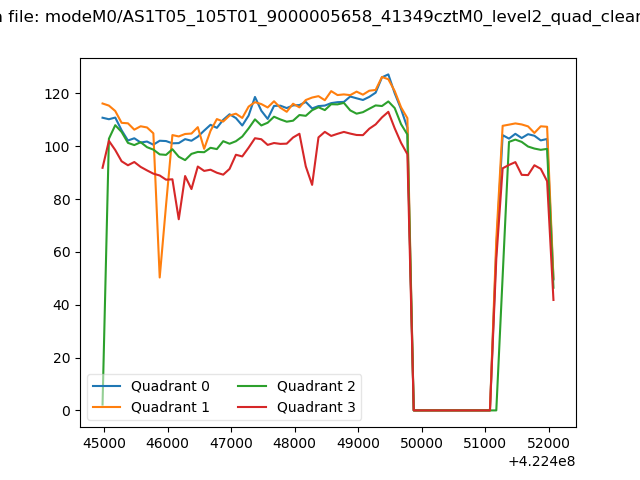 |
|
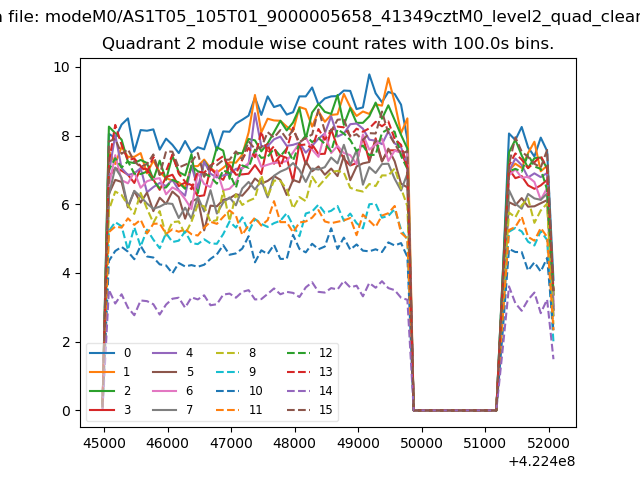
| Module-wise count rates for Quadrant A Data is divided into 100 sec bins |
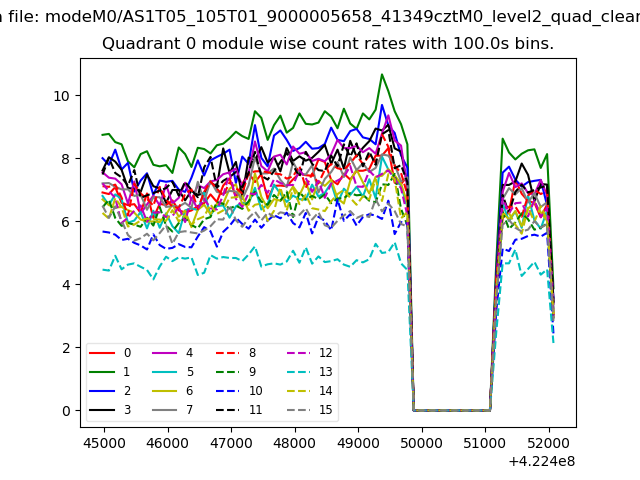 |
 |
| Module-wise count rates for Quadrant B Data is divided into 100 sec bins |
 |
 |
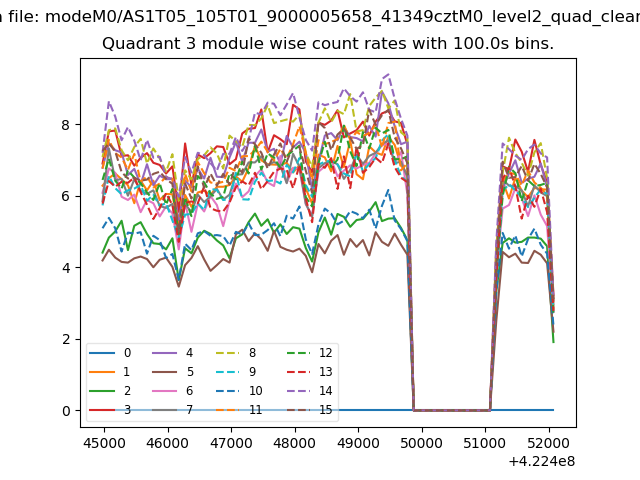
| Module-wise count rates for Quadrant C Data is divided into 100 sec bins |
 |
 |
| Module-wise count rates for Quadrant D Data is divided into 100 sec bins |
 |
 |
| Parameter | Plot |
|---|---|
| CZT HV Monitor | 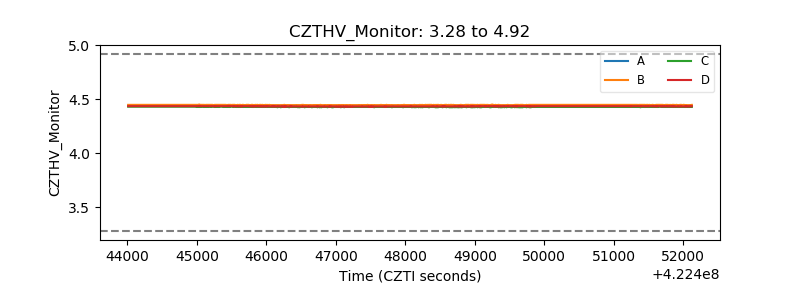 |
| D_VDD | 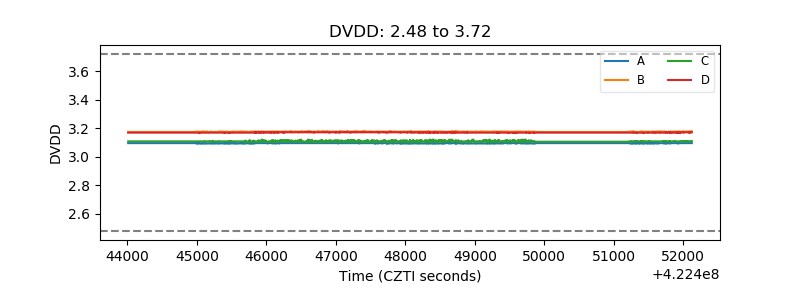 |
| Temperature 1 | 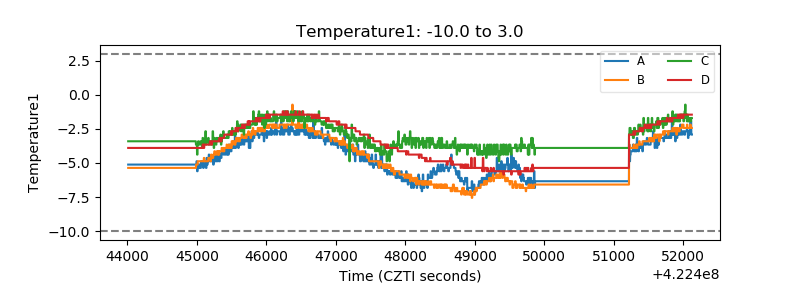 |
| Veto HV Monitor | 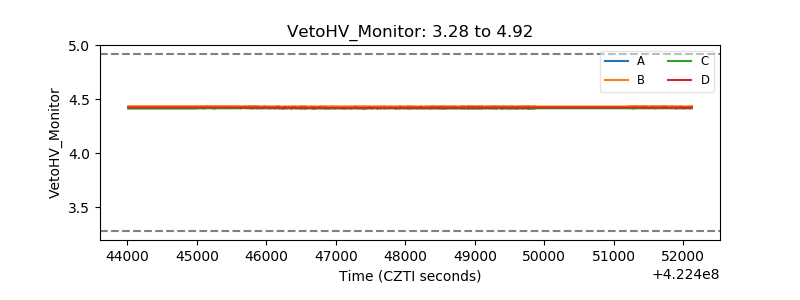 |
| Veto LLD | 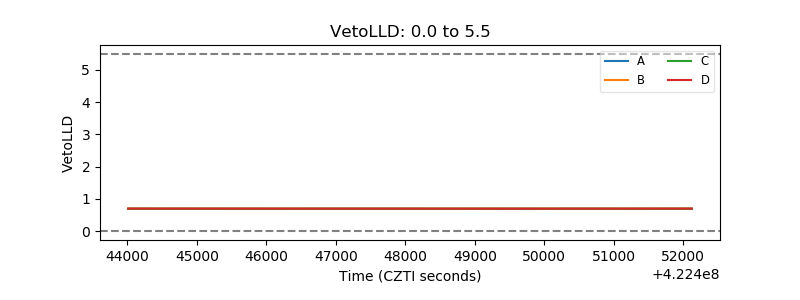 |
| Alpha Counter | 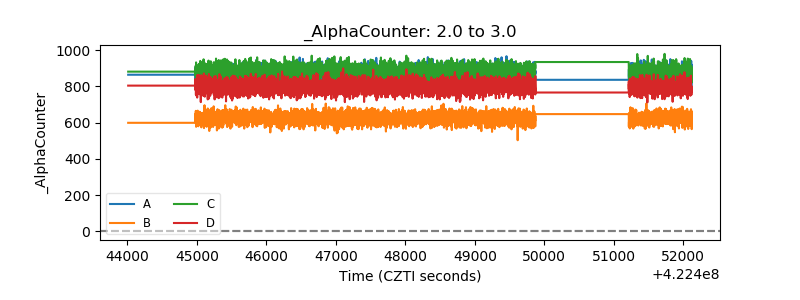 |
| _CPM_Rate | 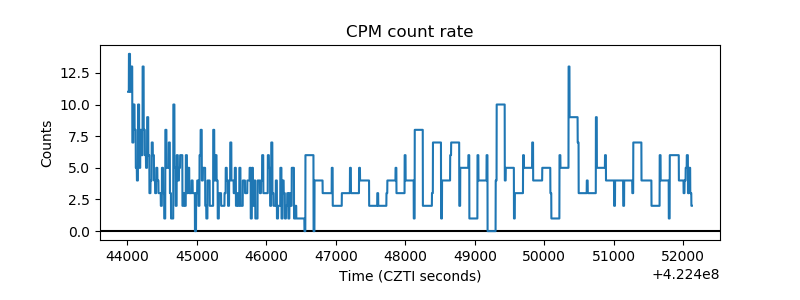 |
| CZT Counter | 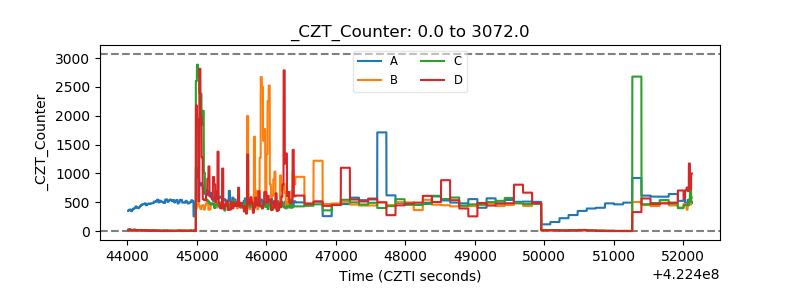 |
| +2.5 Volts monitor | 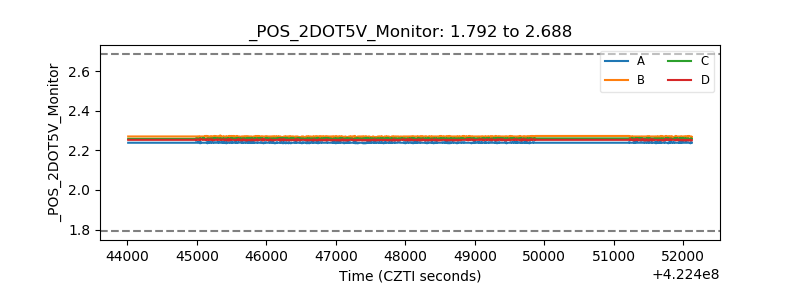 |
| +5 Volts monitor | 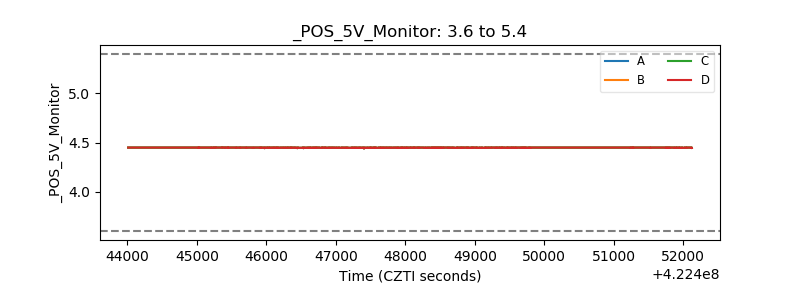 |
| _ROLL_ROT | 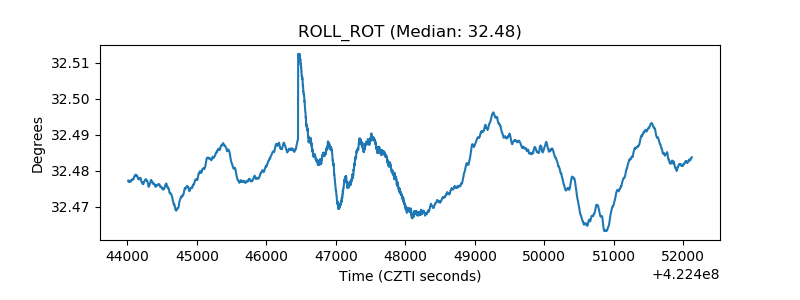 |
| _Roll_DEC | 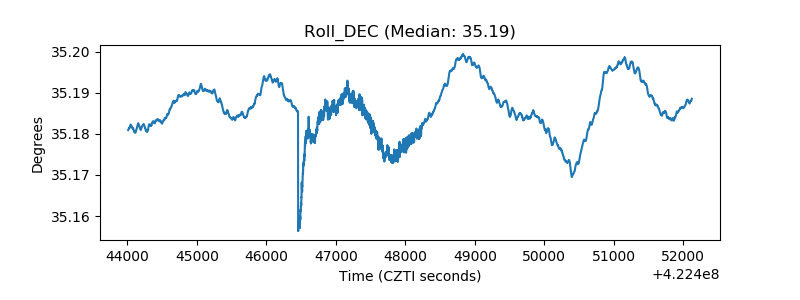 |
| _Roll_RA | 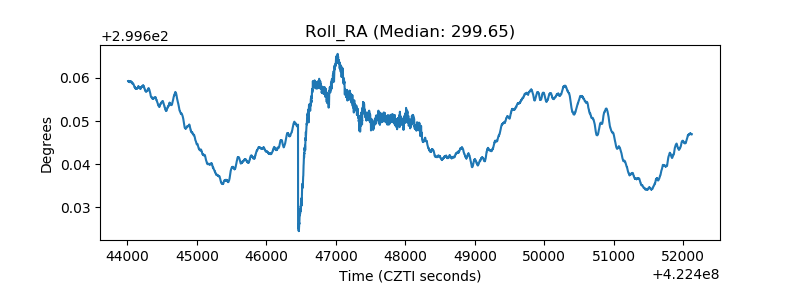 |
| Veto Counter | 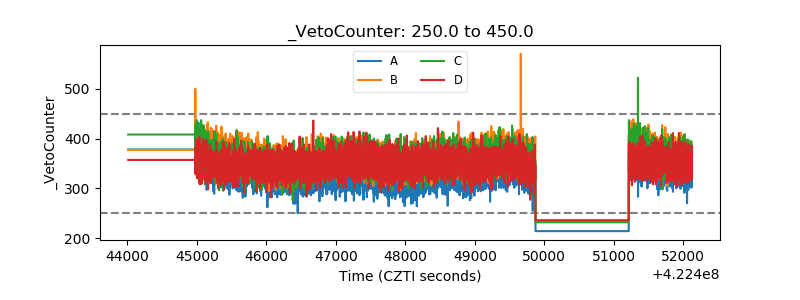 |