| Param | Original file | Final file |
|---|---|---|
| Filename | modeM0/AS1T05_105T01_9000005658_41350cztM0_level2.fits | modeM0/AS1T05_105T01_9000005658_41350cztM0_level2_quad_clean.evt |
| Size (bytes) | 444,565,440 | 93,015,360 |
| Size | 424.0 MB | 88.7 MB |
| Events in quadrant A | 3,156,567 | 658,453 |
| Events in quadrant B | 2,779,084 | 667,797 |
| Events in quadrant C | 3,348,703 | 602,284 |
| Events in quadrant D | 6,708,943 | 472,244 |
| Mode M9 | |||
|---|---|---|---|
| Quadrant | BADHDUFLAG | Total packets | Discarded packets |
| A | 0 | 20 | 0 |
| B | 0 | 20 | 0 |
| C | 0 | 20 | 0 |
| D | 0 | 21 | 0 |
| Mode SS | |||
|---|---|---|---|
| Quadrant | BADHDUFLAG | Total packets | Discarded packets |
| A | 0 | 120 | 0 |
| B | 0 | 120 | 0 |
| C | 0 | 120 | 0 |
| D | 0 | 120 | 0 |
| Mode M0 | |||
|---|---|---|---|
| Quadrant | BADHDUFLAG | Total packets | Discarded packets |
| A | 0 | 12848 | 3 |
| B | 0 | 12284 | 2 |
| C | 0 | 13547 | 2 |
| D | 0 | 24041 | 2 |
| Quadrant | Total seconds | Saturated seconds | Saturation percentage |
|---|---|---|---|
| A | 5951 | 13 | 0.218451% |
| B | 5951 | 18 | 0.302470% |
| C | 5951 | 225 | 3.780877% |
| D | 5951 | 1283 | 21.559402% |
Noise dominated data is calculated using 1-second bins in cleaned event files. If a bin has >2000 counts, and if more than 50% of those come from <1% of pixels, then it is considered to be noise-dominated and hence unusable.
| Quadrant | # 1 sec bins | Bins with >0 counts | Bins with >2000 counts | High rate bins dominated by noise | Noise dominated (total time) | Noise dominated (detector-on time) | Marked lightcurve |
|---|---|---|---|---|---|---|---|
| A | 7233 | 5950 | 6 | 6 | 0.08% | 0.10% | 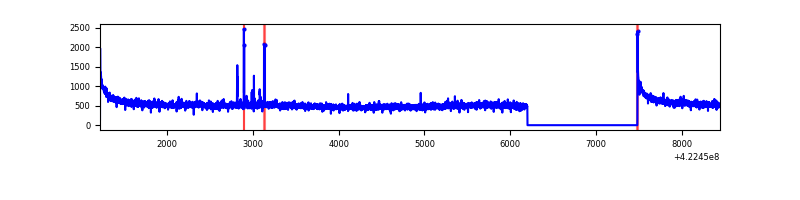 |
| B | 7233 | 5950 | 5 | 5 | 0.07% | 0.08% | 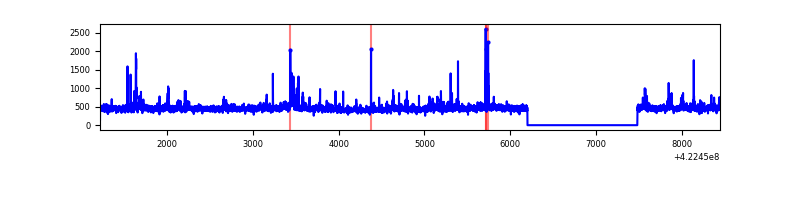 |
| C | 7234 | 5951 | 221 | 221 | 3.06% | 3.71% | 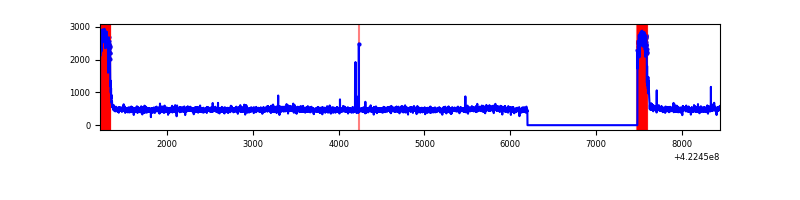 |
| D | 7233 | 5950 | 1280 | 1280 | 17.70% | 21.51% | 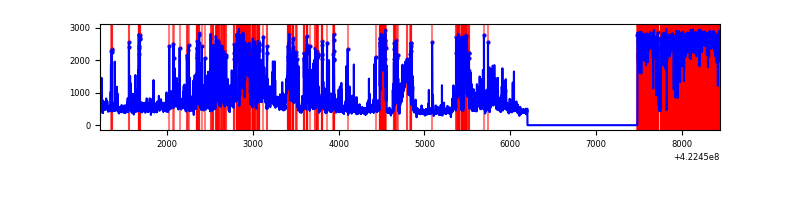 |
Top three noisy pixels from each quadrant. If the there are fewer than three noisy pixels in the level2.evt file, extra rows are filled as -1
| Pixel properties | Quadrant properties | ||||||
|---|---|---|---|---|---|---|---|
| Quadrant | DetID | PixID | Counts | Sigma | Mean | Median | Sigma |
| A | 10 | 83 | 549328 | 4020.34 | 661 | 648 | 136.5 |
| A | 13 | 248 | 28952 | 207.39 | 661 | 648 | 136.5 |
| A | 12 | 189 | 14528 | 101.7 | 661 | 648 | 136.5 |
| B | 0 | 190 | 83427 | 644.92 | 655 | 636 | 128.4 |
| B | 5 | 255 | 81648 | 631.06 | 655 | 636 | 128.4 |
| B | 0 | 155 | 28422 | 216.45 | 655 | 636 | 128.4 |
| C | 0 | 10 | 644295 | 4361.49 | 624 | 628 | 147.6 |
| C | 15 | 214 | 248650 | 1680.6 | 624 | 628 | 147.6 |
| C | 5 | 128 | 11003 | 70.3 | 624 | 628 | 147.6 |
| D | 12 | 217 | 2405007 | 16933.86 | 572 | 556 | 142.0 |
| D | 13 | 249 | 1024926 | 7214.34 | 572 | 556 | 142.0 |
| D | 1 | 52 | 344450 | 2421.95 | 572 | 556 | 142.0 |
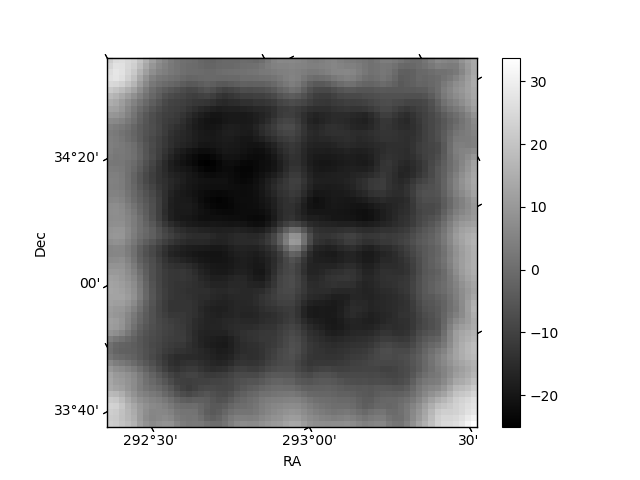
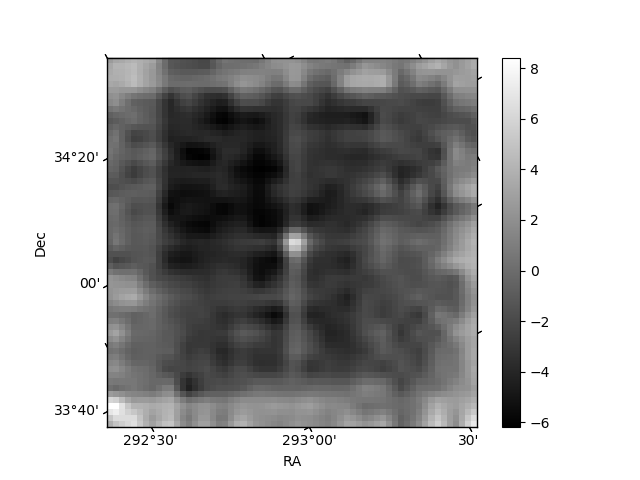
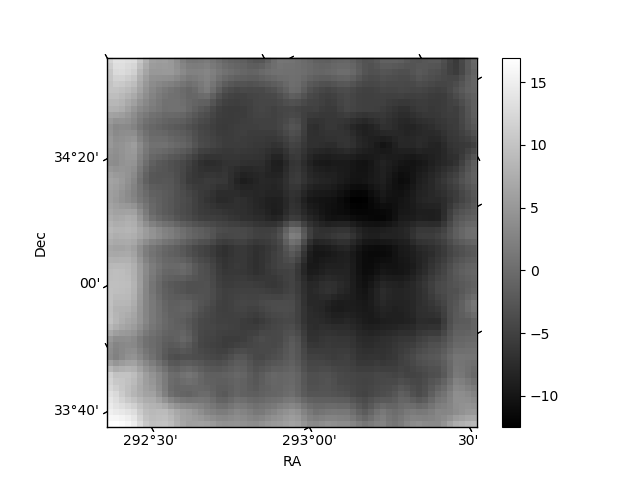
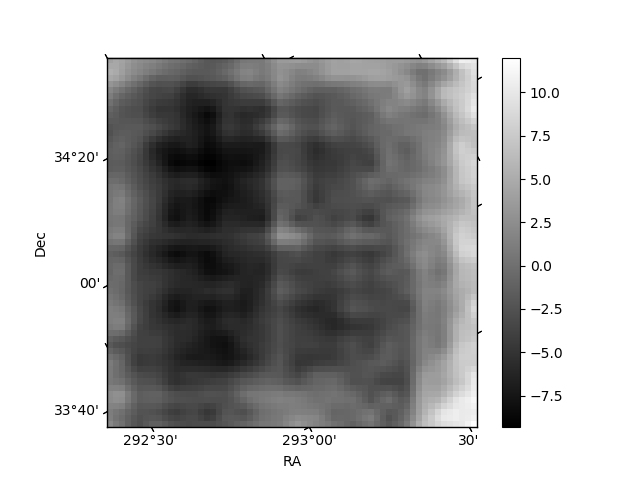
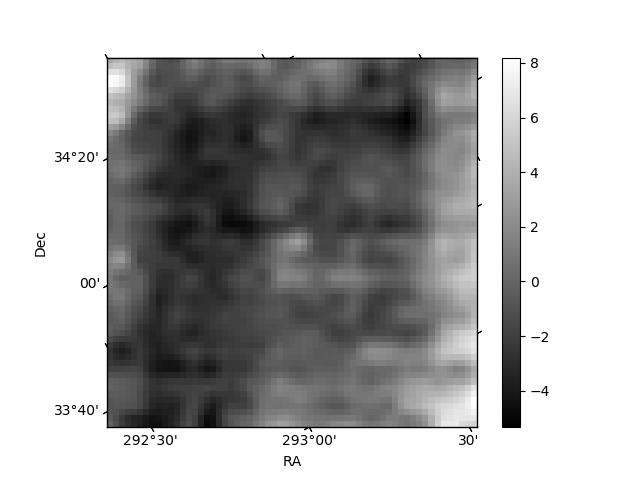
Histogram calculated using DETX and DETY for each event in the final _common_clean file
| Quadrant A | 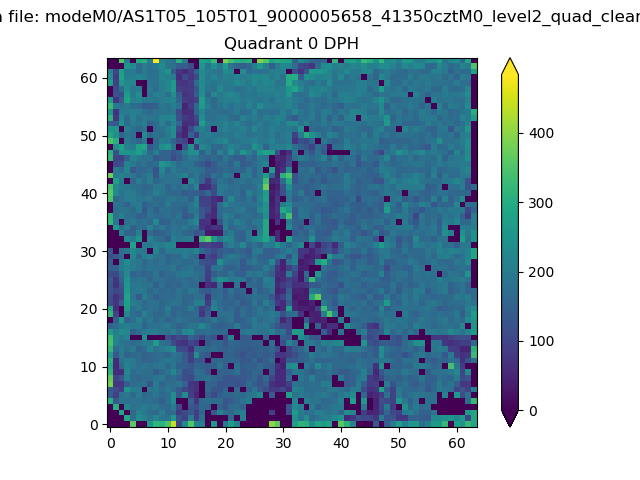 |
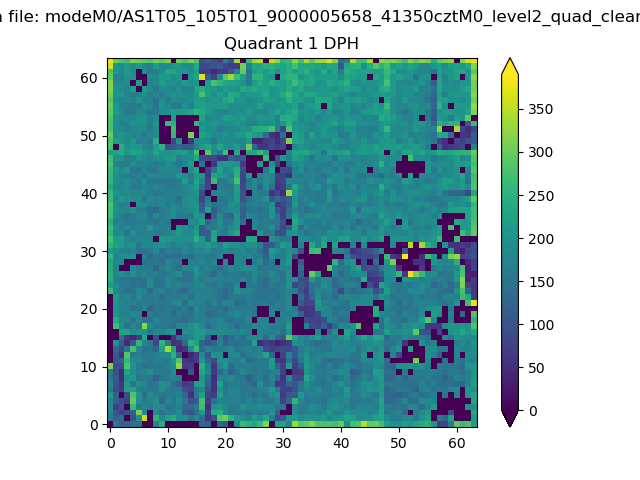 |
Quadrant B |
|---|---|---|---|
| Quadrant D | 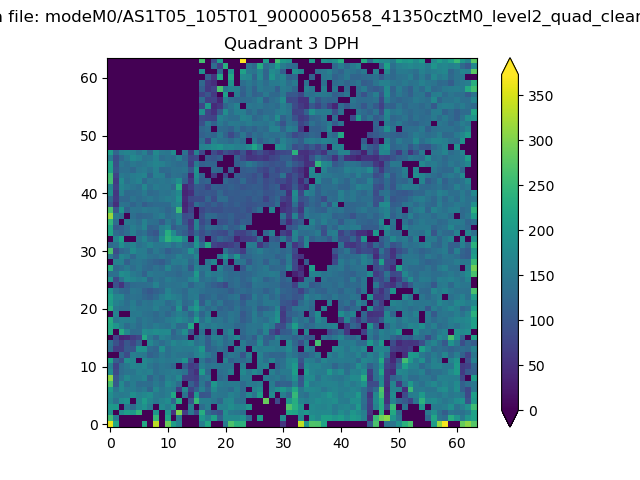 |
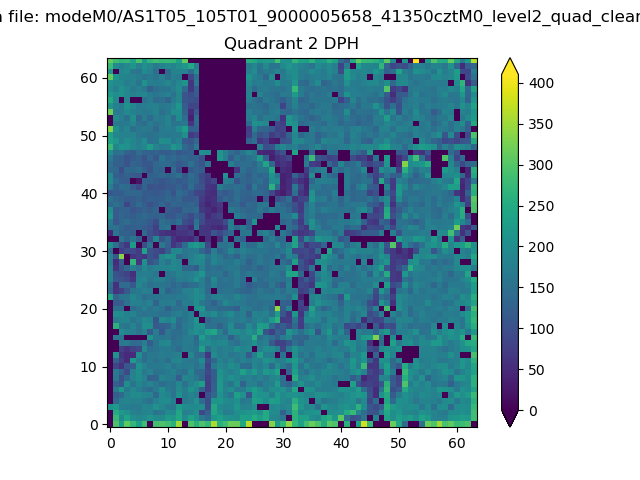 |
Quadrant C |
| Plot type | Count rate plots | Images |
|---|---|---|
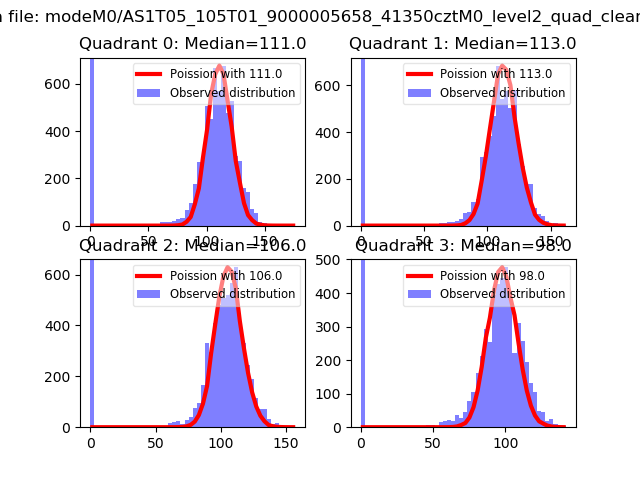
| Comparison with Poisson distribution Blue bars denote a histogram of data divided into 1 sec bins. Red curve is a Poisson curve with rate = median count rate of data. |
 |
 |
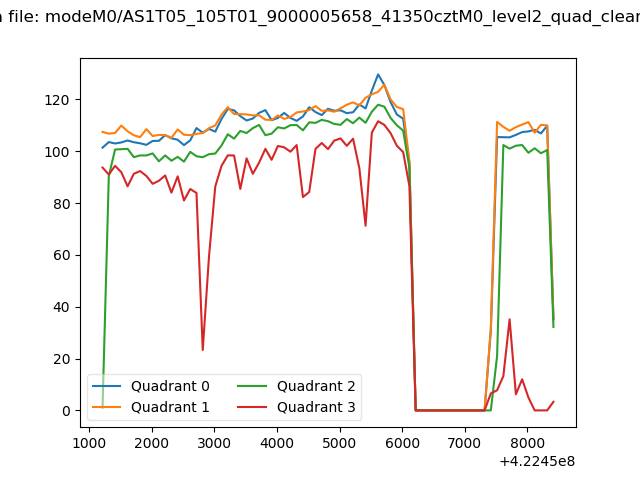
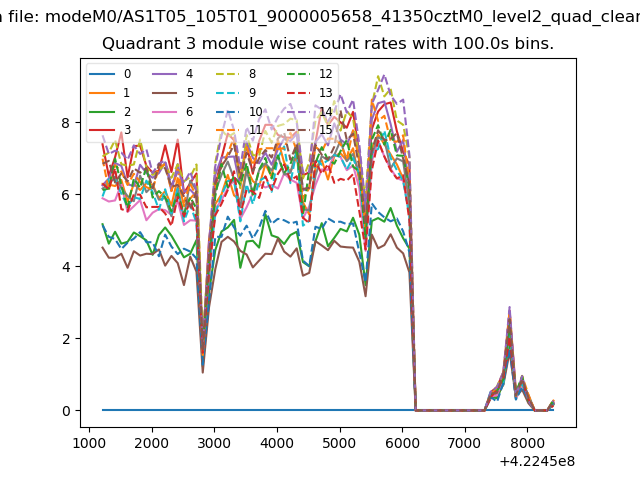
| Quadrant-wise count rates Data is divided into 100 sec bins |
 |
|
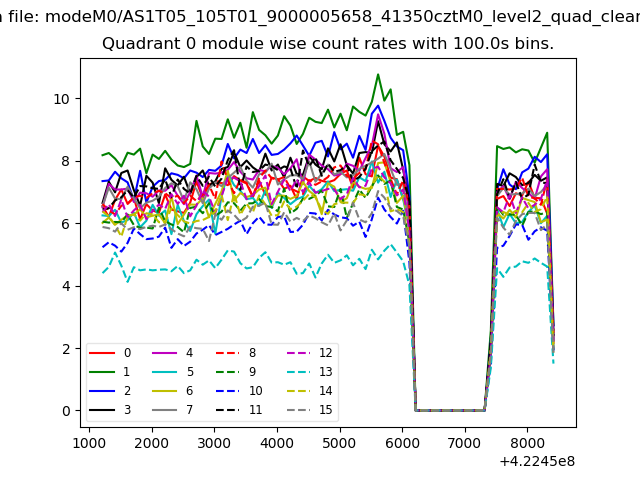
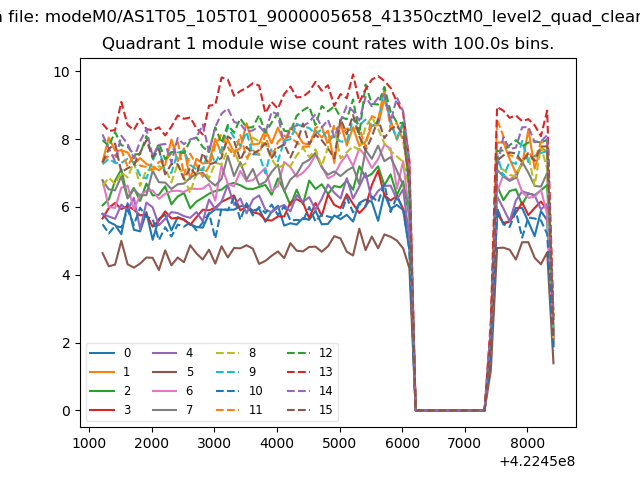
| Module-wise count rates for Quadrant A Data is divided into 100 sec bins |
 |
 |
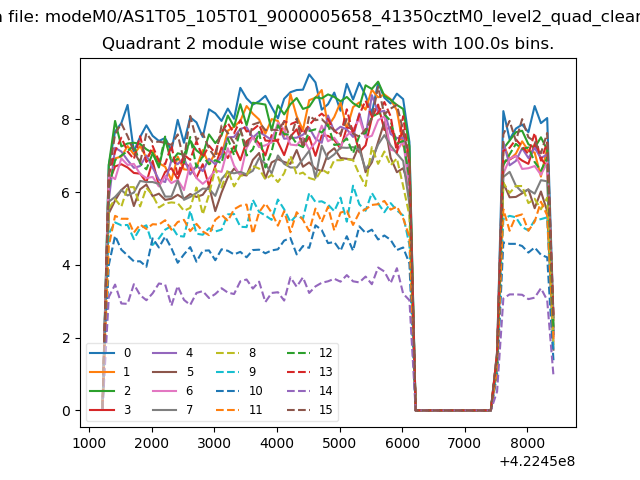
| Module-wise count rates for Quadrant B Data is divided into 100 sec bins |
 |
 |
| Module-wise count rates for Quadrant C Data is divided into 100 sec bins |
 |
 |
| Module-wise count rates for Quadrant D Data is divided into 100 sec bins |
 |
 |
| Parameter | Plot |
|---|---|
| CZT HV Monitor | 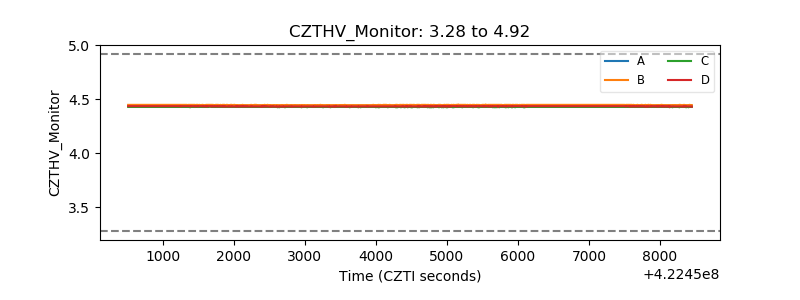 |
| D_VDD |  |
| Temperature 1 | 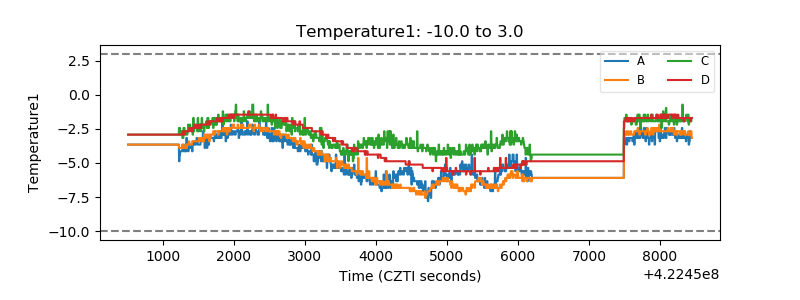 |
| Veto HV Monitor | 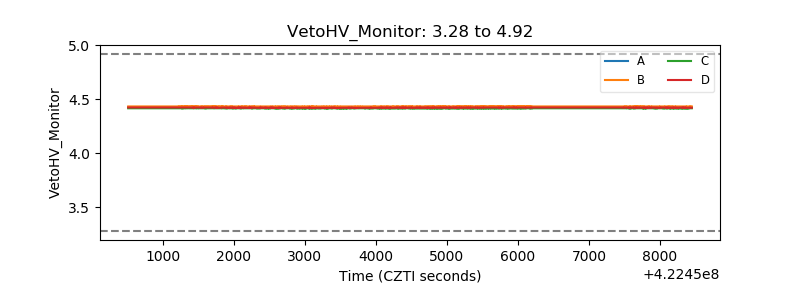 |
| Veto LLD | 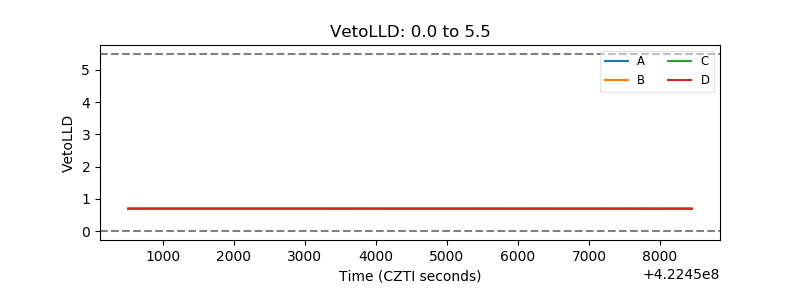 |
| Alpha Counter | 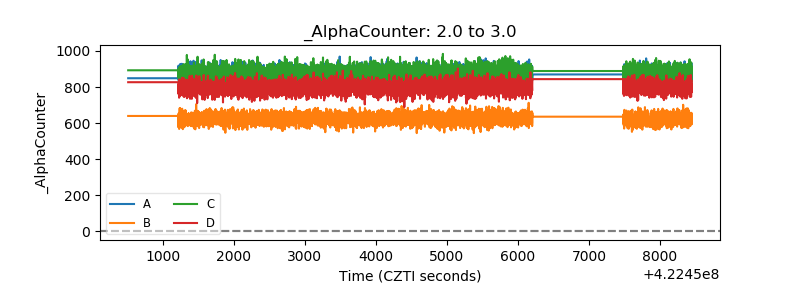 |
| _CPM_Rate | 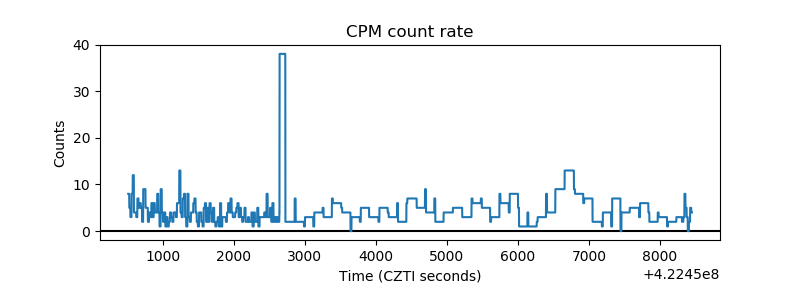 |
| CZT Counter | 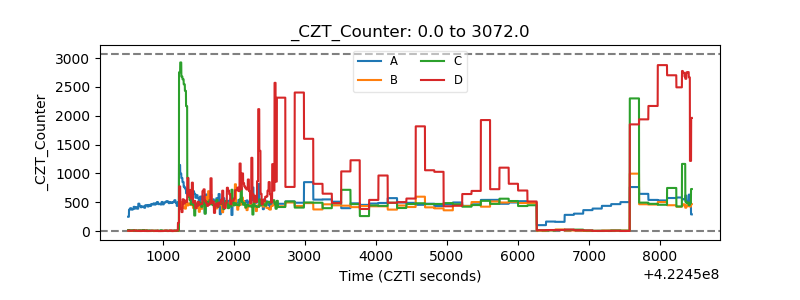 |
| +2.5 Volts monitor | 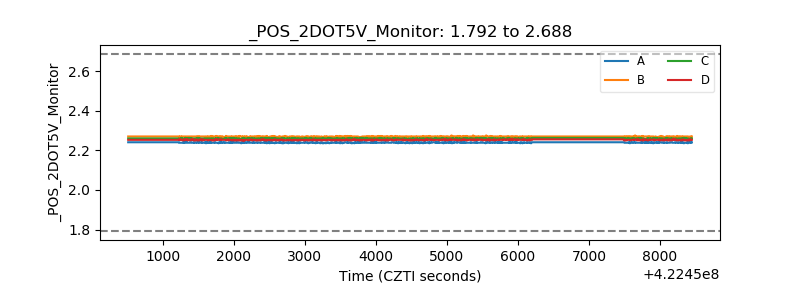 |
| +5 Volts monitor | 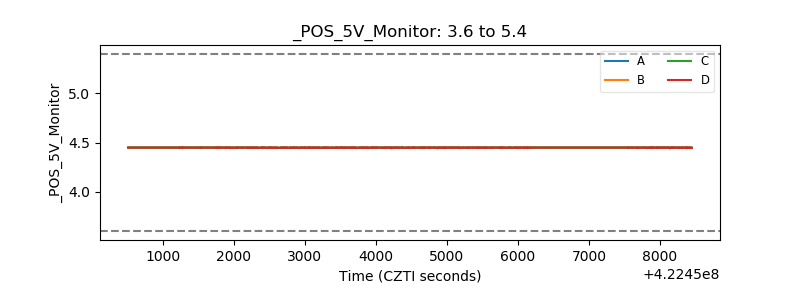 |
| _ROLL_ROT | 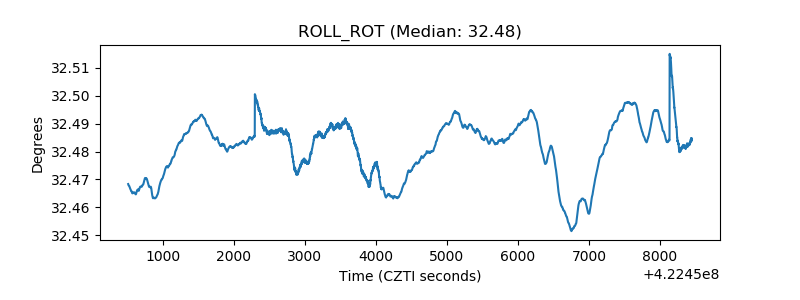 |
| _Roll_DEC | 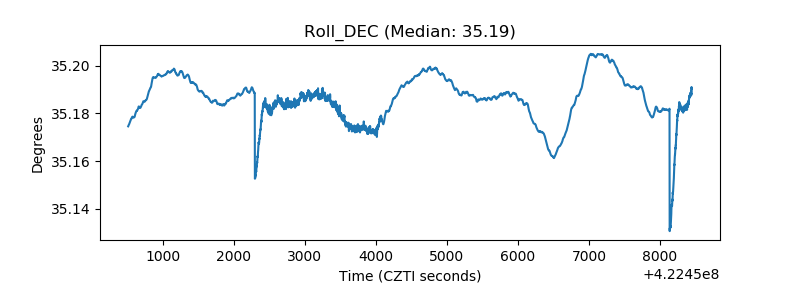 |
| _Roll_RA | 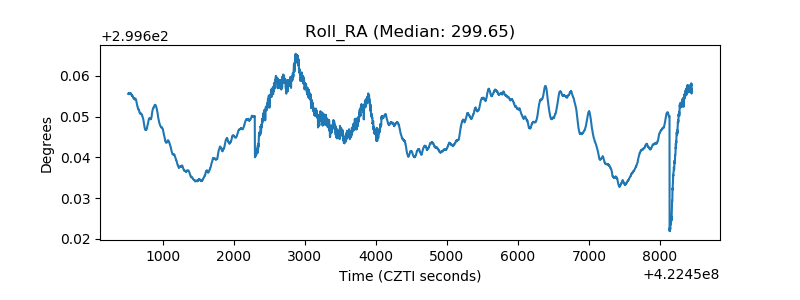 |
| Veto Counter | 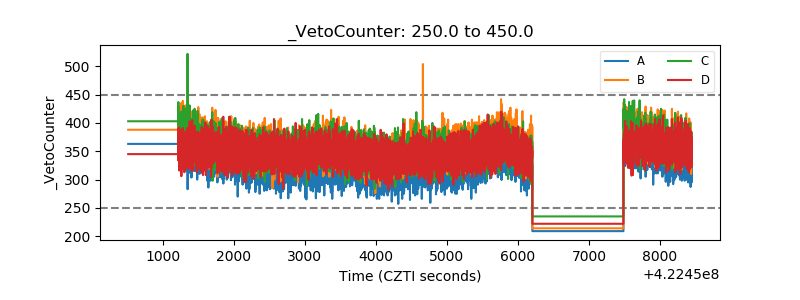 |