| Param | Original file | Final file |
|---|---|---|
| Filename | modeM0/AS1T05_105T01_9000005658_41352cztM0_level2.fits | modeM0/AS1T05_105T01_9000005658_41352cztM0_level2_quad_clean.evt |
| Size (bytes) | 900,230,400 | 162,466,560 |
| Size | 858.5 MB | 154.9 MB |
| Events in quadrant A | 5,608,672 | 1,185,467 |
| Events in quadrant B | 4,921,272 | 1,201,311 |
| Events in quadrant C | 6,041,968 | 1,103,990 |
| Events in quadrant D | 15,919,968 | 685,457 |
| Mode M9 | |||
|---|---|---|---|
| Quadrant | BADHDUFLAG | Total packets | Discarded packets |
| A | 0 | 33 | 0 |
| B | 0 | 33 | 0 |
| C | 0 | 33 | 0 |
| D | 0 | 34 | 0 |
| Mode SS | |||
|---|---|---|---|
| Quadrant | BADHDUFLAG | Total packets | Discarded packets |
| A | 0 | 218 | 0 |
| B | 0 | 218 | 0 |
| C | 0 | 218 | 0 |
| D | 0 | 218 | 0 |
| Mode M0 | |||
|---|---|---|---|
| Quadrant | BADHDUFLAG | Total packets | Discarded packets |
| A | 0 | 23149 | 4 |
| B | 0 | 21943 | 3 |
| C | 0 | 24437 | 3 |
| D | 0 | 54617 | 3 |
| Quadrant | Total seconds | Saturated seconds | Saturation percentage |
|---|---|---|---|
| A | 10728 | 23 | 0.214392% |
| B | 10728 | 33 | 0.307606% |
| C | 10728 | 361 | 3.365026% |
| D | 10728 | 4167 | 38.842282% |
Noise dominated data is calculated using 1-second bins in cleaned event files. If a bin has >2000 counts, and if more than 50% of those come from <1% of pixels, then it is considered to be noise-dominated and hence unusable.
| Quadrant | # 1 sec bins | Bins with >0 counts | Bins with >2000 counts | High rate bins dominated by noise | Noise dominated (total time) | Noise dominated (detector-on time) | Marked lightcurve |
|---|---|---|---|---|---|---|---|
| A | 13502 | 10729 | 7 | 7 | 0.05% | 0.07% | 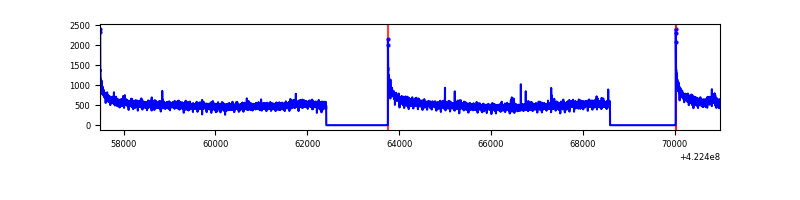 |
| B | 13502 | 10727 | 11 | 11 | 0.08% | 0.10% | 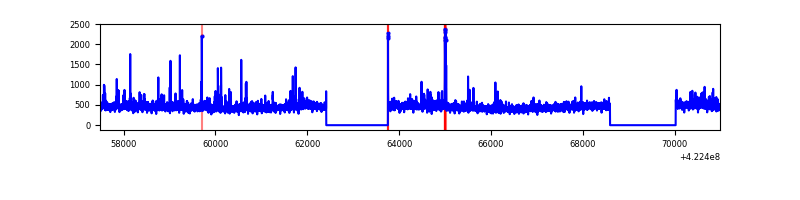 |
| C | 13502 | 10727 | 346 | 346 | 2.56% | 3.23% | 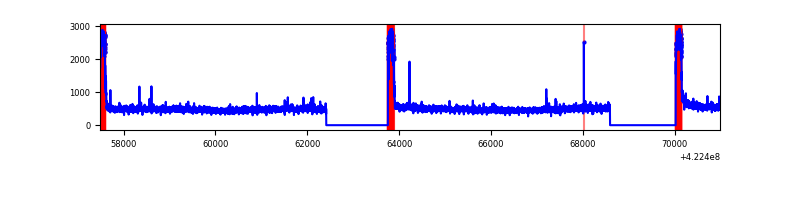 |
| D | 13502 | 10727 | 4311 | 4311 | 31.93% | 40.19% | 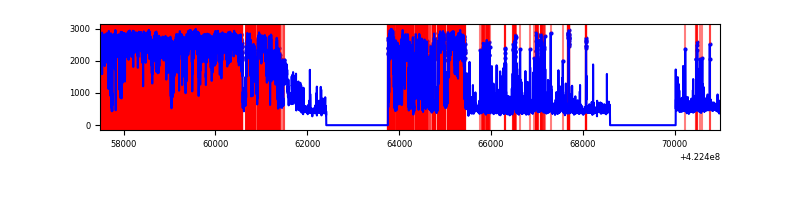 |
Top three noisy pixels from each quadrant. If the there are fewer than three noisy pixels in the level2.evt file, extra rows are filled as -1
| Pixel properties | Quadrant properties | ||||||
|---|---|---|---|---|---|---|---|
| Quadrant | DetID | PixID | Counts | Sigma | Mean | Median | Sigma |
| A | 10 | 83 | 947522 | 3865.14 | 1192 | 1166 | 244.8 |
| A | 12 | 189 | 44789 | 178.17 | 1192 | 1166 | 244.8 |
| A | 13 | 6 | 14301 | 53.65 | 1192 | 1166 | 244.8 |
| B | 0 | 190 | 143522 | 619.49 | 1181 | 1146 | 229.8 |
| B | 5 | 255 | 87079 | 373.9 | 1181 | 1146 | 229.8 |
| B | 0 | 229 | 31869 | 133.68 | 1181 | 1146 | 229.8 |
| C | 0 | 10 | 1138855 | 4306.25 | 1131 | 1137 | 264.2 |
| C | 15 | 214 | 443635 | 1674.85 | 1131 | 1137 | 264.2 |
| C | 10 | 22 | 15597 | 54.73 | 1131 | 1137 | 264.2 |
| D | 12 | 217 | 9724103 | 41104.9 | 964 | 936 | 236.5 |
| D | 1 | 52 | 965298 | 4076.86 | 964 | 936 | 236.5 |
| D | 13 | 249 | 962132 | 4063.47 | 964 | 936 | 236.5 |
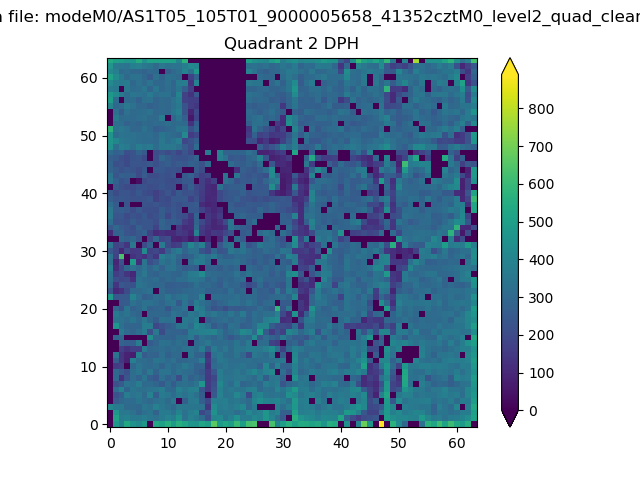
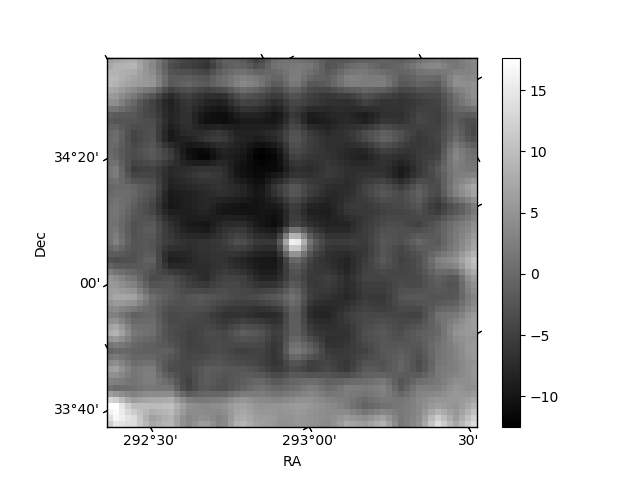
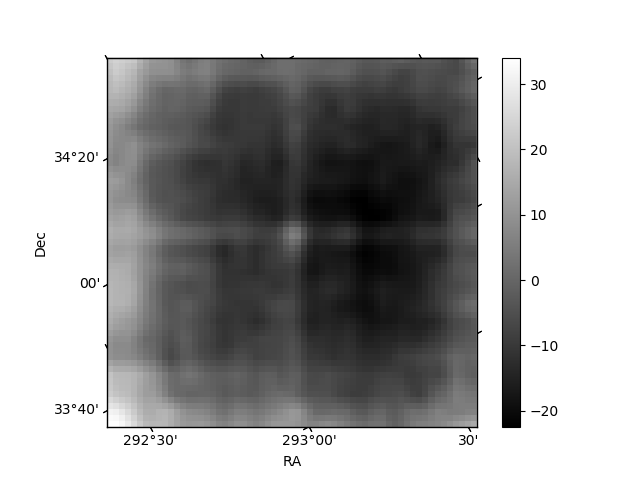
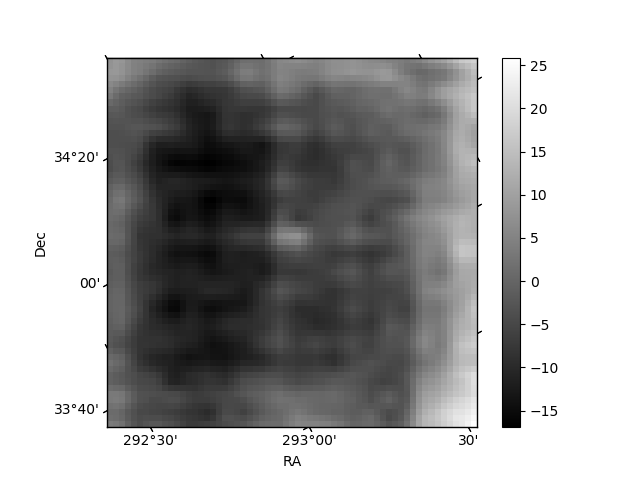
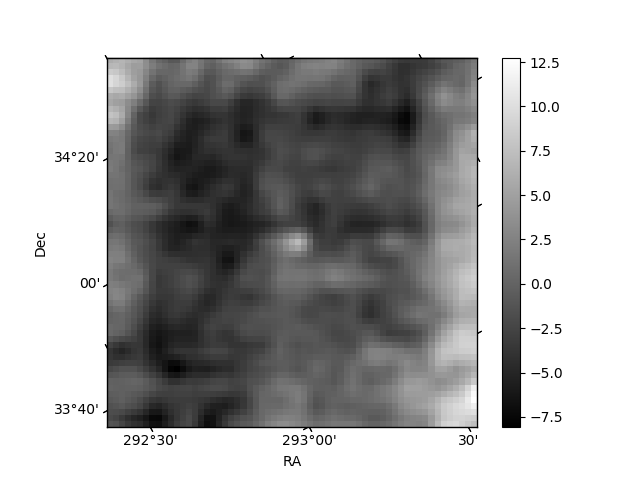
Histogram calculated using DETX and DETY for each event in the final _common_clean file
| Quadrant A | 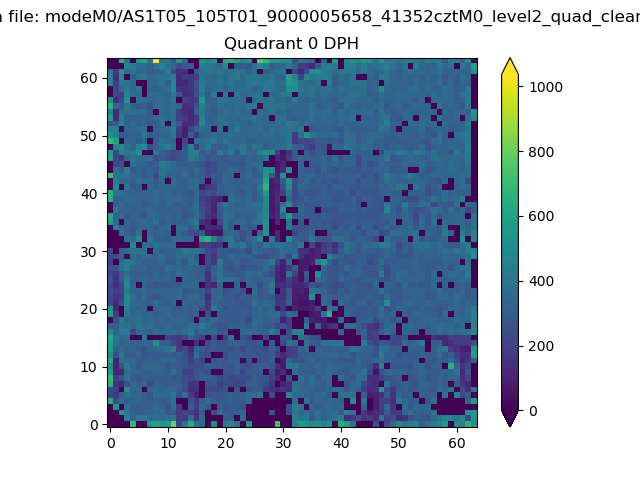 |
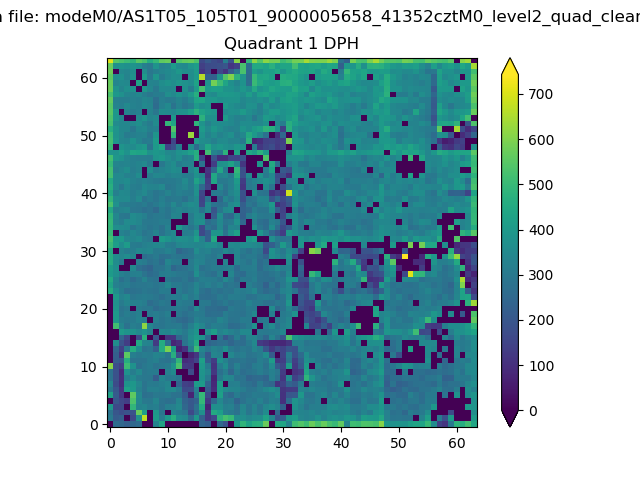 |
Quadrant B |
|---|---|---|---|
| Quadrant D | 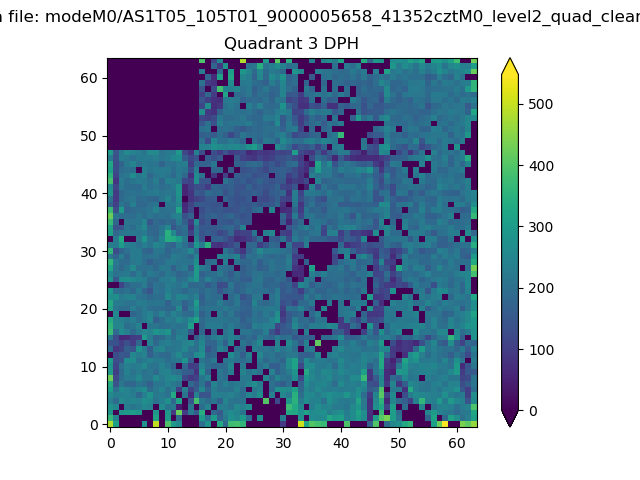 |
 |
Quadrant C |
| Plot type | Count rate plots | Images |
|---|---|---|
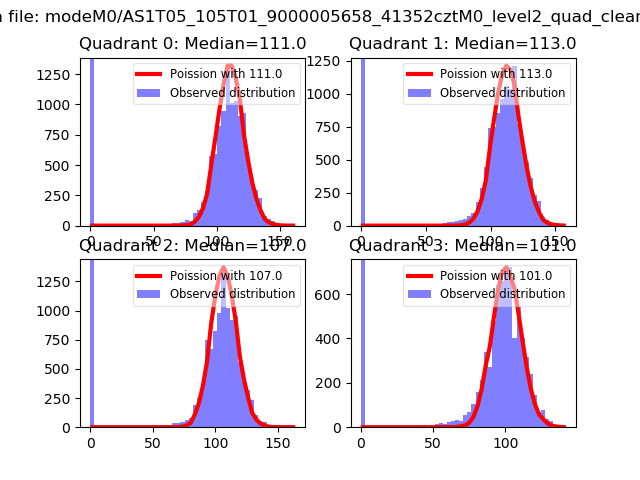
| Comparison with Poisson distribution Blue bars denote a histogram of data divided into 1 sec bins. Red curve is a Poisson curve with rate = median count rate of data. |
 |
 |
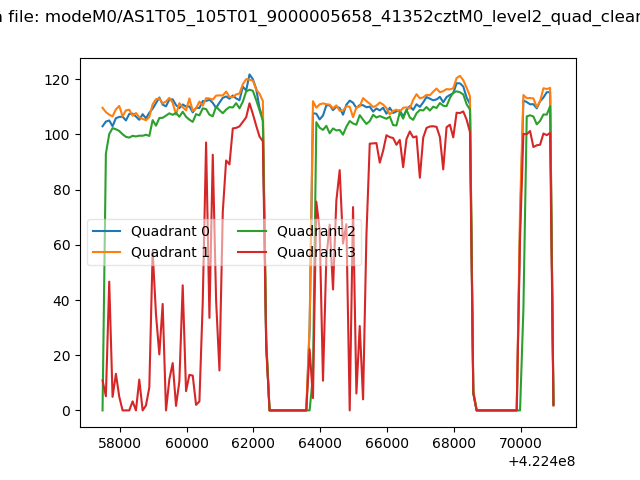
| Quadrant-wise count rates Data is divided into 100 sec bins |
 |
|
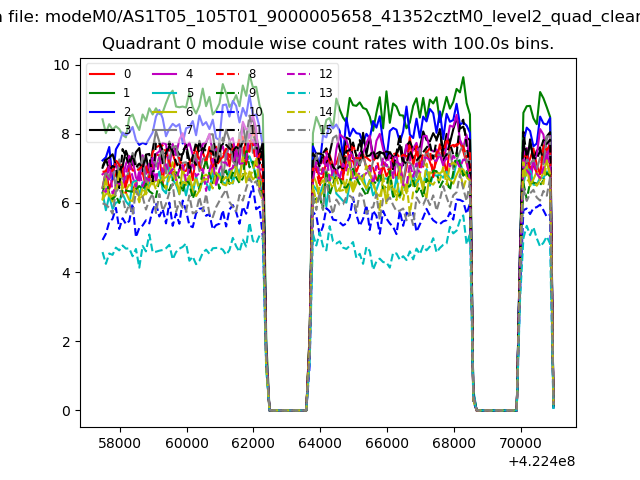
| Module-wise count rates for Quadrant A Data is divided into 100 sec bins |
 |
 |
| Module-wise count rates for Quadrant B Data is divided into 100 sec bins |
 |
 |
| Module-wise count rates for Quadrant C Data is divided into 100 sec bins |
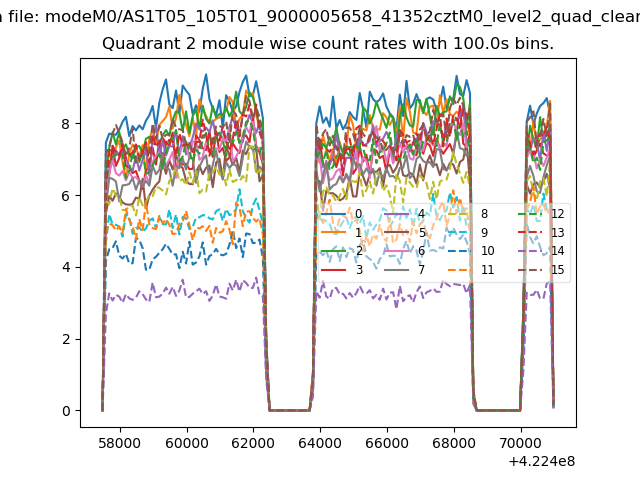 |
 |
| Module-wise count rates for Quadrant D Data is divided into 100 sec bins |
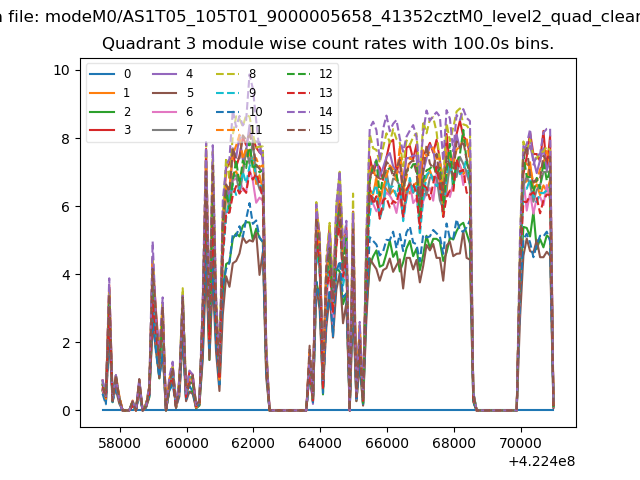 |
 |
| Parameter | Plot |
|---|---|
| CZT HV Monitor | 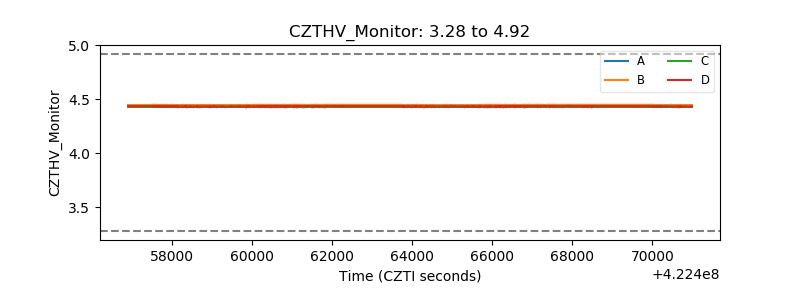 |
| D_VDD | 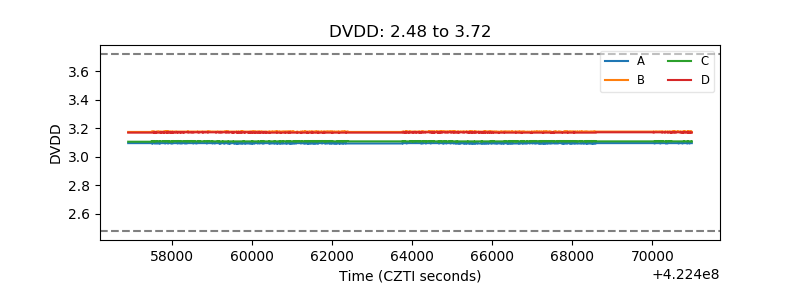 |
| Temperature 1 | 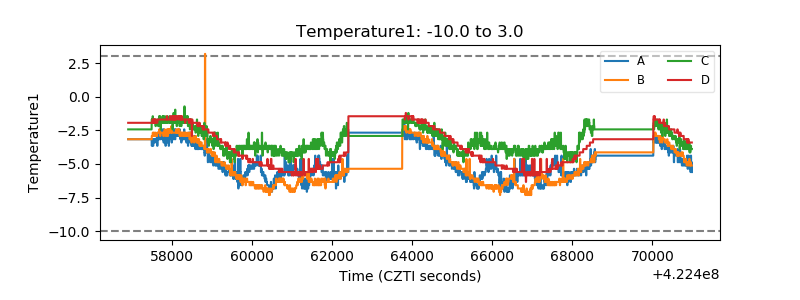 |
| Veto HV Monitor | 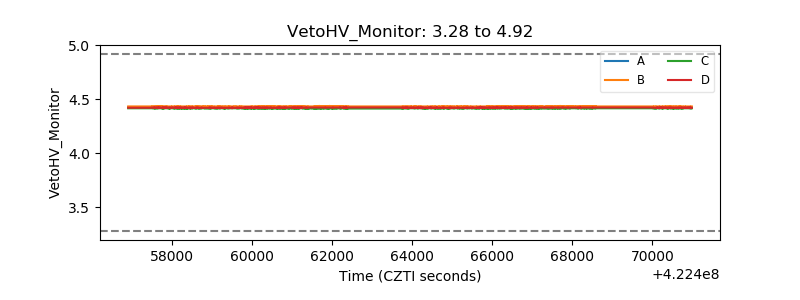 |
| Veto LLD | 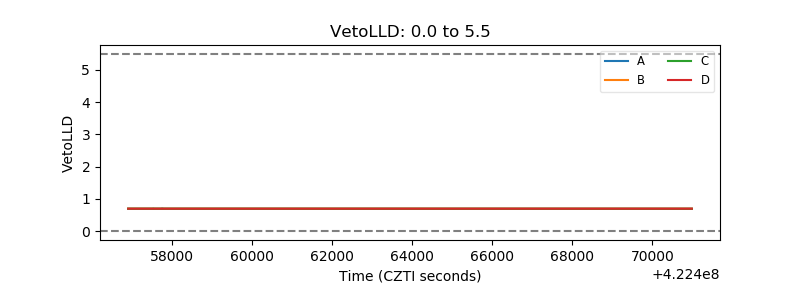 |
| Alpha Counter | 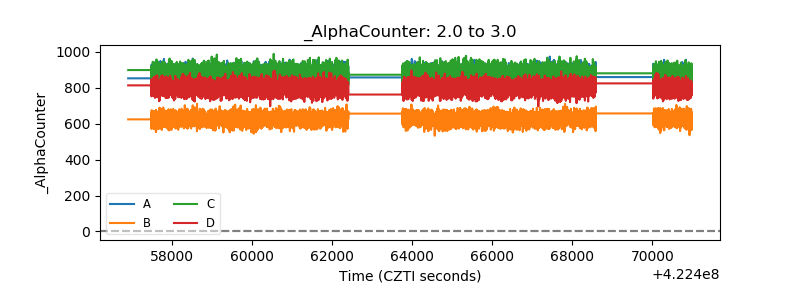 |
| _CPM_Rate | 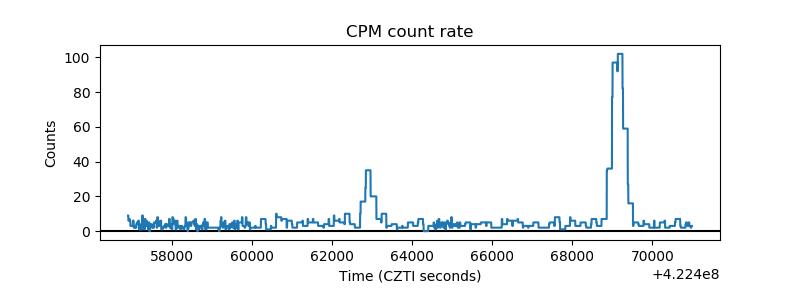 |
| CZT Counter | 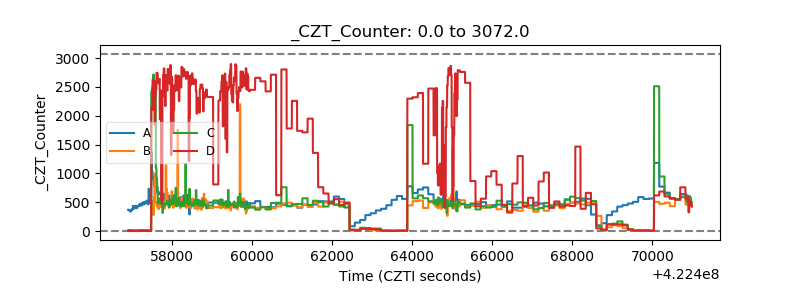 |
| +2.5 Volts monitor | 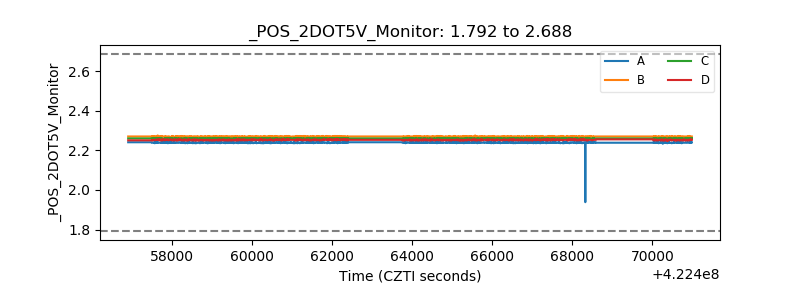 |
| +5 Volts monitor | 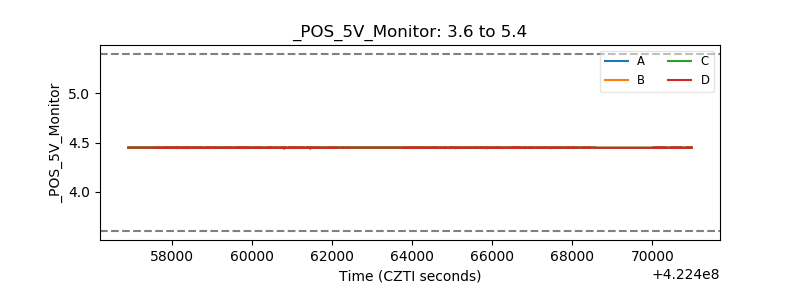 |
| _ROLL_ROT | 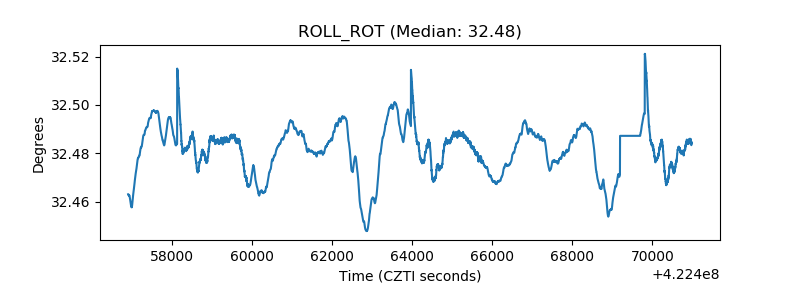 |
| _Roll_DEC | 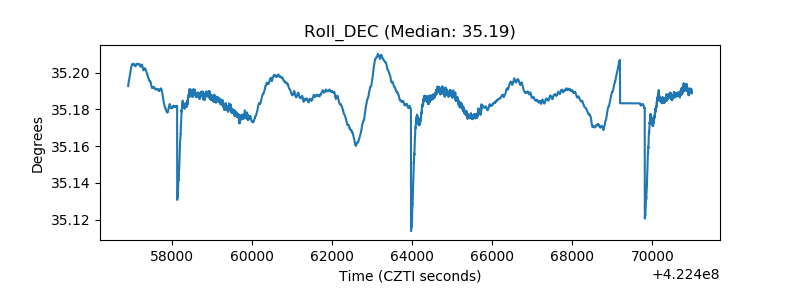 |
| _Roll_RA | 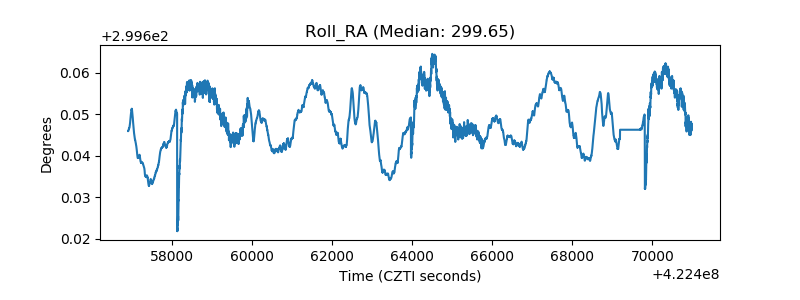 |
| Veto Counter | 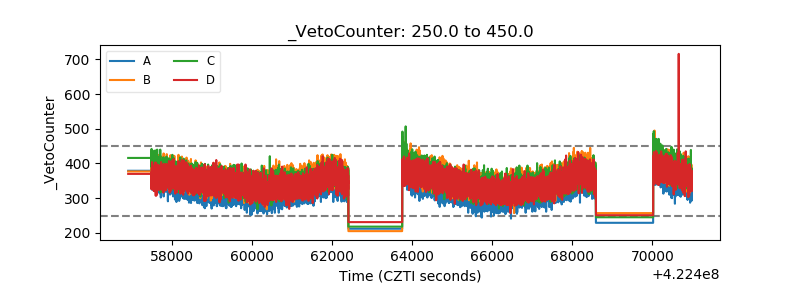 |